Tesla Q2 earnings: TSLA Shares Rise on Rosy Figures, Bitcoin Falls on Sale Announcement

Entry posted by ArvinIG in Analyst article
493 views
Tesla rises in after-hours trading on rosy earnings report; company sold 75% of Bitcoin position, pushing BTC lower and prices look poised to rise near wedge resistance.
Source: Bloomberg
Tesla is higher in after-hours trading after posting a better-than-expected earnings report for its second quarter. The electric-vehicle company saw revenue at $16.9 billion, beating the $16.88 billion consensus forecast and rising more than 40% on a year-over-year basis. Earnings per share (EPS), on an adjusted basis, were $2.27, well above the $1.83 estimate. The company generated a slightly softer-than-expected free cash flow number at $621 versus the $625.2 million expected.
A 50% average annual growth rate for its vehicle deliveries remains a rather soft number for guidance especially considering the additional manufacturing capacity available for production. There were disruptions to manufacturing caused by Covid lockdowns in China. However, Tesla sees its Shanghai production rate increasing in the second half of the year.
The Fremont Factory in California produced a record number of vehicles, an encouraging milestone. Those vehicles were more expensive to construct, with automotive gross margin falling to 27.9% from 32.9%. That shows high inflation and competition for battery components are impacting profitability. Investors may brush that aside, given that it remains among the best in the industry.
Tesla converted $936 million worth of Bitcoin into fiat currency, boosting its balance sheet cash position. The conversion accounted for around 75% of Tesla’s Bitcoin. A specific impairment charge wasn’t given, but it is likely significant. The news weighed on BTC, with prices falling near the 23,000 level. In early 2021, Tesla announced the purchase of $1.5 billion in Bitcoin, a move that was seen as adding legitimacy to the cryptocurrency. Overall, the numbers are encouraging and may see Tesla’s share price perform well in the coming weeks.
Tesla technical outlook
Prices are at triangle resistance, which may lead to a run higher if bulls can overtake the level. Meanwhile, the 20-day Simple Moving Average (SMA) is on track to cross above the 50-day SMA, a bullish sign. The MACD and RSI oscillators are also showing positive movement, adding to the bullish outlook. Still, prices need to climb more than 50% to reach levels seen in April around 1,152.
Tesla daily chart
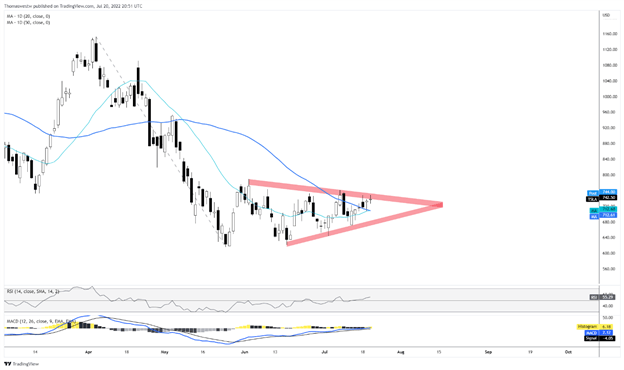
Source: TradingView
21 July 2022
This information has been prepared by DailyFX, the partner site of IG offering leading forex news and analysis. In addition to the disclaimer below, the material on this page does not contain a record of our trading prices, or an offer of, or solicitation for, a transaction in any financial instrument. IG accepts no responsibility for any use that may be made of these comments and for any consequences that result. No representation or warranty is given as to the accuracy or completeness of this information. Consequently any person acting on it does so entirely at their own risk. Any research provided does not have regard to the specific investment objectives, financial situation and needs of any specific person who may receive it. It has not been prepared in accordance with legal requirements designed to promote the independence of investment research and as such is considered to be a marketing communication. Although we are not specifically constrained from dealing ahead of our recommendations we do not seek to take advantage of them before they are provided to our clients.


.jpeg.98f0cfe51803b4af23bc6b06b29ba6ff.jpeg)


0 Comments
Recommended Comments
There are no comments to display.
Create an account or sign in to comment
You need to be a member in order to leave a comment
Create an account
Sign up for a new account in our community. It's easy!
Register a new accountSign in
Already have an account? Sign in here.
Sign In Now