EUR/USD outlook 2023: Can the recent strong showing continue?

Entry posted by MongiIG in Market News
933 views
After dipping below the key parity level, the EUR/USD has roared back to life with a 10% bounce from its 20-year low. Here are three key things to watch for in 2023.
 Source: Bloomberg
After dipping below the key parity level in late September this year, the EUR/USD has roared back to life with a 10% bounce from its 20-year low, with November delivering its best monthly performance since July 2020. A confluence of factors will remain on watch in the upcoming year, which will dictate if the strong showing can continue. These key catalysts range from how hawkish Federal Reserve (Fed) policies will be in terms of its terminal rate, China’s reopening story, the energy crisis spurred by Ukraine-Russia tensions and the risk environment.
Here are three key things to watch for in 2023:
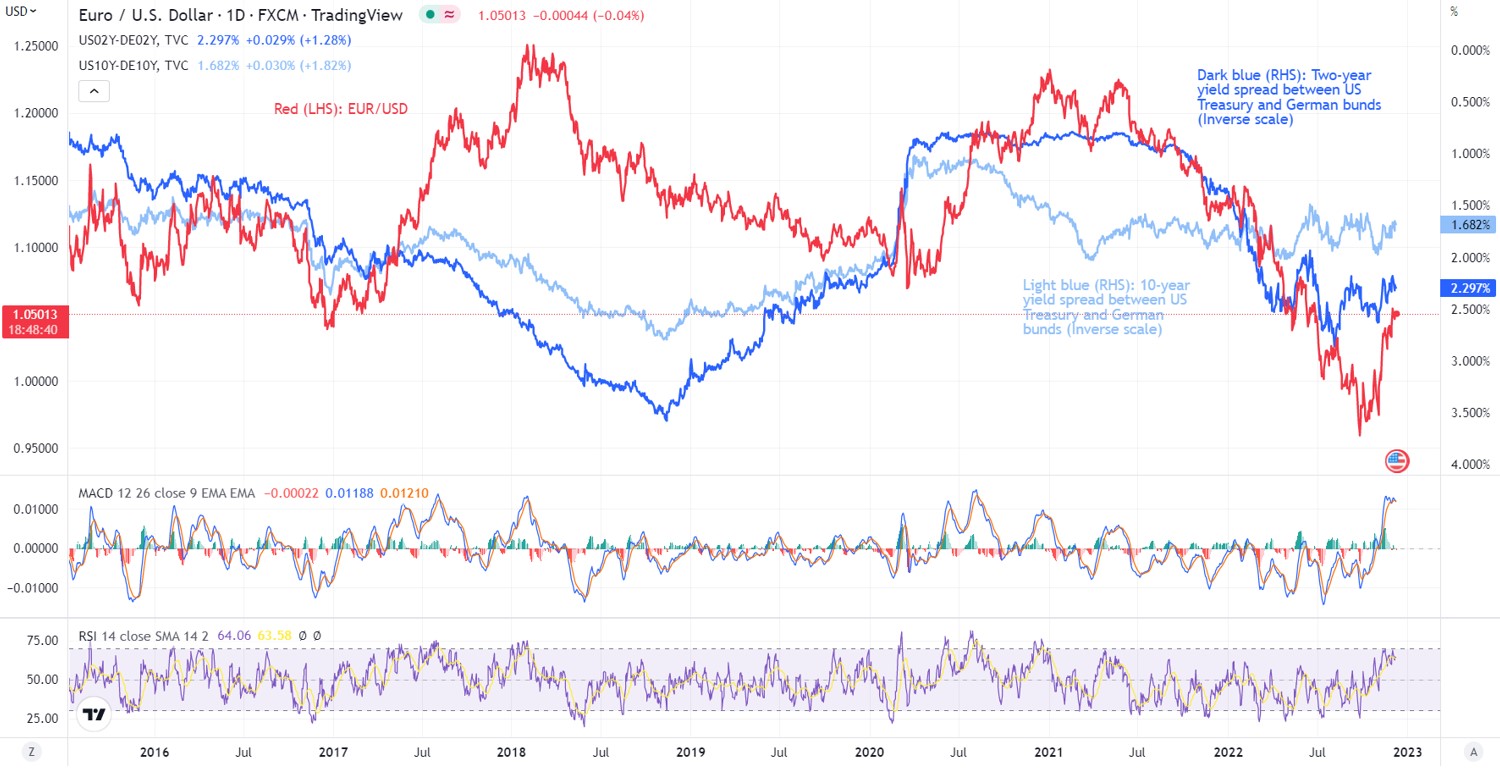
US-Germany bond yield spread seemingly less of a key driving force
While the spread between the US Treasury yields and German bond yields could be a catalyst in driving the EUR/USD, the relationship seems to be less of a driving force, both on a two-year and 10-year basis. In terms of monetary policies, the European Central Bank (ECB) has largely been playing catch-up, delivering a series of back-to-back 75 basis-point (bp) moves after being behind the curve in tackling a 40-year high in inflation. That said, there have been talks that much of the front-loading may have been done and expectations are that relatively weaker economic conditions in the Eurozone compared to the US may prevent the ECB from being more hawkish than the Fed. With that, while there are more three more 50 bp moves being priced for the ECB into mid-2023, market participants may look at it with a ‘less hawkish’ view by focusing on the rate downshift in the absence of further hawkish guidance from the central bank. Decision from the US Fed could potentially exert greater influence on the pair versus the ECB’s decision.
 Source: TradingView
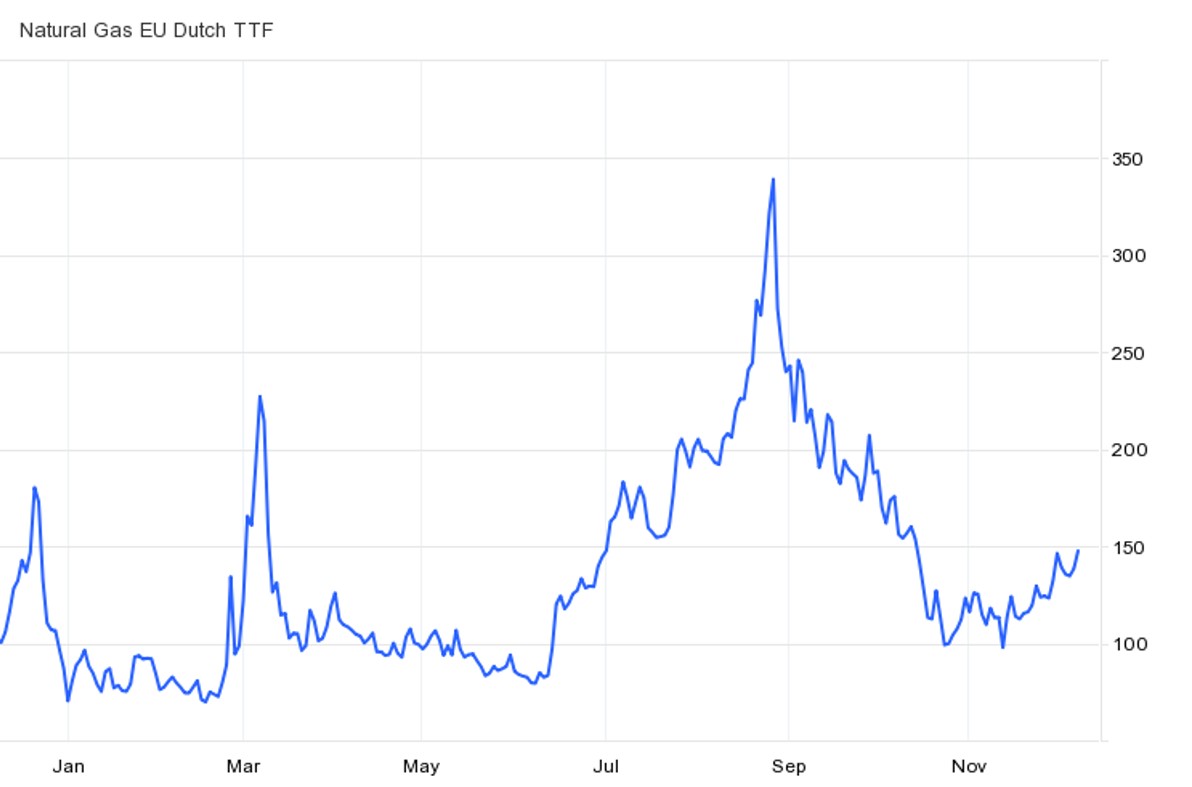
Energy crisis threat remains a prominent risk into 2023
With unresolved geopolitical tensions with the Kremlin, the Eurozone’s attempt to shift its energy sources away from Russia will remain a choppy path into 2023. Threat of a complete shutdown in Russia’s natural gas flows to Europe remains on the card and any surge in natural gas prices may pose downside risks to the EUR on the persistent-inflation story. For now, fuller-than-normal gas inventories and large LNG imports have provided some buffer to cushion winter supplies shortages. However, the struggle with the demand-supply imbalance may be a prolonged one. China’s shift towards reopening may drive greater competition for LNG imports next year, while the last remaining pipeline bringing Russian gas to western Europe hangs by a thread, translating to upside risks in energy pricing pressures for consumers. After coming off sharply from its August peak, Europe’s natural gas prices have formed a base, suggesting that much of the selling pressure may have been factored in. Any rebound in natural gas prices could be on watch in translating to downward pressure for the EUR.
 Source: tradingeconomics.com
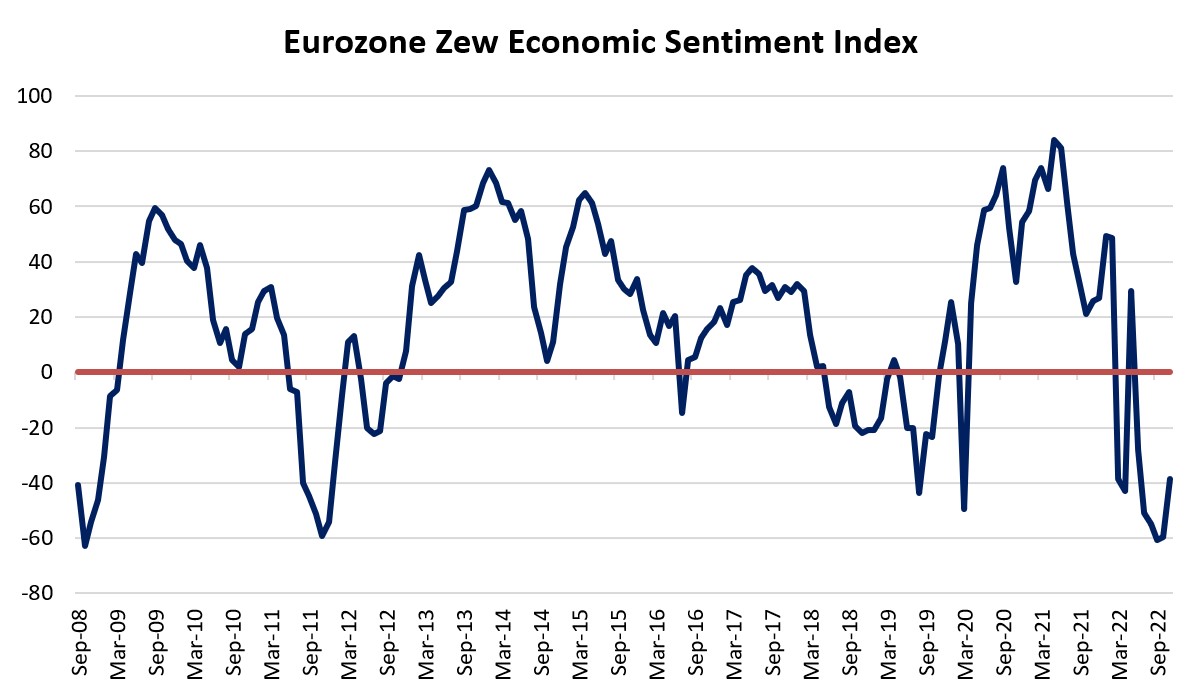
Economic growth conditions in focus to drive longer-term direction
Eurozone’s economic outlook has been looked upon as a limiting upside factor for the EUR/USD this year, having been dampened significantly from higher cost pressures and tighter policies. A look at the Eurozone Zew Economic Sentiment Index revealed sentiments touching its 2008 and 2011 lows, which are levels in line with past economic crises. While the economic indicator’s relationship with the EUR/USD has not been so clear historically, it has seemed more aligned over the past two years, with the October rebound in the EUR/USD in tune with a recovery in economic sentiments as well. Therefore, any bottoming out in economic conditions will continue to be closely watched into 2023. Any validation of the worst-is-over stance in economic conditions could take focus in fuelling further uplift for the EUR/USD.
 Source: Refinitiv
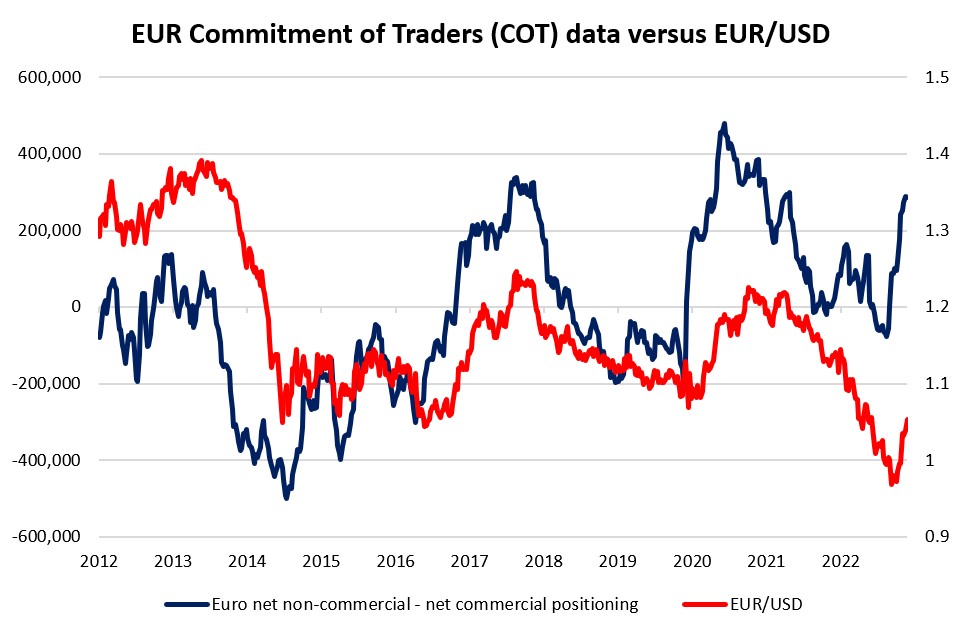
Where are traders’ positioning at?
The CFTC Commitments of Traders (COT) data revealed that positioning for large speculators were in net-short territory for nine consecutive weeks from July to September this year, from which the extreme bearish positioning has paved the way for a short-covering rally. Speculators’ sentiments were tapping on the Fed’s peak hawkishness narrative for the reversal, which drove the unwinding of previous bearish bets for the euro. That brought traders’ net-long positioning back to its June 2021 levels, which showed a sign of increased bullishness. One may watch if the net-long positioning will head above its March 2018 and September 2020 peaks, which may suggest overextended levels. Both of which will mark some weakness in the EUR/USD pair.
 Source: Refinitiv
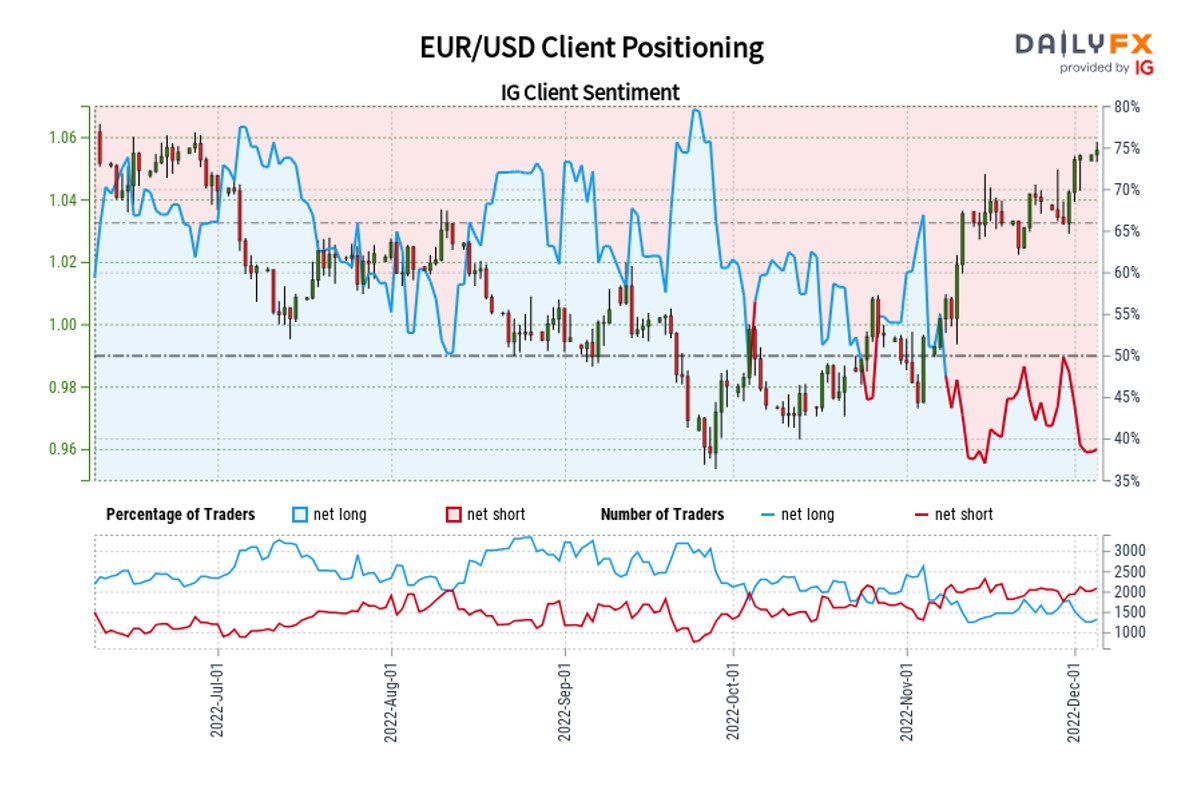
In addition, a look at the IG client sentiment suggests that retail traders’ positioning remains near its recent lows despite the recent rally. With the indicator generally looked upon with a contrarian view, the fact that traders are net-short suggests that EUR/USD may have room to rise.
 Source: DailyFX, IG
Technical analysis
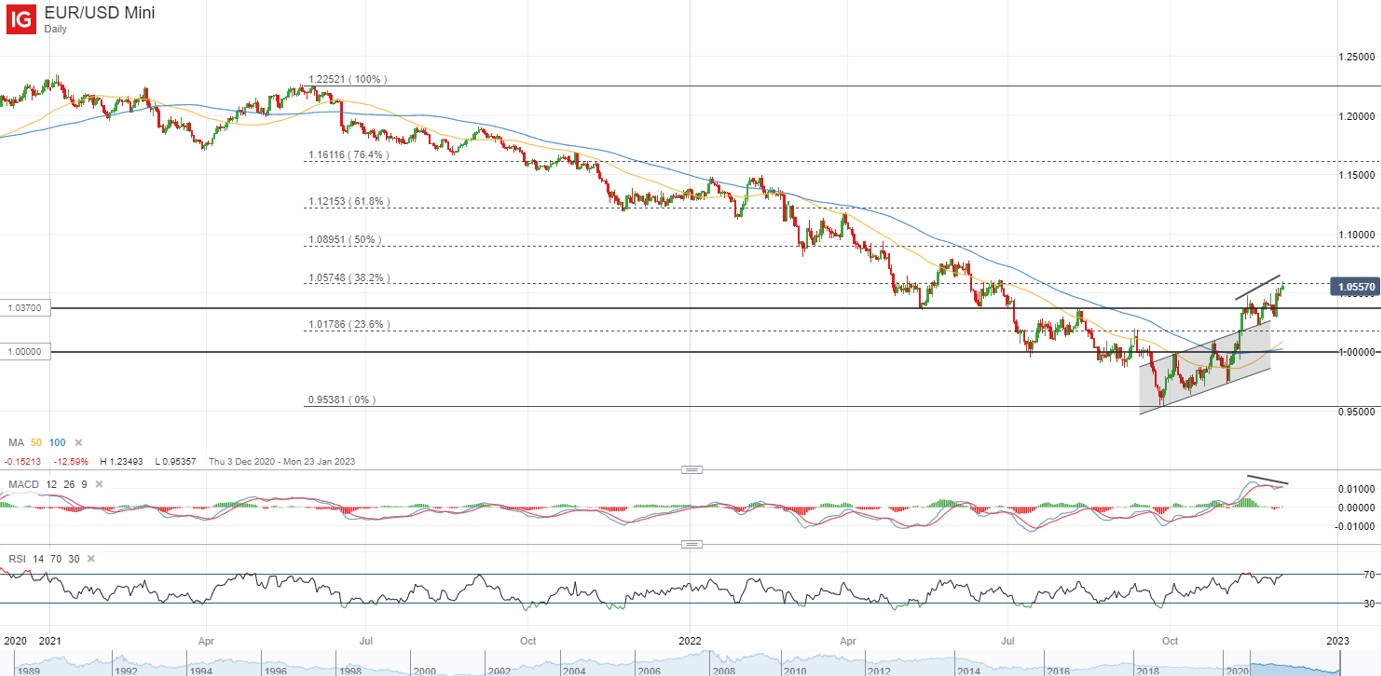
After trading on a downward trend since June last year, a rising channel pattern revealed an attempt for a reversal, as near-term upward momentum was marked by a channel breakout and a bullish crossover of its 50-day and 100-day moving average (MA). The upper channel trendline seems to be serving as a resistance-turned-support, which underpinned the pair on two occasions in recent weeks. That said, the EUR/USD is headed towards a key 38.2% Fibonacci resistance at the 1.057 level, with any weakness running the risk of the formation of a moving average convergence/divergence (MACD) bearish divergence. A retracement could leave the 1.037 level on watch as potential support for a higher low.
 Source: IG charts
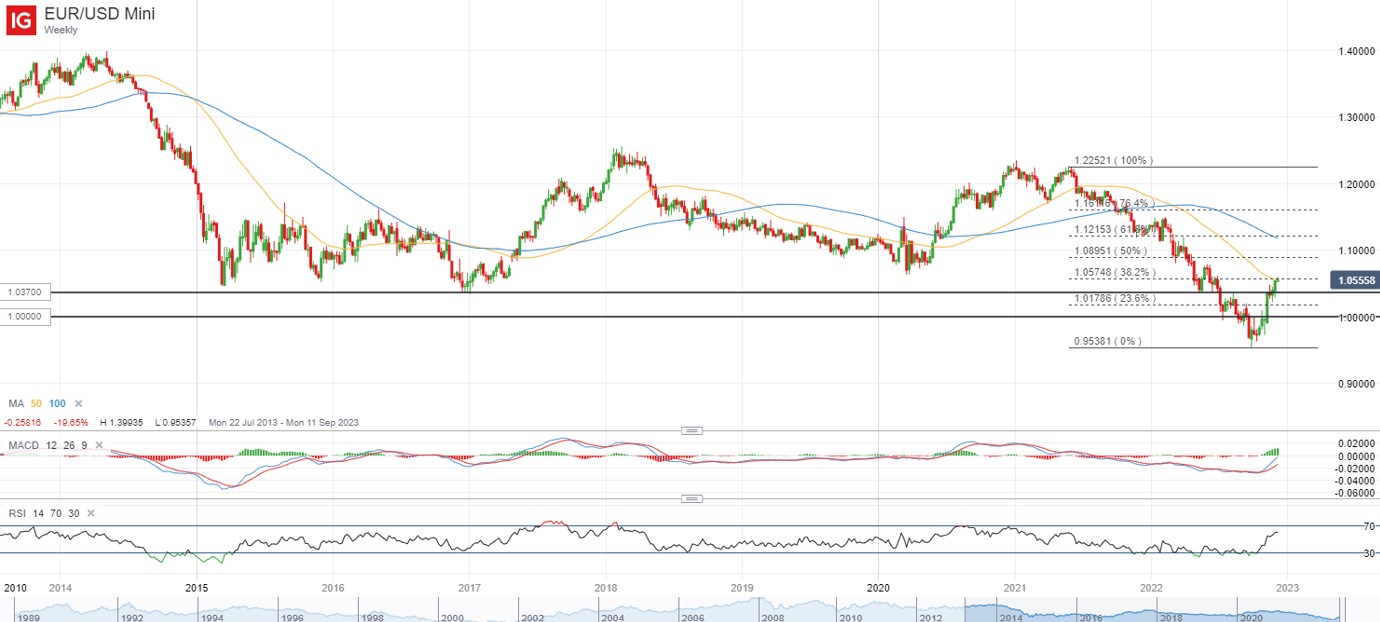
On the weekly timeframe, the 1.037 level has once again revealed to be a key support, which was the bottom for the EUR/USD back in 2015 and 2017. That may provide an ongoing upward bias, as long as the pair defends this level. A 50-period MA on the weekly chart currently stands in the way, and any successful attempt to overcome this level could pave the way towards the 1.089 level next.
 Source: IG charts


.jpeg.98f0cfe51803b4af23bc6b06b29ba6ff.jpeg)

0 Comments
Recommended Comments
There are no comments to display.
Create an account or sign in to comment
You need to be a member in order to leave a comment
Create an account
Sign up for a new account in our community. It's easy!
Register a new accountSign in
Already have an account? Sign in here.
Sign In Now