

MongiIG
-
Posts
9,888 -
Joined
-
Last visited
-
Days Won
41
Content Type
Profiles
Forums
Blogs
Events
Community Tutorials
Store
Posts posted by MongiIG
-
-
Market update: Japanese yen provides reversal hints: USD/JPY, EUR/JPY, GBP/JPY setups
Explore the recent bullish surge in the Japanese yen post-hawkish Bank of Japan meeting. Analyse key charts, including USD/JPY. Gain insights into technical dynamics in this concise overview.
 Source: Bloomberg
Japanese yen adds to bullish lift
The Japanese yen appears to be building on some early upward momentum, in the aftermath of a moderately hawkish Bank of Japan (BoJ) meeting in January. While there was no change to negative interest rate or alterations to the ongoing yield curve control, BoJ governor Kazuo Ueda sees the likelihood of reaching the 2% target as “gradually increasing”. A simple, constructed Japanese yen index below shows a steady rise in the value of the yen yesterday, and today thus far.
Constructed Japanese yen index- equal weighted average of USD/JPY, GBP/JPY, EUR/JPY, AUD/JPY
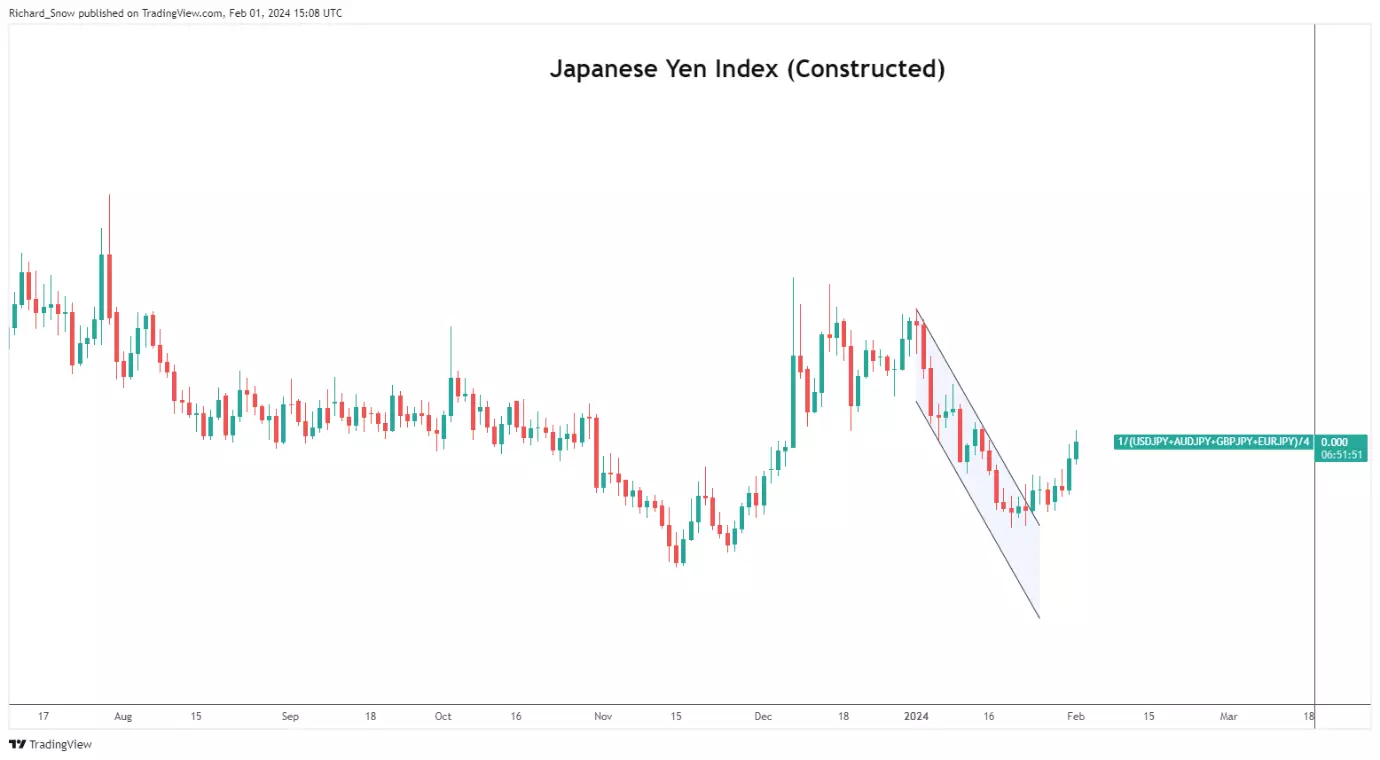 Source: TradingView
The weekly hanging man candle was identified in the weekly US dollar forecast, and it signalled a possible move lower in USD/JPY ahead of this week. Since then, the subsequent red candle (this week thus far) heads lower, testing the 146.56 mark.
USD/JPY weekly chart
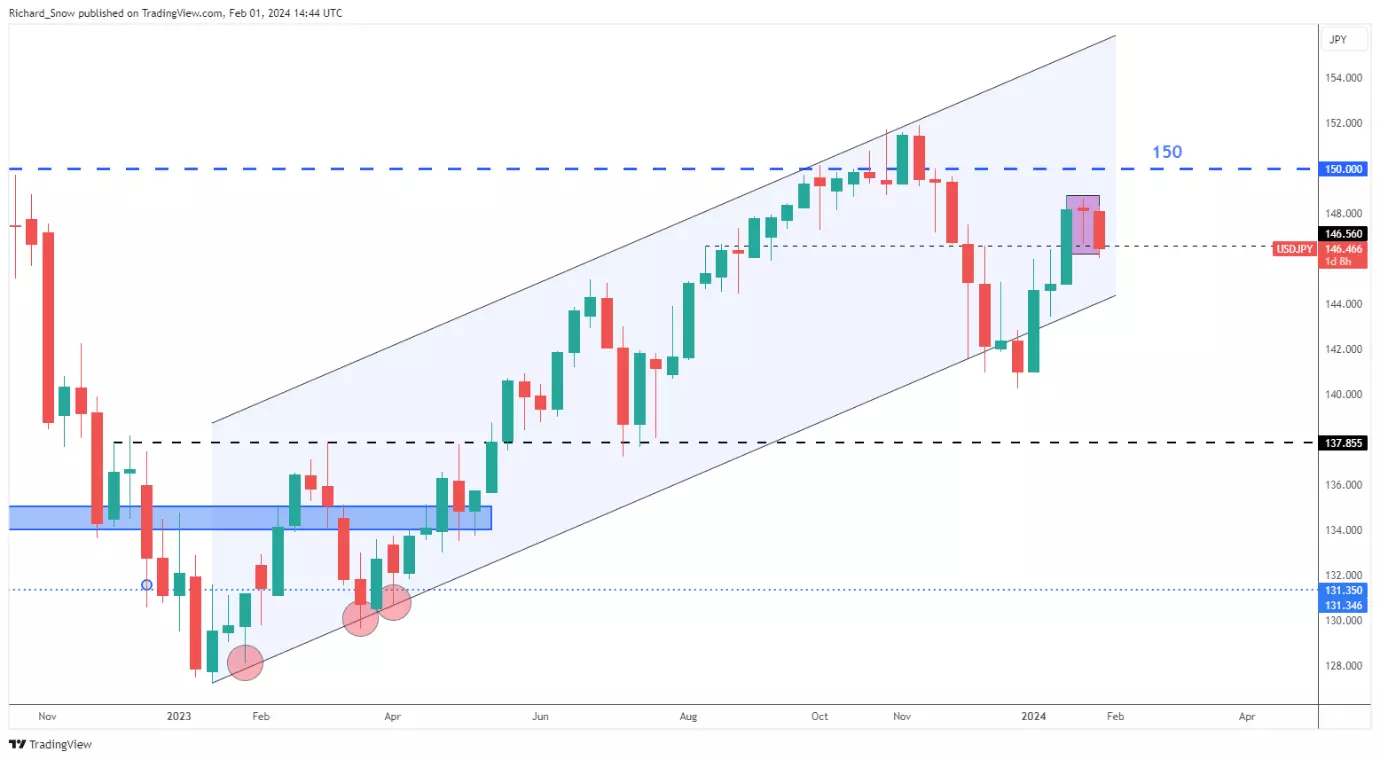 Source: TradingView
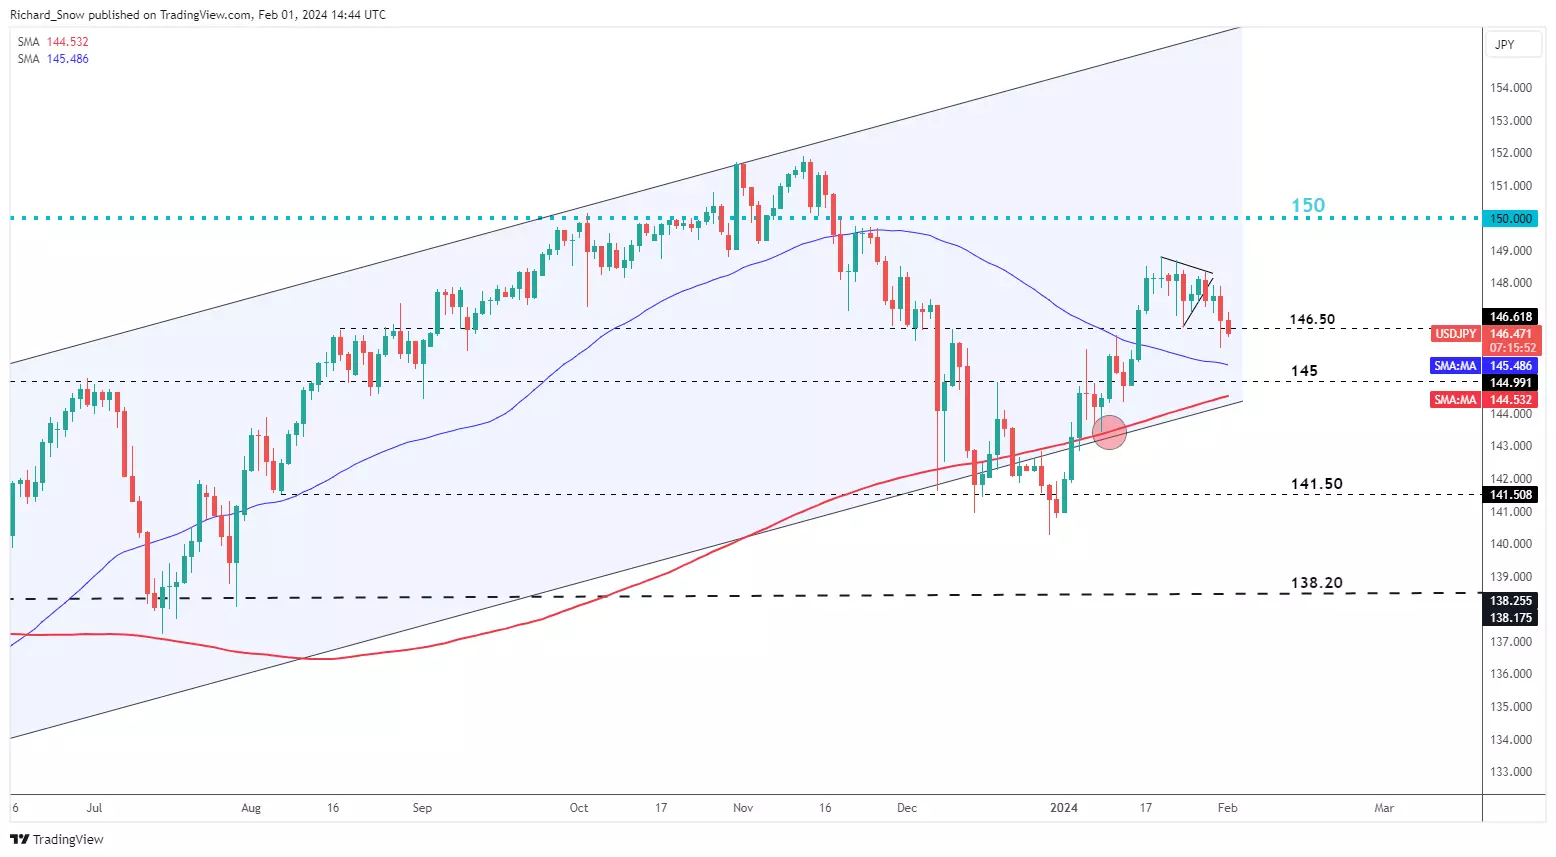
The daily chart shows the invalidation of a developing bullish pennant as price action heads lower. This presented an example where the longer timeframe view clashed with shorter-term, daily developments highlighting the importance of multi-timeframe analysis and recognition of the longer-term dynamics.
The pair currently tests the 146.50 level with 145 not far away. It is then that the 200-day simple moving average appears at long-term channel support. The zone of support may be difficult to breach should price action drop enough to test the area.
USD/JPY daily chart
 Source: TradingView
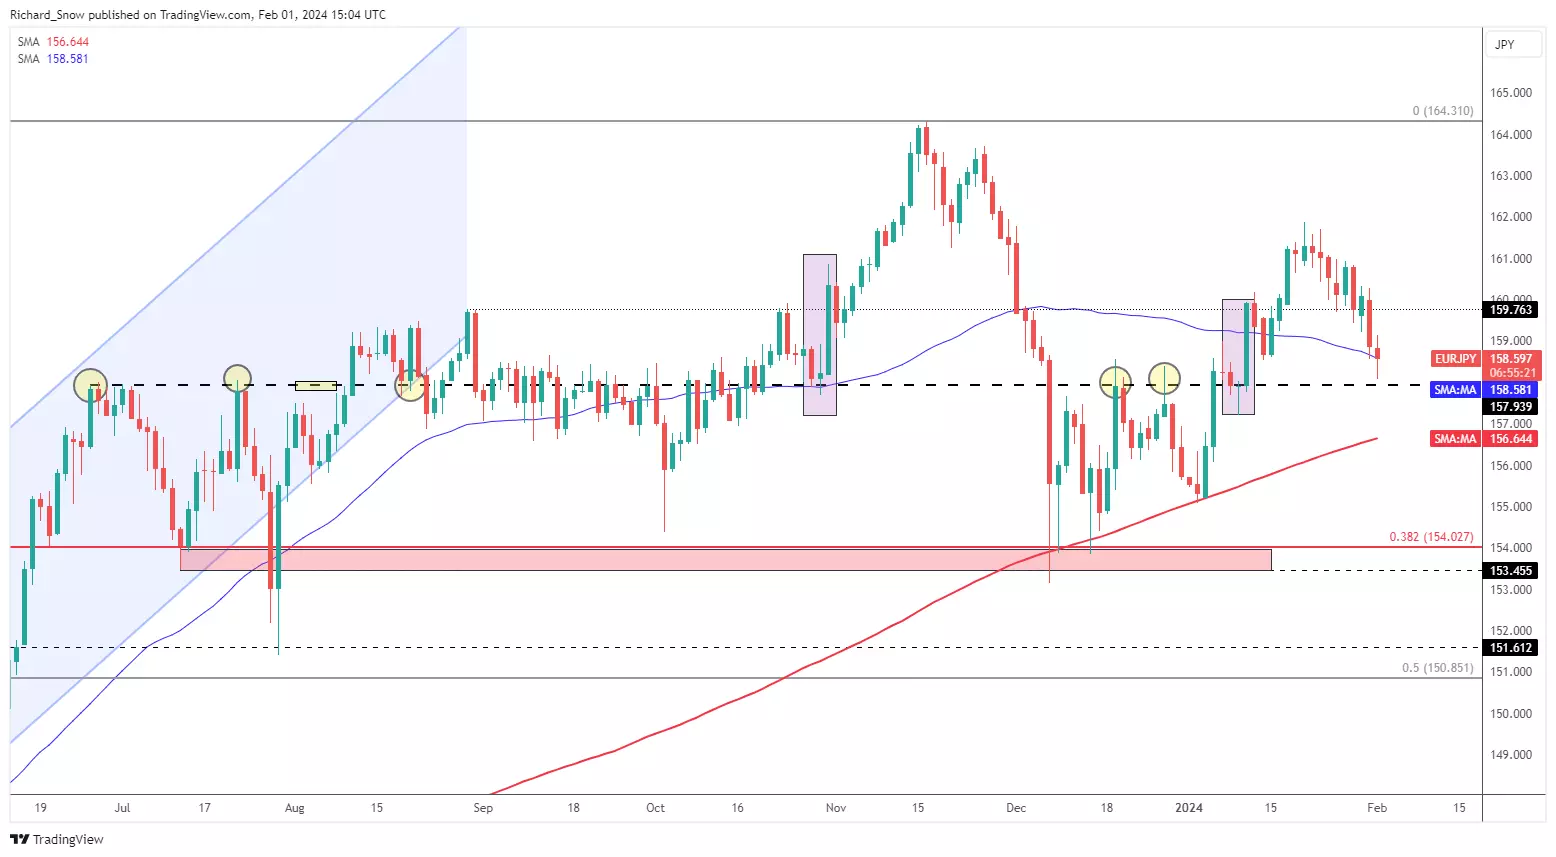
EUR/JPY approaches key pivot point
EUR/JPY signalled a slowdown in bullish momentum (evidenced by longer upper wicks) before stalling and heading lower. The pair now tests the 50-day simple moving average but more importantly, heads towards a key pivot point in 157.94. The level has come into play as resistance in June, July and December of last year and provided a zone of resistance throughout September (on a closing basis).
The recent selloff has been characterised by two bearish engulfing candles, helping to spur on sellers. The 200 SMA is the next level of support at 156.64 if the pair has enough momentum to breach 157.94. In the event Support process too much to handle once again, 159.76.
EUR/JPY daily chart
 Source: TradingView
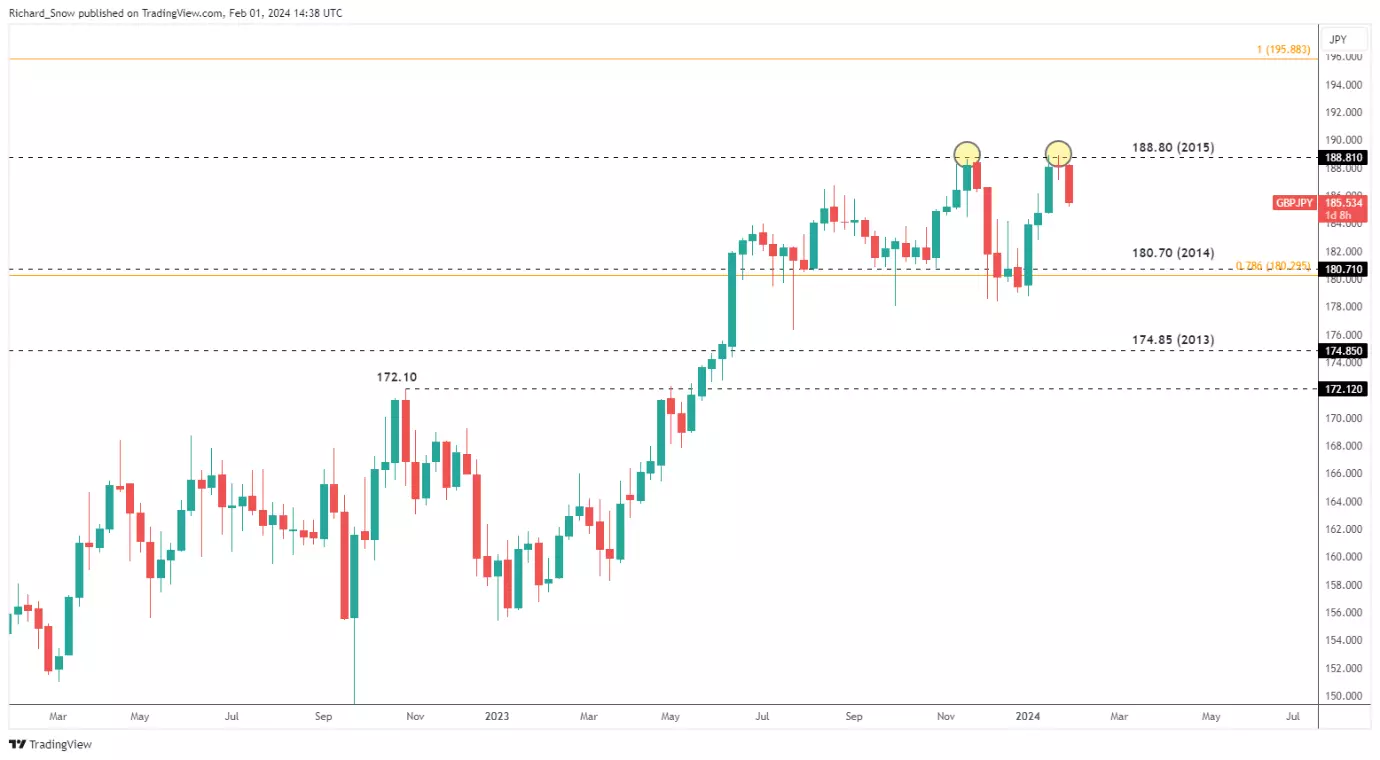
GBP/JPY ‘double top’ limits further upside potential
On the weekly GBP/USD chart, a notable double top appears to be limiting a bullish continuation over the long-term. At 188.80 has proven to be too tough to crack with prices easing before potentially attempting another go.
GBP/USD weekly chart
 Source: TradingView
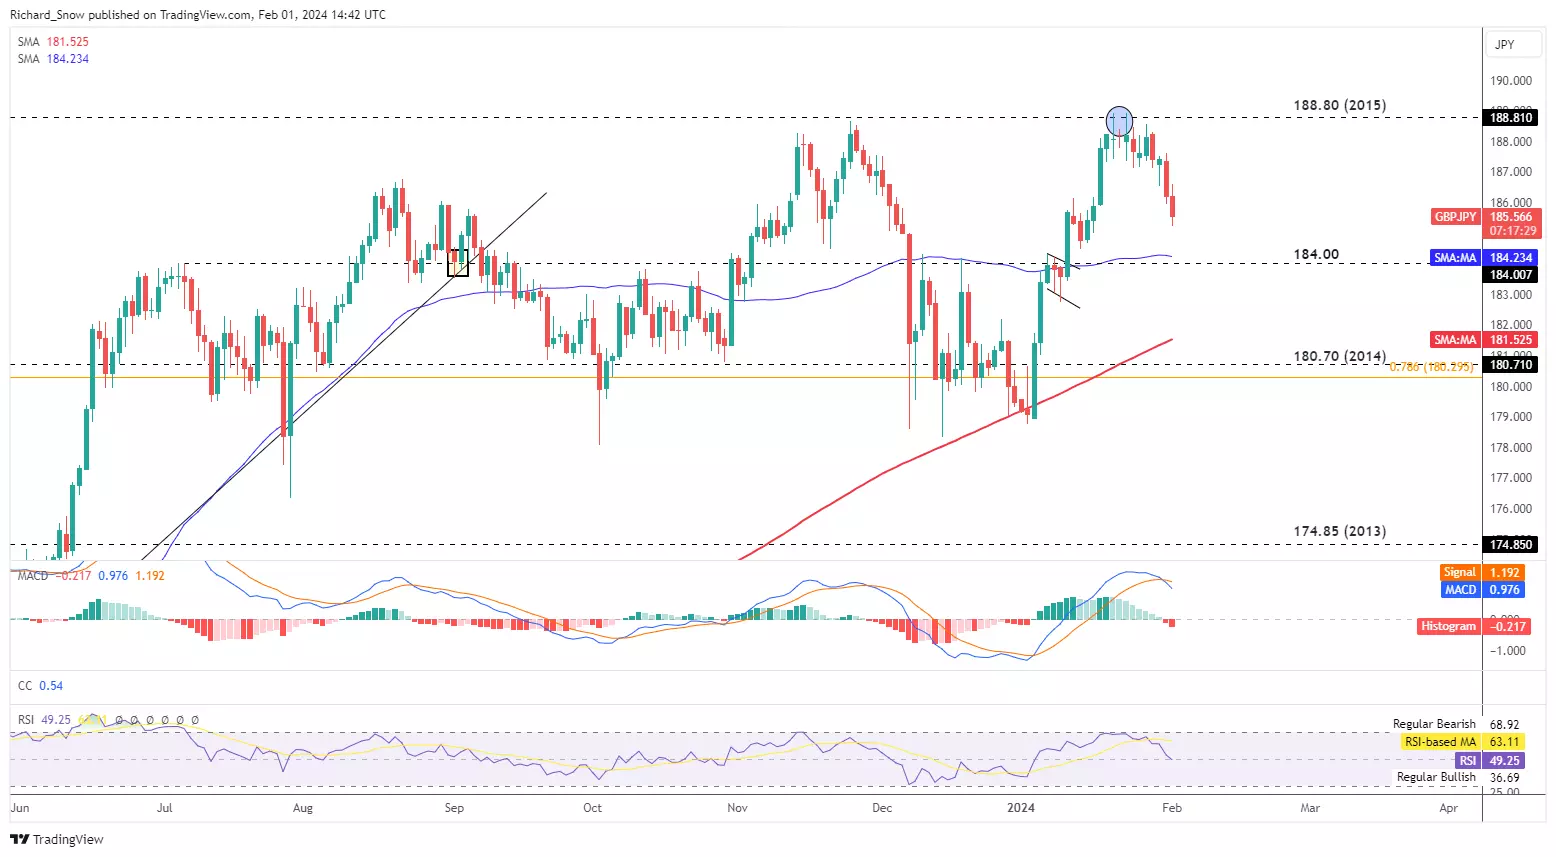
GBP/USD exhibited very little movement considering we heard from the Bank of England, providing its monetary policy update alongside the release of its updated forecasts. At 188.80 it appears a long way away now that the pair had headed lower in recent sessions.
At 184.00 flat is the next level of support to keep in mind as it also coincides with the 50-day simple moving average. The MACD supports the continuation of bearish momentum after exhibiting a bearish crossover, and the RSI currently sits in the neutral zone – suggesting that any attempt to arrest this decline would have to be substantial.
GBP/USD daily chart
 Source: TradingView
This information has been prepared by IG, a trading name of IG Australia Pty Ltd. In addition to the disclaimer below, the material on this page does not contain a record of our trading prices, or an offer of, or solicitation for, a transaction in any financial instrument. IG accepts no responsibility for any use that may be made of these comments and for any consequences that result. No representation or warranty is given as to the accuracy or completeness of this information. Consequently any person acting on it does so entirely at their own risk. Any research provided does not have regard to the specific investment objectives, financial situation and needs of any specific person who may receive it. It has not been prepared in accordance with legal requirements designed to promote the independence of investment research and as such is considered to be a marketing communication. Although we are not specifically constrained from dealing ahead of our recommendations we do not seek to take advantage of them before they are provided to our clients.
-
Retail traders' sell bias plummets, as fresh shorts get enticed into closing out, while longs initiate anticipating its bullish technical overview will hold.
 Source: Bloomberg
FOMC hold, statement change, and Powell pushback
The Federal Open Market Committee (FOMC) opted to hold yesterday, as anticipated, but its statement was changed considerably, removing "additional policy firming" but wanting "greater confidence" that inflation is on track to reaching the central bank’s 2% target. In the press conference after, chairman Powell said he "doesn't think it's likely that the committee will reach a level of confidence by the time of the March meeting to identify March" as the time to cut interest rates, and wanting "the continuation of the good data we've been seeing." Market pricing (CME's FedWatch) is expecting a hold from their March meeting, and the first cut in the current cycle to start in May, but with a slight majority anticipating getting beneath 4% by the end of this year.
Disappointing US data, regional banking scare, and treasury’s announcement
US data generally disappointed yesterday, with ADP's non-farm estimate for the month of January a clear miss at 107K instead of 148K, Chicago PMI (Purchasing Managers’ Index) worsening to 46 and it too beneath forecasts, and the weekly mortgage applications out of MBA dropping 7.2%. The employment cost index for the fourth quarter dropped to 0.9% from 1.1%.
As for treasury yields, they finished the session lower, and this time in real terms as well. There were a few items to digest, with the general risk-off moves in the financial markets, some attention on regional banking shares in retreat following New York Community Bancorp’s surprise loss and dividend cut, and the US Treasury not expecting further increases in auction sizes in the several quarters after April.
There are a few items today, including ISM's (Institute for Supply Management) manufacturing prints, and then tomorrow’s (usually) market-moving Non-Farm Payrolls. In terms of notable earnings, expect the focus to be on Apple, Amazon, and Meta releasing their figures today. All three are components of the Nasdaq 100, and their combined weighting is over 20% of the index.
Nasdaq technical analysis, overview, strategies, and levels
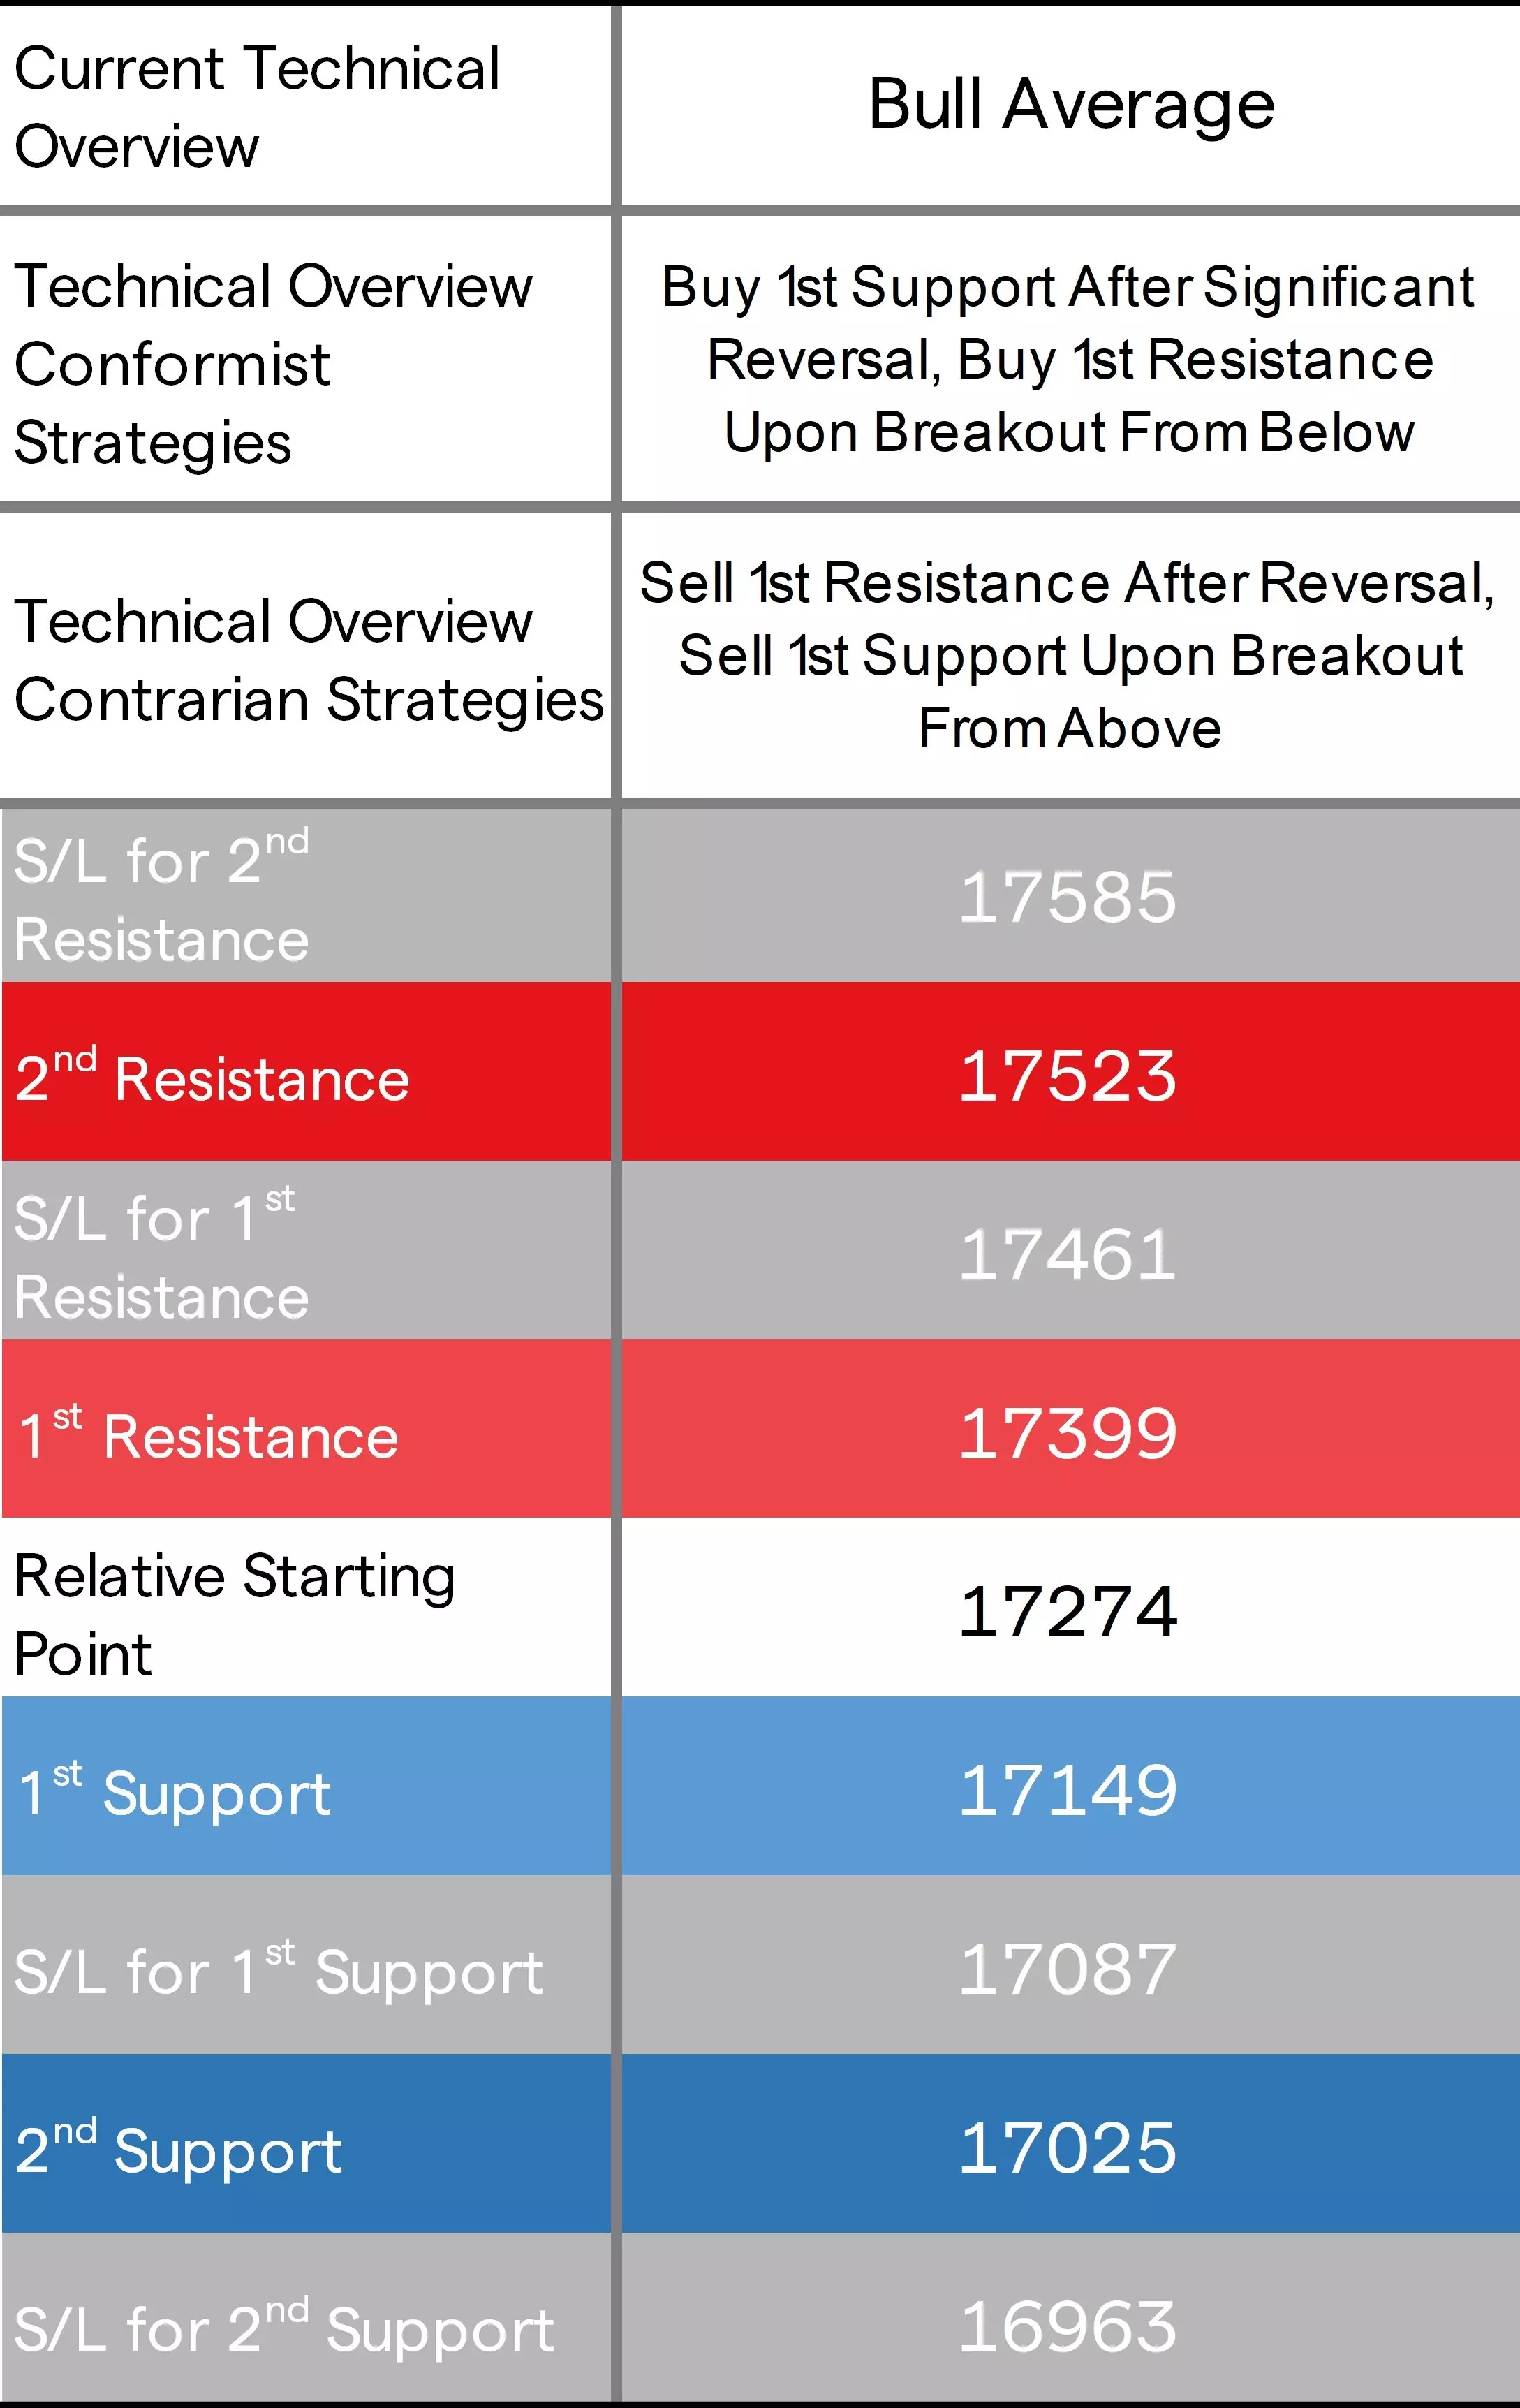
All sectors finished yesterday's session in the red, with defensives lightest on losses, a nasty hit for communication, tech second from the bottom also hurting, and consumer discretionary not far off. The trio suffering meant an obvious red finish for the tech-heavy Nasdaq 100, that was worse than both Dow 30 and the S&P 500.
Its price already was beneath its previous 1st support level early yesterday (after Alphabet and AMD’s releases), and thereafter a move to its previous 2nd support favoring contrarian sell-breakouts. Overall, its technical overview remains ‘bull average’ on both daily and weekly time frames, but that doesn’t mean a lack of caution for conformist buys off key support levels, and more so with what’s in store over the next two days on the fundamental front.
 Source: IG
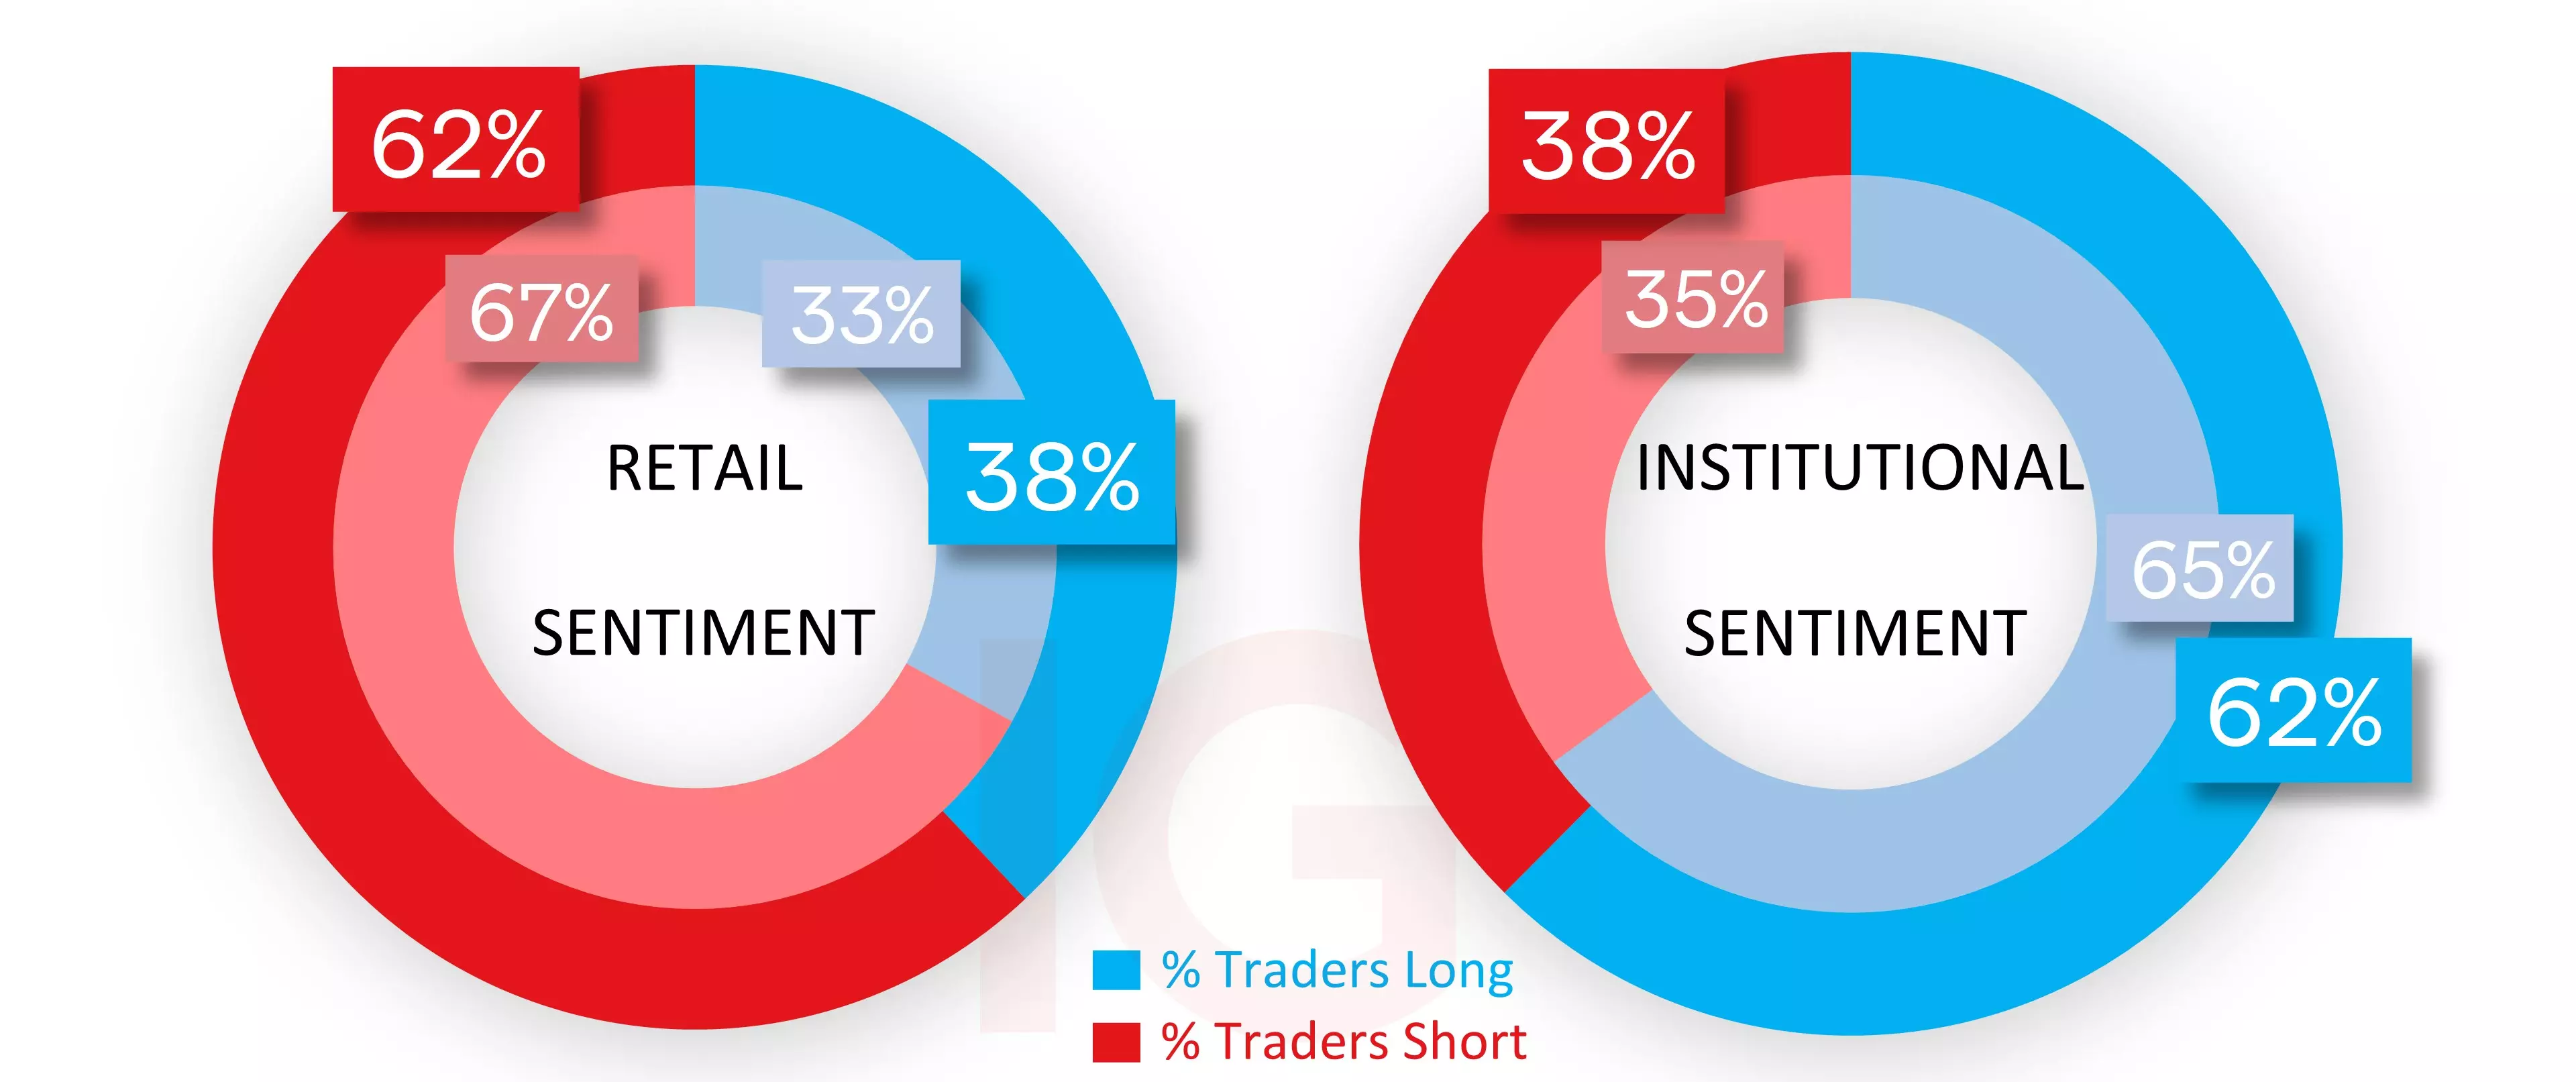
IG client* and CoT** sentiment for the Nasdaq
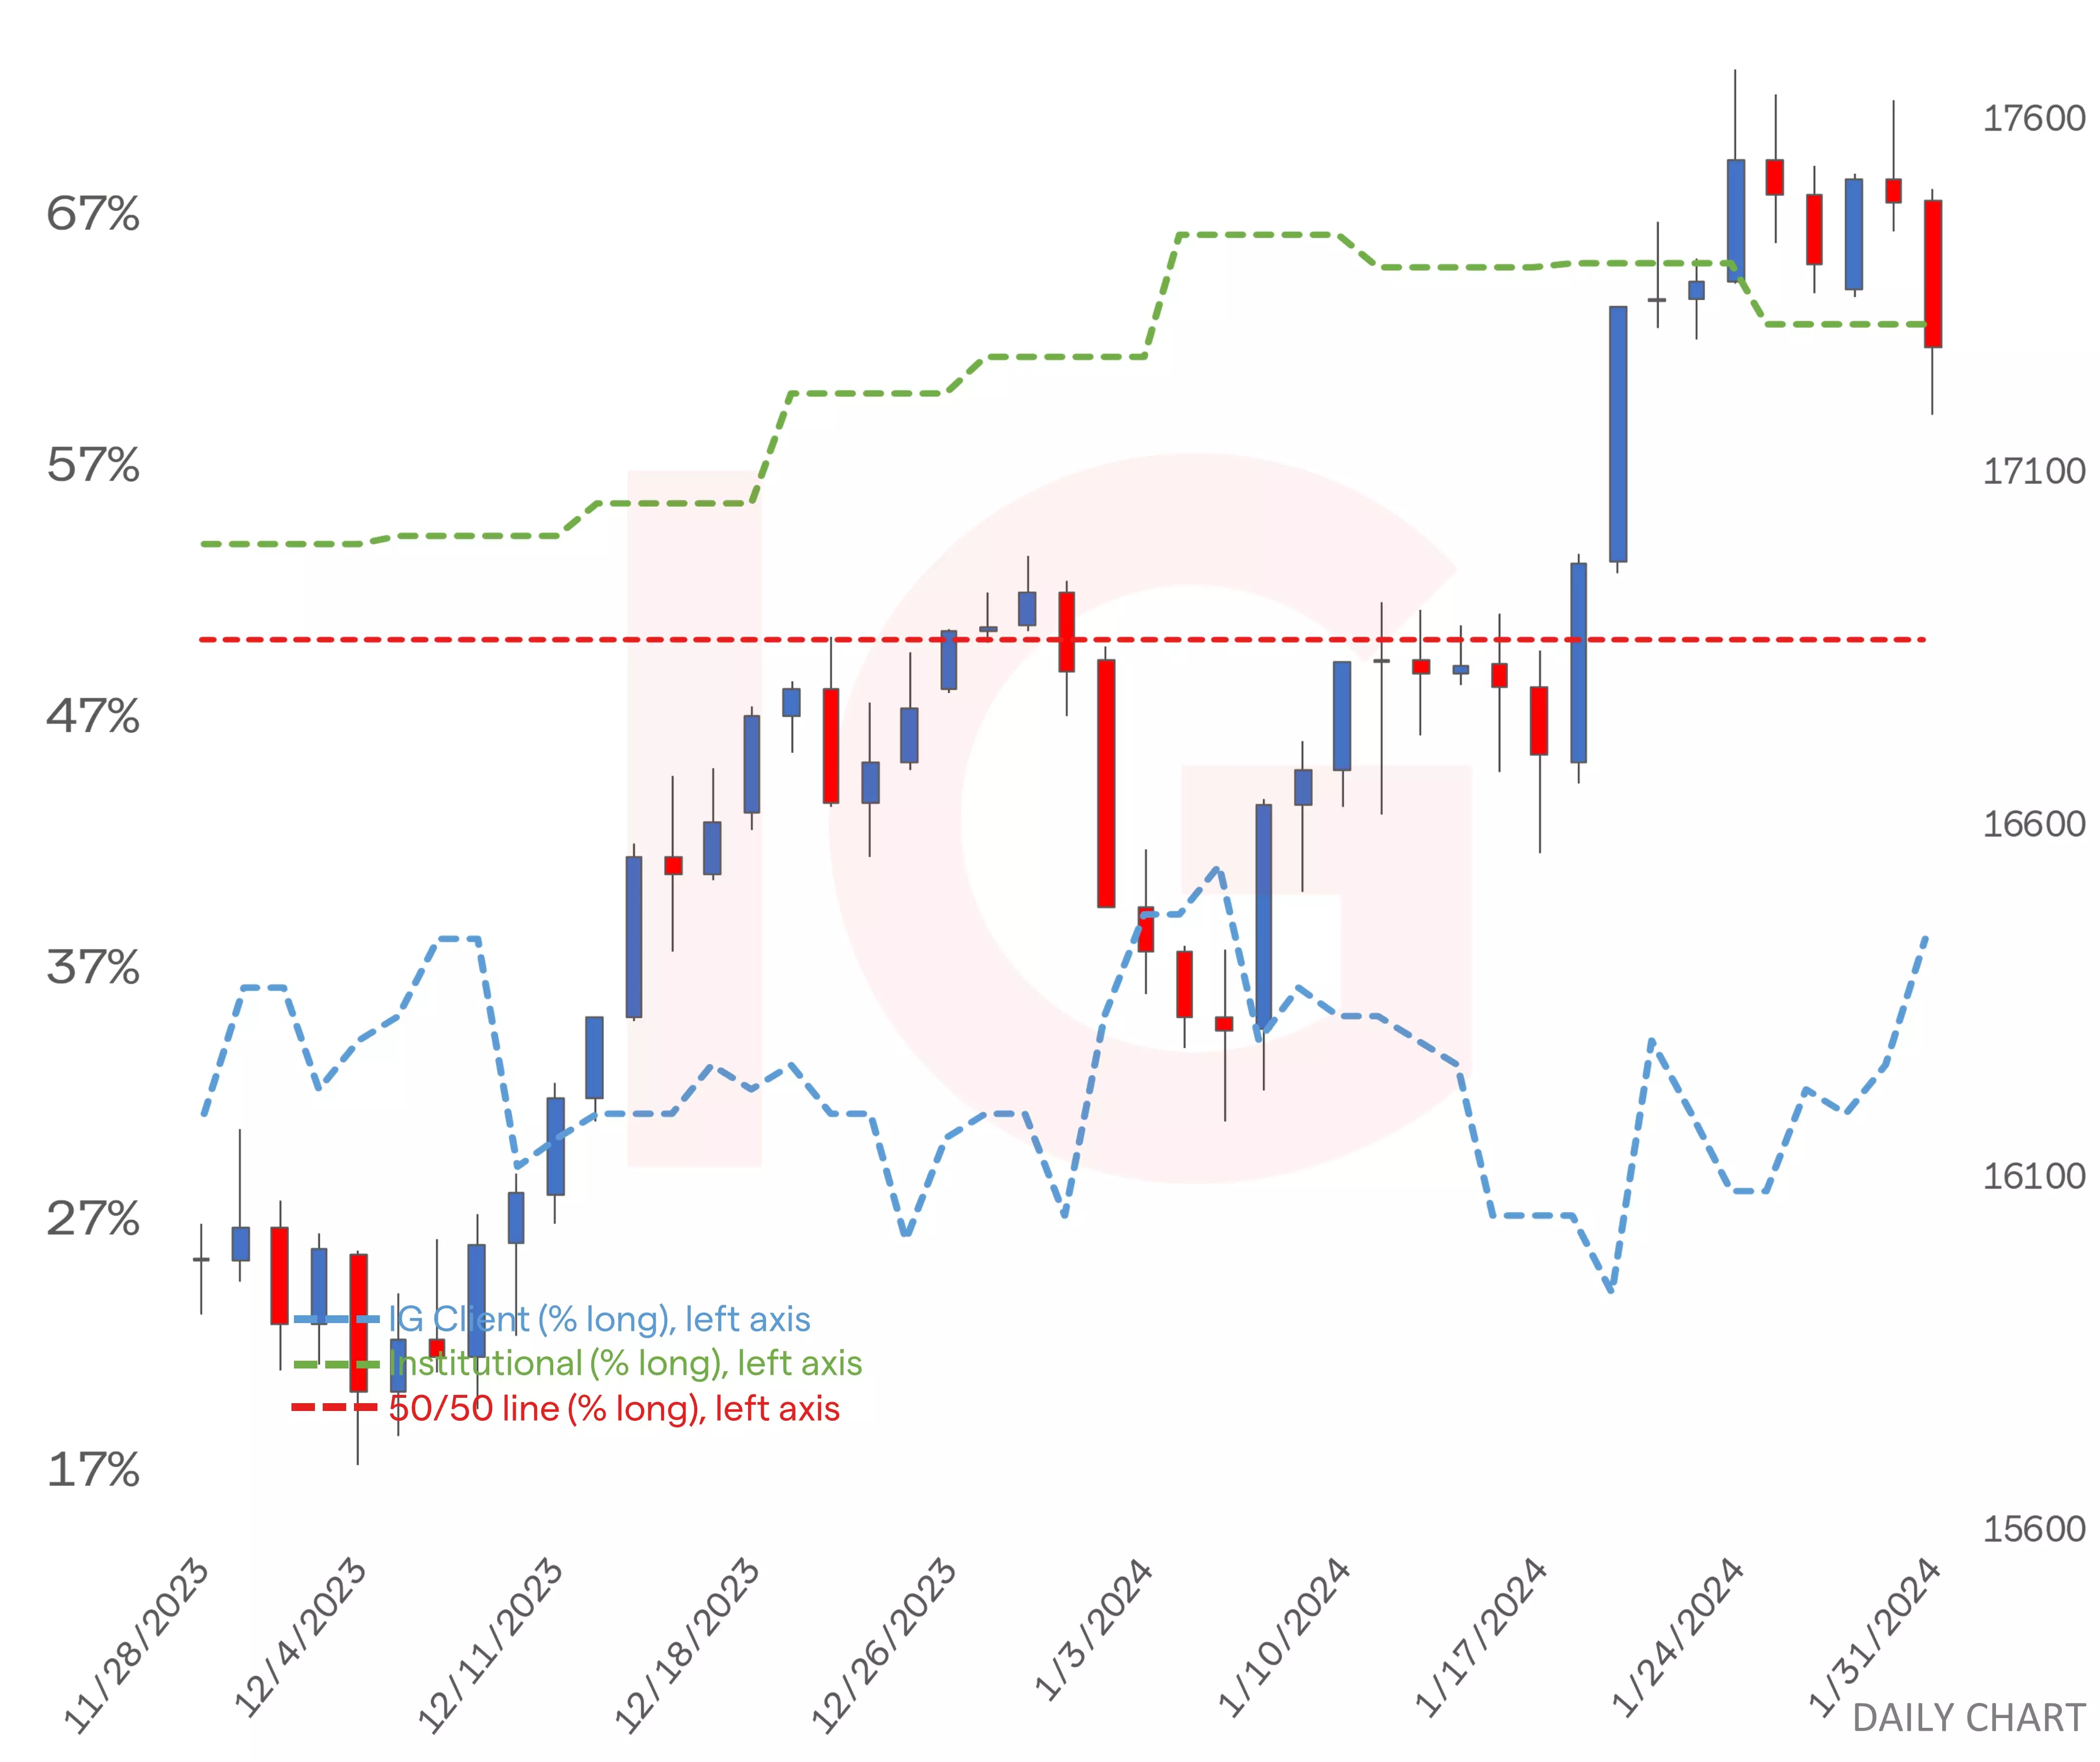
As for sentiment, retail traders have fallen out of heavy sell territory from 67% yesterday to 62% as of this morning, as fresh shorts get further enticed into closing out and longs initiate. CoT speculators as of last Friday’s report are still majority to the buy side, at an exact opposite long 62%.
 Source: IG
Nasdaq chart with retail and institutional sentiment
 Source: IG
- *The percentage of IG client accounts with positions in this market that are currently long or short. Calculated to the nearest 1%, as of today morning 8am for the outer circle. Inner circle is from the previous trading day.
- **CoT sentiment taken from the CFTC’s Commitment of Traders report, outer circle is latest report released on Friday with the positions as of last Tuesday, inner circle from the report prior.
This information has been prepared by IG, a trading name of IG Australia Pty Ltd. In addition to the disclaimer below, the material on this page does not contain a record of our trading prices, or an offer of, or solicitation for, a transaction in any financial instrument. IG accepts no responsibility for any use that may be made of these comments and for any consequences that result. No representation or warranty is given as to the accuracy or completeness of this information. Consequently any person acting on it does so entirely at their own risk. Any research provided does not have regard to the specific investment objectives, financial situation and needs of any specific person who may receive it. It has not been prepared in accordance with legal requirements designed to promote the independence of investment research and as such is considered to be a marketing communication. Although we are not specifically constrained from dealing ahead of our recommendations we do not seek to take advantage of them before they are provided to our clients.
-
The Fed kept interest rates steady in its latest meeting, hinting at a cautious future stance. The upcoming US jobs report gains significant importance, potentially impacting the US dollar, gold prices, and key currency pairs.
 Source: Bloomberg
The Federal Reserve on Wednesday concluded its first monetary policy meeting of the year, voting to maintain borrowing costs unchanged at their present 5.25% to 5.50% range, in a decision widely expected by market participants.
The FOMC also dropped its tightening bias, but signaled that it is not yet ready to ease its stance imminently. Powell went further during his post-meeting press conference, admitting that policymakers may not be confident enough to slash the cost of money at their next gathering.
With the likelihood of a March cut appearing slim at the moment, the US dollar may have room to rebound in the near term, but the recovery thesis depends on incoming information showing that the economy continues to perform well. In the absence of good data, a March move is still a possibility.
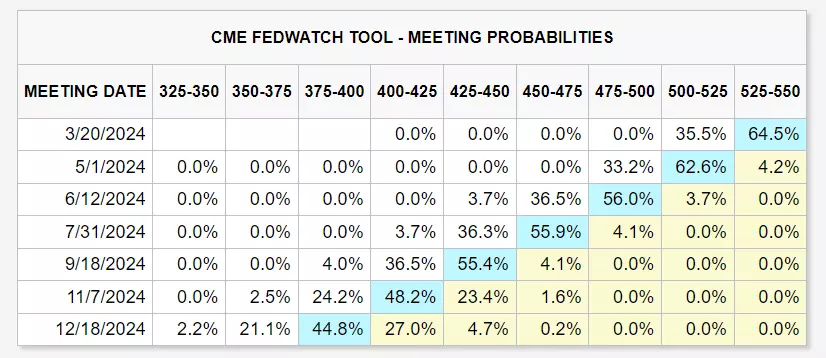 Source: CME Group
In the current context, the December US nonfarm payrolls report will take on added significance. In terms of estimates, US employers are forecast to have added 180,000 jobs last month, though the weakness in the ADP and several PMI surveys for the same period argue for a softer print.
Upcoming us jobs report
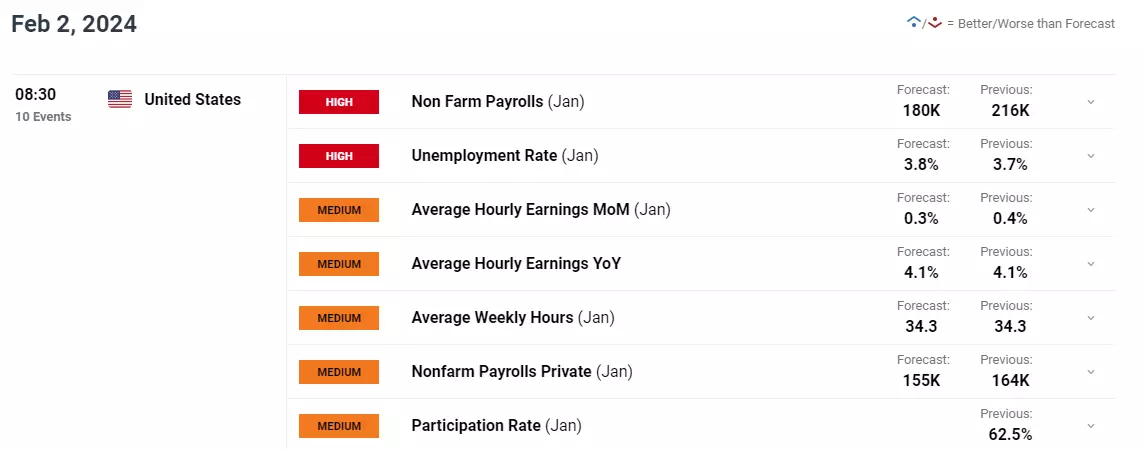 Source: DailyFX
If job growth surprises to the downside by a wide margin, a March rate cut could reenter the picture. This would exert downward pressure on treasury yields and the US dollar, but should support gold prices and other precious metals, including silver.
Conversely, if NFP numbers beat expectations and come on the strong side, we could see further unwinding of dovish bets on the Fed’s policy path - a bullish outcome for yields and the greenback. Gold, however, would not fare well in this scenario.
Gold price technical analysis
Gold inched higher on Wednesday but failed to clear resistance at $2,050, with prices pulling back after testing this area. It's too early to determine if this technical ceiling will hold, but in case it does, XAU/USD may retreat towards $2,005. On further weakness, a move towards $1,990 could materialize.
In contrast, if bulls regain decisive control of the market and manage to drive prices decisively above $2,050, buying momentum could gather pace, setting the stage for a possible rally towards $2,065. Above this pivotal level, all eyes will be on $2,065—the highs from late December.
Gold price daily chart
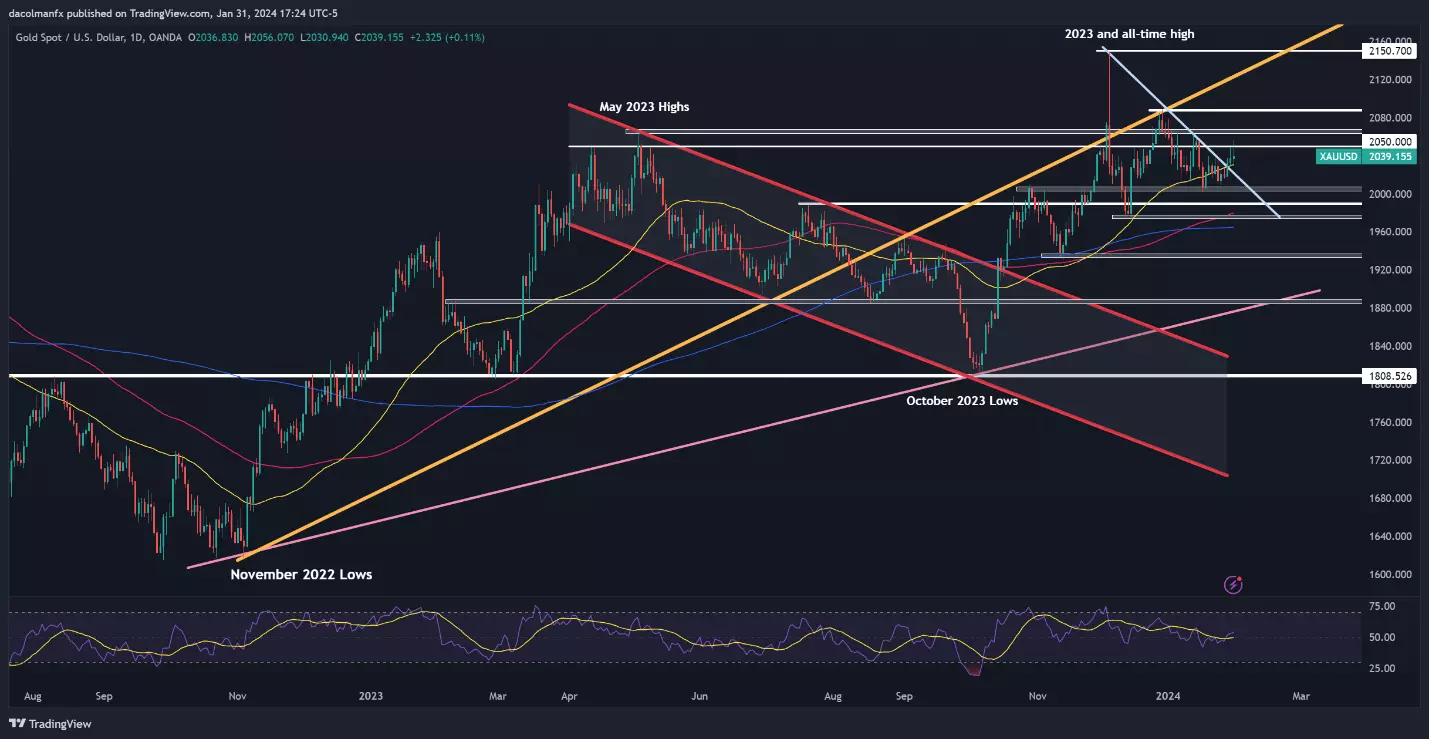 Source: TradingView
EUR/USD technical analysis
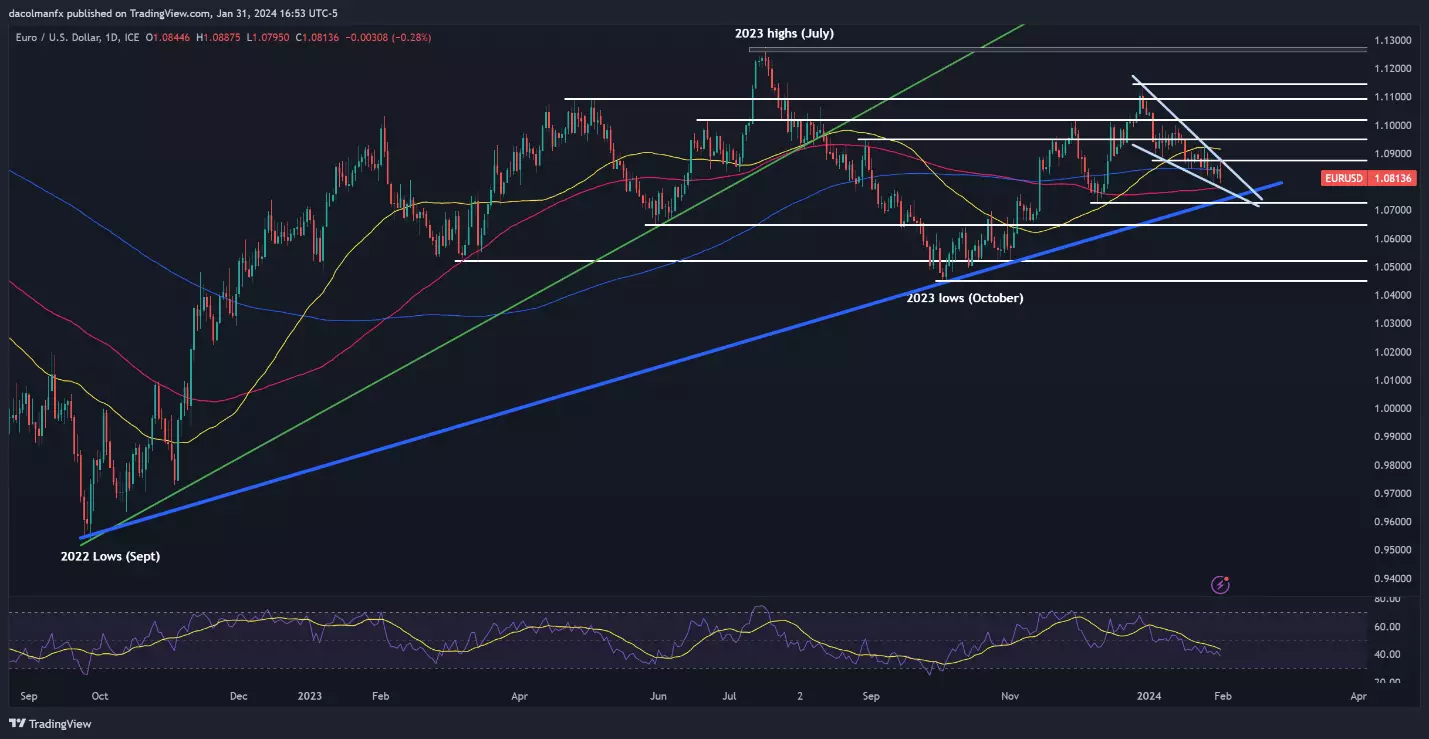
EUR/USD has declined sharply recently, guided lower by the upper boundary of a falling wedge—a bullish pattern. To confirm this technical setup, prices must take out resistance at 1.0870. Such a scenario could usher in a rally toward the 50-day simple moving average at 1.0920, with the next target at 1.0950.
Conversely, if EUR/USD deepens losses, initial support looms at 1.0780, followed by 1.0730, an important floor created by a long-term ascending trendline in play since September 2022. Vigilant defense of this zone by the bulls is imperative; any failure to protect this barrier may trigger a drop toward 1.0650.
EUR/USD daily chart
 Source: TradingView
USD/JPY technical analysis
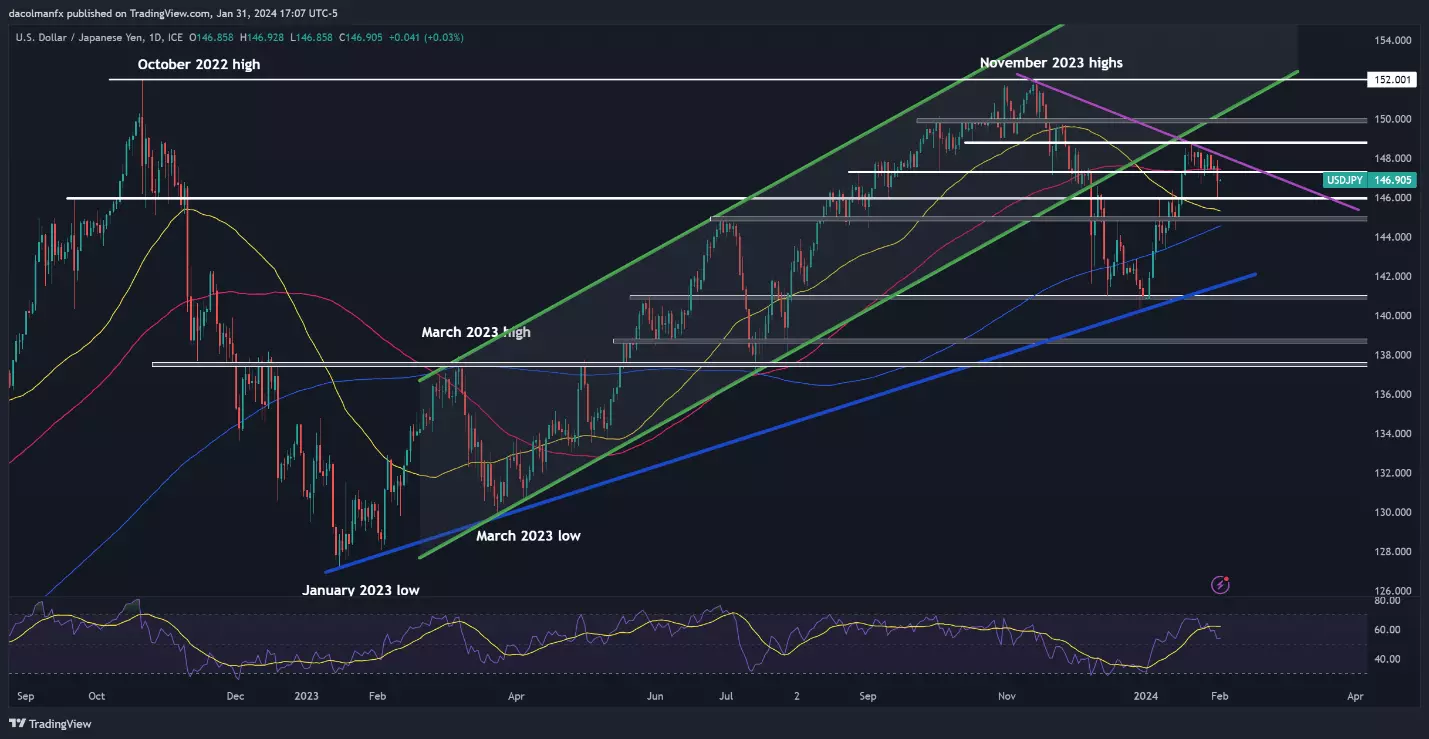
After a positive performance on Tuesday, USD/JPY changed course and slipped beneath the 100-day SMA at 147.40, signaling a bearish shift for the pair. If the retreat continues later this week, support is seen at 146.00. Below that, all eyes will be on the 50-day simple moving average.
On the other hand, if the bulls reemerge and trigger a meaningful rebound, the first technical barrier against further advances is located at 147.40. Beyond that, the next hurdle for the bullish camp will be trendline resistance at 148.00. Further up, the focus will be on 148.80.
USD/JPY daily chart
 Source: TradingView
GBP/USD technical analysis
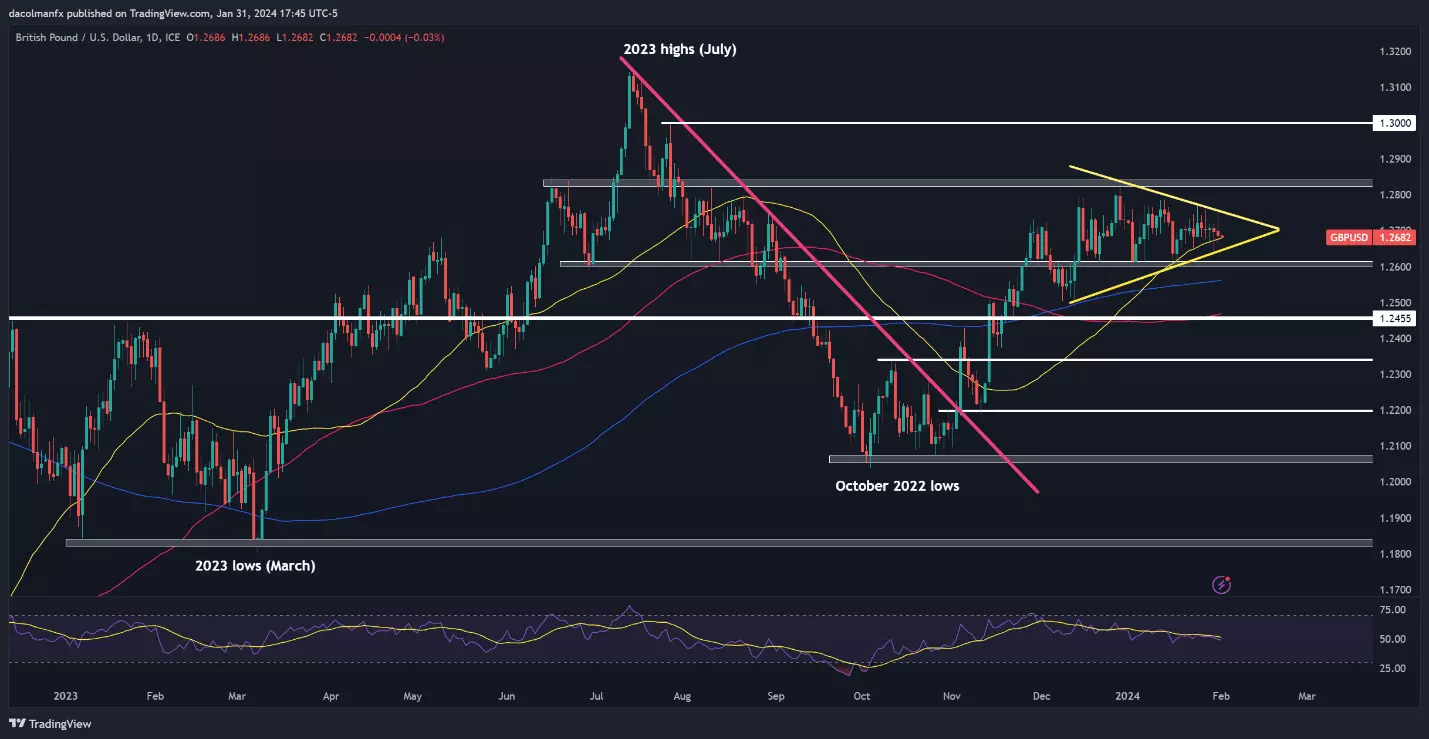
Over the past few weeks, GBP/USD has been consolidating within a symmetrical triangle- a continuation pattern composed of two converging trendlines: an ascending one connecting a sequence of higher highs and a descending one linking a series of lower lows.
The symmetrical triangle is validated once prices of the underlying asset move outside the boundaries of the geometric shape, with the confirmation signal carrying greater strength if the break happens in the direction of the broader trend.
In the case of GBP/USD, traders should watch two areas: resistance at 1.2750 and support at 1.2645. If support gives way, the bearish camp will likely focus on 1.2600, 1.2550 and 1.2455. On the flip side, if resistance is taken out, bulls may set their sights on 1.2830 and possibly even 1.3000.
GBP/USD daily chart
 Source: TradingView
This information has been prepared by IG, a trading name of IG Australia Pty Ltd. In addition to the disclaimer below, the material on this page does not contain a record of our trading prices, or an offer of, or solicitation for, a transaction in any financial instrument. IG accepts no responsibility for any use that may be made of these comments and for any consequences that result. No representation or warranty is given as to the accuracy or completeness of this information. Consequently any person acting on it does so entirely at their own risk. Any research provided does not have regard to the specific investment objectives, financial situation and needs of any specific person who may receive it. It has not been prepared in accordance with legal requirements designed to promote the independence of investment research and as such is considered to be a marketing communication. Although we are not specifically constrained from dealing ahead of our recommendations we do not seek to take advantage of them before they are provided to our clients.
-
Investors are digesting the impact of last night's Fed meeting, which has resulted in expectations of a March rate cut being scaled back. While the FOMC dropped the tightening bias in the statement, it said that cuts would not be appropriate until there was more confidence that inflation was heading back to 2%. However, Powell added that the committee did expect lower rates this year - while a strong labour market would not push back the timing of the first cut, the Fed would cut faster if employment weakened. This makes the next few payrolls readings even more important, and handily there is one tomorrow that could help provide clarity.
It was a more mixed session for Asian markets, with a strengthening yen weighing on the Nikkei 225. Now the Bank of England takes its turn in the spotlight, with the focus on whether any policymakers will agitate for rate cuts. A hold on interest rates is all but a given nonetheless.
-
When shares trade at a record highs stocks are priced for perfection and when perfection doesn’t come it is an opportunity to sell.
Both reported revenue and earnings that beat estimates, but MSFT sold off more than 2% and GOOG shares closed down almost 7%. Advanced Micro Devices (AMD) was another although there was also a poor outlook that accompanied it’s earnings.
(AI Video Summary)
Alphabet
The tech industry had an eventful night with Microsoft and Alphabet, two big companies, making waves with their stocks. Microsoft's shares took a hit during the trading session, but they made a comeback in extended trading, rising overall. Microsoft's earnings and sales were up and down, but they exceeded expectations in terms of earnings per share, reaching a impressive $2.93. One of the reasons for this success was Microsoft's Azure cloud service, which attracted a whopping 53,000 new customers in the past year with the help of AI features. The Intelligent Cloud Unit, where Azure resides, also experienced a solid 20% growth in revenue, reaching a total of $25.9 billion.
Microsoft
Despite Microsoft's recent record-breaking success, investors were still demanding more. They were disappointed by news about the development of AI features, which had an impact on the share prices. However, Microsoft's stock managed to keep its market cap above three trillion, which is an astonishing achievement. On the other hand, Alphabet, the parent company of Google, also disappointed investors with a 7% drop in their shares during extended trading. While the company's earnings per share were slightly higher than expected, and total sales were better than anticipated, they faced tough competition from Microsoft in the AI development field. This led to a significant decrease in Alphabet's stock, the biggest drop seen in several months.
AMD
Another company that faced disappointment was Advanced Micro Devices (AMD). Their shares took a massive nearly 10% hit in extended trading. AMD's earnings per share were slightly higher than forecasted, and their revenue reached a solid $6.2 billion. Their AI processors showed great promise, resulting in an optimistic 2024 forecast. However, these results were not enough to satisfy demanding investors. The stock took a heavy blow during the session, dropping by 10.36% for the current quarter. AMD's projected revenue for the future was also lower than what analysts had predicted, further contributing to the disappointment. Similar to Microsoft and Alphabet, AMD's stock had recently reached record highs but failed to live up to the high expectations set by investors. Overall, it was a night of ups and downs for these tech giants, demonstrating that even companies with impressive track records can face challenges and disappointments in the ever-changing world of trading.
This information has been prepared by IG, a trading name of IG Markets Limited. In addition to the disclaimer below, the material on this page does not contain a record of our trading prices, or an offer of, or solicitation for, a transaction in any financial instrument. IG accepts no responsibility for any use that may be made of these comments and for any consequences that result. No representation or warranty is given as to the accuracy or completeness of this information. Consequently any person acting on it does so entirely at their own risk. Any research provided does not have regard to the specific investment objectives, financial situation and needs of any specific person who may receive it. It has not been prepared in accordance with legal requirements designed to promote the independence of investment research and as such is considered to be a marketing communication. Although we are not specifically constrained from dealing ahead of our recommendations we do not seek to take advantage of them before they are provided to our clients. See full non-independent research disclaimer and quarterly summary.
-
Despite a recently-announced impairment to its profit forecast, Shell is expected to report stronger trading.
 Source: Bloomberg
Shell earnings – what does the City expect?
Shell is set to release its fourth-quarter (Q4) results on February 1. The current estimate for the quarter is a profit of $1.90 per share with revenue of $89 billion.
What about Shell’s recent trading?
Shell has recently announced that its Q4 profits will be impacted by a non-cash impairment charge of $2.5−$4.5 billion.
This charge primarily stems from the Singapore refining and chemicals hub, which Shell intends to sell. The decision to sell its Singapore Chemicals & Products assets, including a refinery and an ethylene plant, is a significant contributor to this impairment charge.
Despite the impairment charge, Shell remains optimistic about its quarterly performance. The integrated gas trading and optimization sector is expected to see a substantial increase from the previous quarter, and the company forecasts a production range of 880,000-920,000 barrels of oil equivalent per day from this unit.
In the upstream business, Shell expects production in the range of 1.83-1.93 million barrels of oil equivalent per day for the Q4. These forecasts indicate a resilient operational performance.
Analyst ratings for Shell
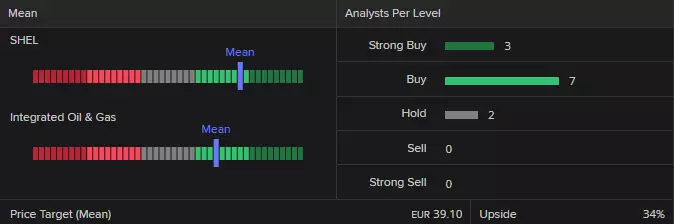
Refinitiv data shows a consensus analyst rating of ‘buy’ for Shell with 3 strong buy, 7 buy and 2 hold – and a mean of estimates suggesting a long-term price target of €39.10 for the share, roughly 34% higher than the current price (as of 30 January 2024).
 Source: Refinitiv
Technical outlook on the Shell share price
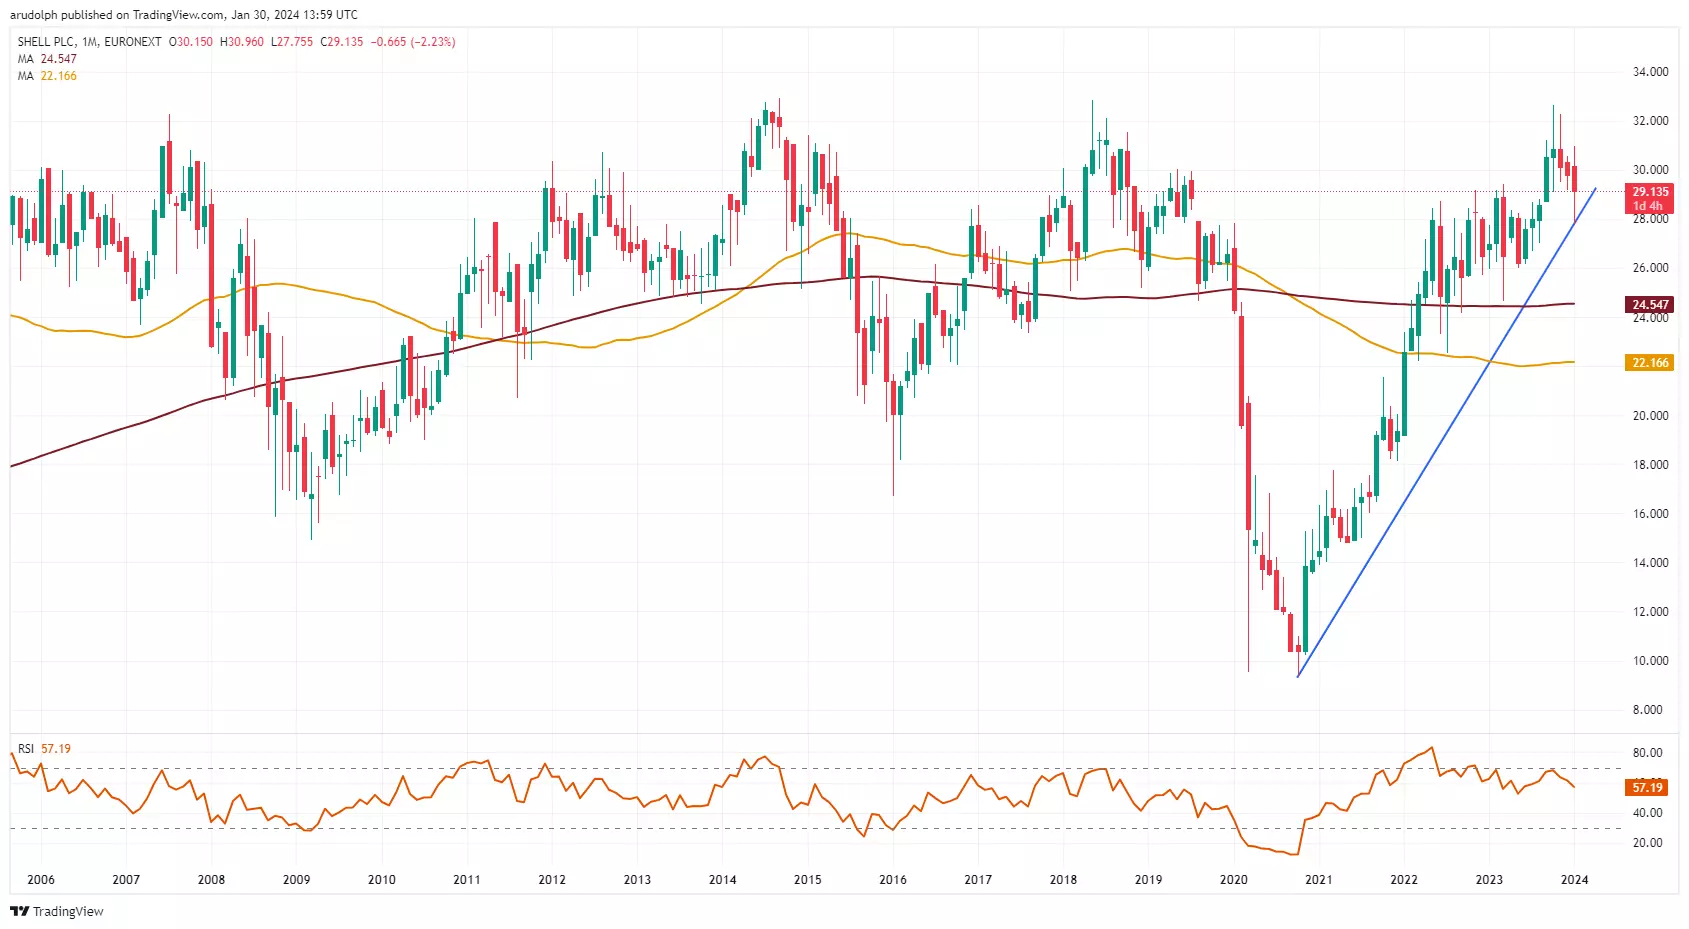
Shell’s share price, which has fallen by around 3% since the beginning of the year, and by around 14% from its October 2023 €32.64 peak, is seen stabilizing.
Shell Monthly Candlestick Chart
 Source: TradingView
The Shell share price topped out in October of last year in a similar area to where it did so in September 2014 and May 2018 with the whole €32.64 to €32.945 representing a major resistance zone.
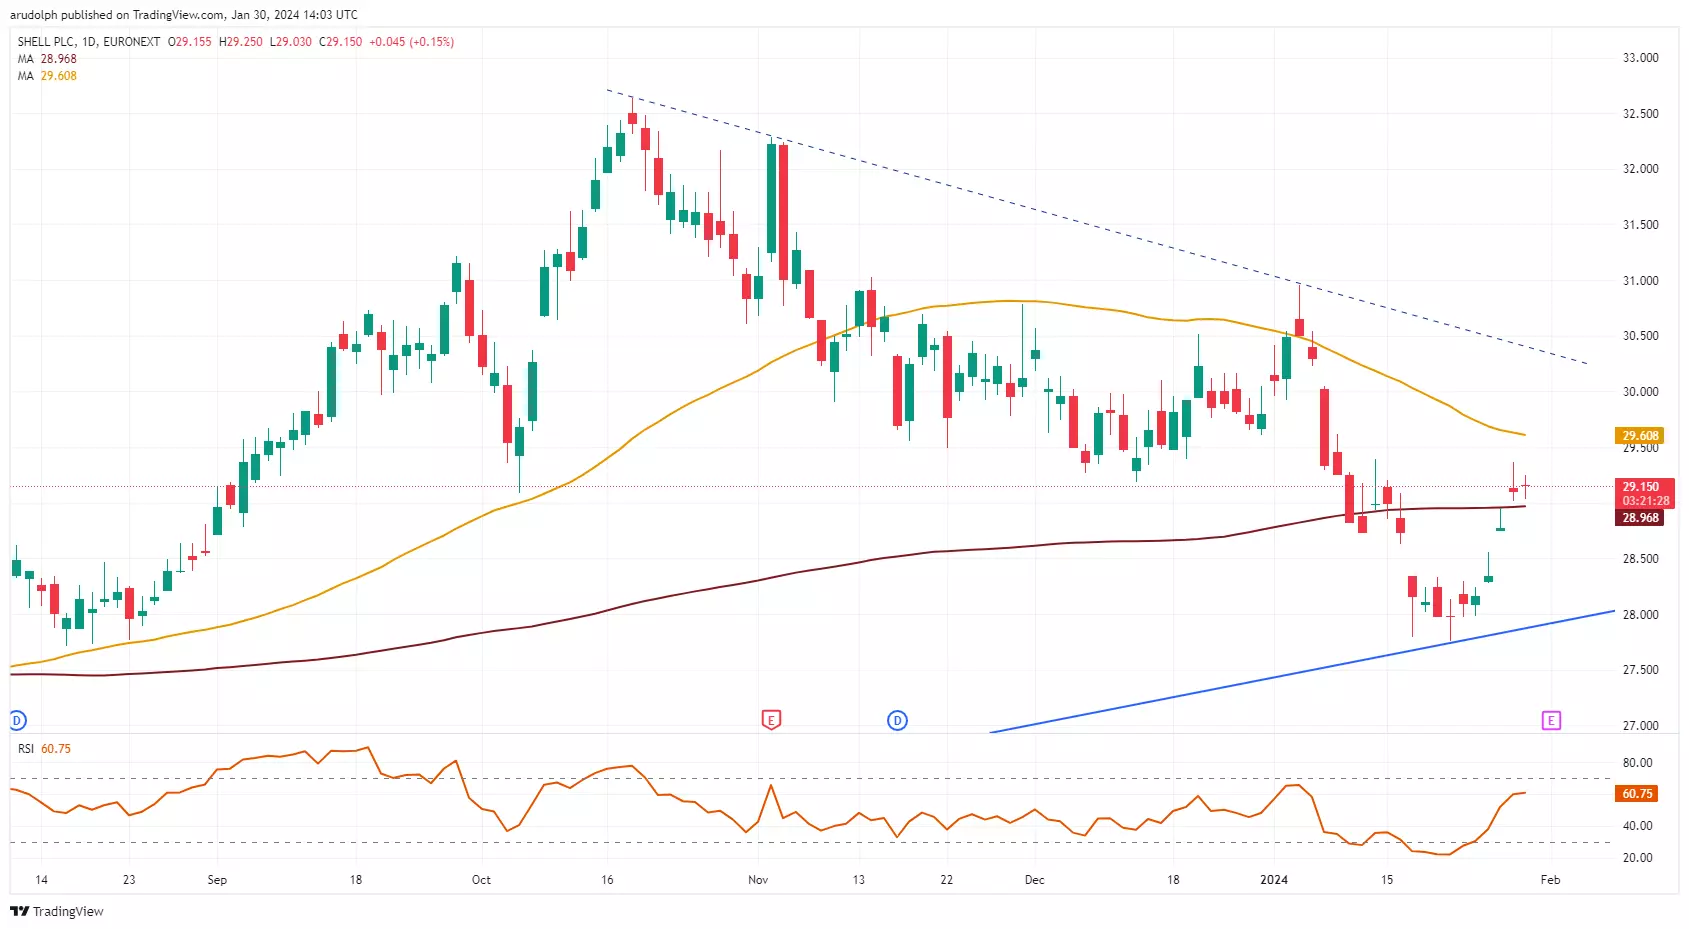
The 5% recovery in the Shell share price from its €27.755 current January low has taken it back above the 200-day simple moving average (SMA) at €28.97 with the October and December lows at €29.090 to €29.185 acting as minor resistance.
Shell Daily Candlestick Chart
 Source: TradingView
If overcome, the 55-day SMA at €29.608 should be in play but only a much further advance to above the €30.96 early-January high would negative the last three months’ bearish play. Only then could the major €32.64 to €32.945 resistance zone be back on the cards.
Good support below the 200-day SMA at €28.967 can be found between the mid-August to current January lows at €27.755 to €27.71.
This information has been prepared by IG, a trading name of IG Markets Limited. In addition to the disclaimer below, the material on this page does not contain a record of our trading prices, or an offer of, or solicitation for, a transaction in any financial instrument. IG accepts no responsibility for any use that may be made of these comments and for any consequences that result. No representation or warranty is given as to the accuracy or completeness of this information. Consequently any person acting on it does so entirely at their own risk. Any research provided does not have regard to the specific investment objectives, financial situation and needs of any specific person who may receive it. It has not been prepared in accordance with legal requirements designed to promote the independence of investment research and as such is considered to be a marketing communication. Although we are not specifically constrained from dealing ahead of our recommendations we do not seek to take advantage of them before they are provided to our clients. See full non-independent research disclaimer and quarterly summary.
-
IMF's global growth upgrade fuels 'soft landing' optimism, slightly lifting oil and gold post-release. AUD/USD remains uncertain. Key risk events loom: BoE and Fed decisions, major earnings, and NFP report.
 Source: Bloomberg
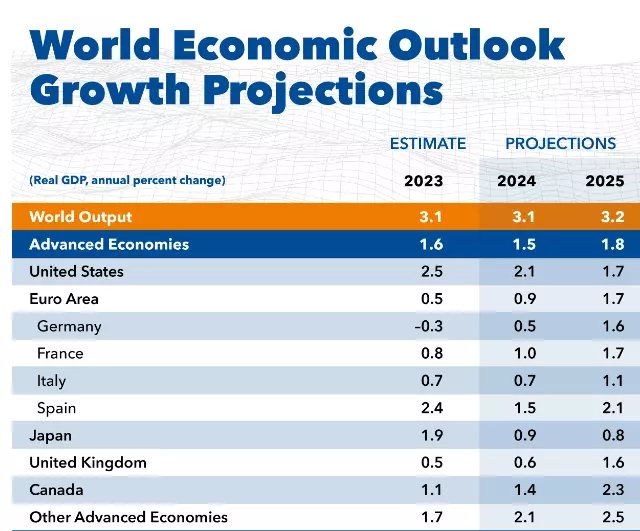
IMF upgrades global growth as ‘soft landing’ hopes gain traction
The International Monetary Fund (IMF) upgraded its outlook on global economic growth, as major economies reveal their resilience. Disinflation also continues to push prices lower, supporting a potential soft landing in 2024. However, there is acknowledgement that risks related to geopolitical conflicts, could affect global trade. In addition, the IMF also highlighted the potential for stubborn price pressures if reducing interest rates loosens financial conditions too much.
The IMF provided an update on its global growth forecast, seeing the 2024 estimate rise from 2.9% back in October, to 3.1%. The organisation foresaw greater than expected resilience in the US, seeing its estimate for growth in 2024 rise from 1.5% to 2.1% for 2024. The organisation also acknowledged China’s fiscal efforts to jump start the local economy, seeing estimated growth rise from 4.2% to 4.6% this year.
IMF upgrades its global economic outlook
 Source: IMF World Economic Outlook
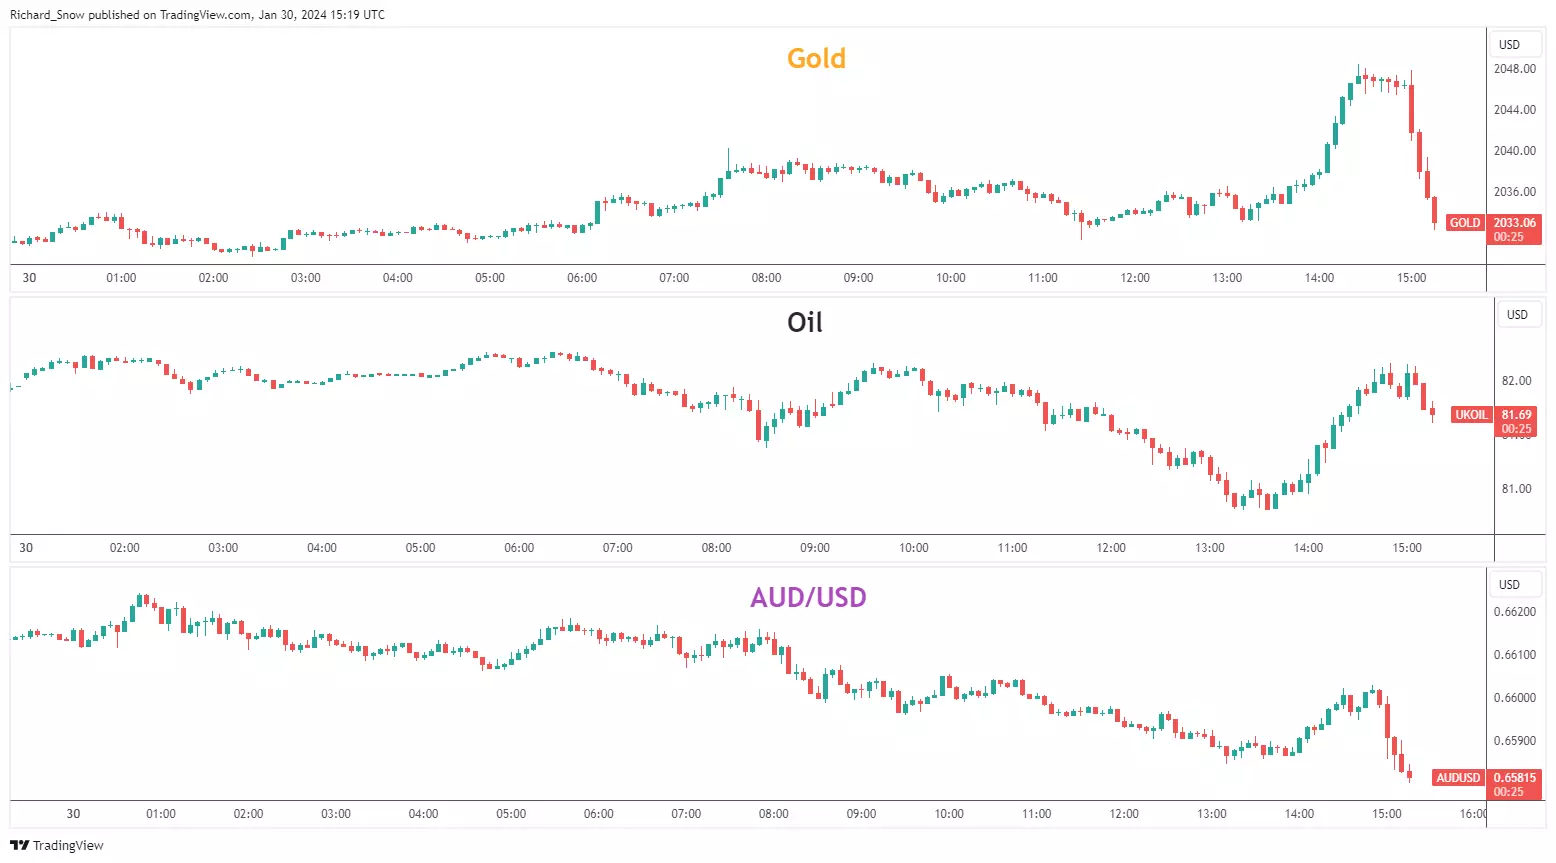
Markets have responded positively as gold and oil both moved higher in the wake of the update, although, gold has since reverted back to prices observed before the report was released. Oil received a boost, and remains a market filled with complexity amid supply chain uncertainty along the Red Sea and a rosier global economic outlook. API data later today, EIA storage figures and the NFP print on Friday provides oil traders with lots to think about this week.
AUD/USD, the last chart shown below, is generally reflective of risk sentiment and hadn’t really seen a long-lasting advance in the minutes after the IMF’s update. The aussie dollar is procyclical in nature which means it exhibits a strong correlation with the S&P 500, although this has weakened recently and may be something to keep an eye on if aussie/China fortunes deteriorate in relation to the US.
Multi-asset performance in the moments following the IMF’s global growth upgrade
 Source: TradingView
This information has been prepared by IG, a trading name of IG Australia Pty Ltd. In addition to the disclaimer below, the material on this page does not contain a record of our trading prices, or an offer of, or solicitation for, a transaction in any financial instrument. IG accepts no responsibility for any use that may be made of these comments and for any consequences that result. No representation or warranty is given as to the accuracy or completeness of this information. Consequently any person acting on it does so entirely at their own risk. Any research provided does not have regard to the specific investment objectives, financial situation and needs of any specific person who may receive it. It has not been prepared in accordance with legal requirements designed to promote the independence of investment research and as such is considered to be a marketing communication. Although we are not specifically constrained from dealing ahead of our recommendations we do not seek to take advantage of them before they are provided to our clients.
-
While both Alphabet and Microsoft beat expectations last night, both saw their stock prices fall as concerns around the rising cost of massive AI investments weighed on investors' minds. Overnight in Asia the yen firmed up against the dollar after Bank of Japan meetings that showed policy normalisation was getting closer, and that some policymakers were now moving to favour a rate hike this year, Japan's first since 2007.
Chinese manufacturing data showed a contraction for the fourth consecutive month, and Chinese indices fell once again. German GDP and inflation data dominate the morning and early afternoon, but are swiftly followed up by the ADP report, then EIA crude oil inventories and then the Fed decision tonight.
Powell and co are expected to leave rates unchanged, but all eyes are on the statement and press conference for hints about the first rate cut. The chances of a March cut have dropped to 44%, according to CME Fed Watch, from the 70% seen at the start of the year. Markets are also on watch for any US response to the deaths of three soldiers at the weekend. US president Biden said that he had decided on action, but that he also wished to avoid a wider war in the Middle East.
-
ECB's dovish shift propels DAX to highs; BoE's potential pivot may impact FTSE's eight-month range. Caution advised.
 Source: Bloomberg
Last week’s ECB meeting was more dovish than expected. While the ECB kept its deposit rate on hold at 4% and reiterated that it was premature to talk about rate cuts, president Lagarde’s comments were dovish relative to the December meeting and her recent comments in Davos.
Spurred by gains on Wall Street and the European rates market pulling forward the pricing of a first ECB 25bp rate cut to April, and a chunky total of 140bp of rate cuts in 2024, the German stock market, the DAX, has since launched an assault on its January high.
This week, the Bank of England (BoE) takes its turn to step up to the plate. The BoE will likely keep rates on hold at 5.25% and deliver a dovish pivot by removing its tightening bias and downgrading inflation expectations.
The UK rates market has a first BoE 25bp rate cut priced for June and a total of 100bp of rate cuts priced for 2024. Confirmation of a dovish BoE pivot could be the catalyst that the FTSE has been waiting for to breakout from a stale eight-month range.
BoE official bank rate
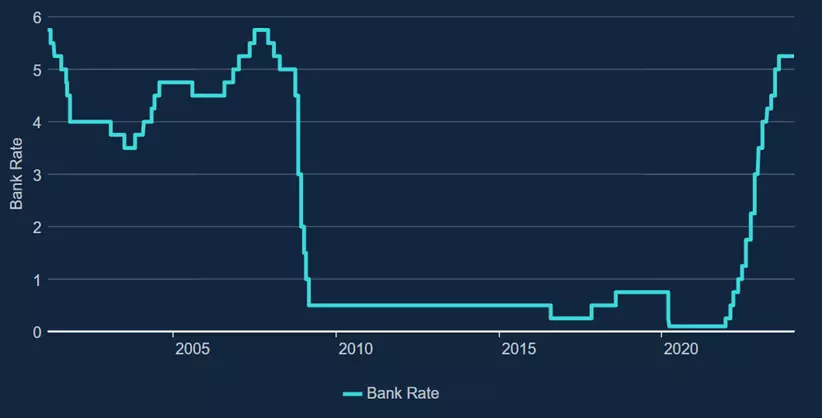 Source: BoE
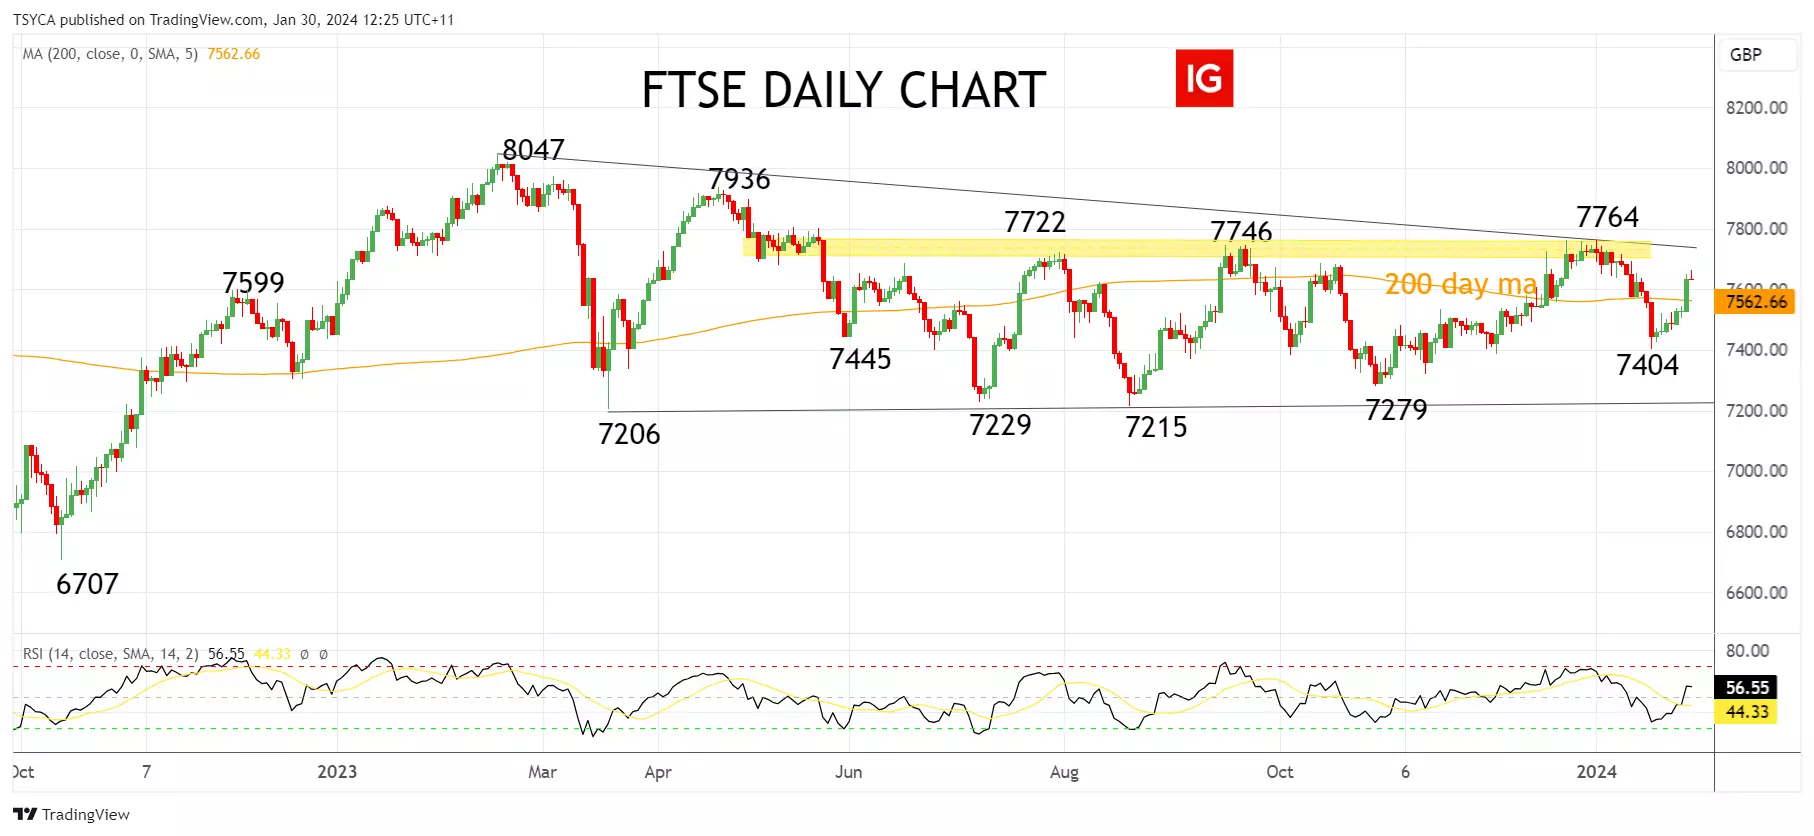
FTSE technical analysis
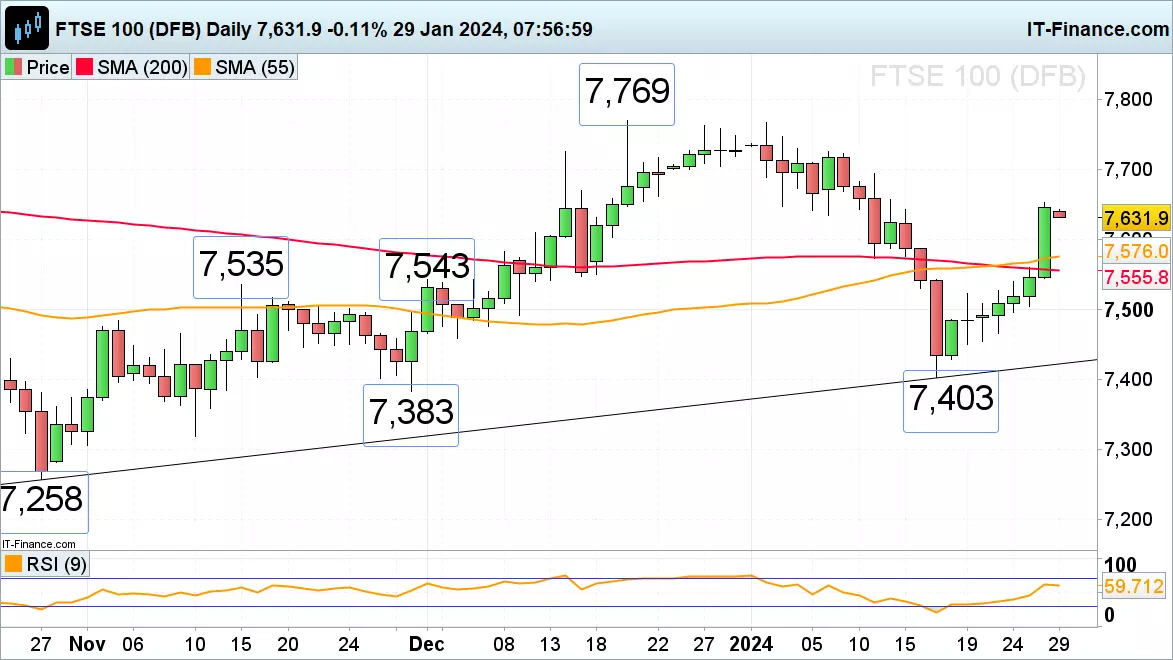
For the past eight months, the FTSE has been encapsulated below horizontal resistance at 7750ish and above support at 7200.
The ability of the FTSE to close above the 200-day moving average into the end of last provides the foundation for the FTSE to set up another test of the horizontal resistance at 7750, that is also being reinforced by downtrend resistance coming from the 2023 high of 8047.
If the FTSE can see a sustained break above 7750ish, it would warrant moving from a neutral bias to a bullish bias, looking for a test of the April 7936 high, with scope to the 8047 high. Aware that while the FTSE remains below resistance at 7750ish, more range trading is likely.
FTSE daily chart
 Source: TradingView
DAX technical analysis
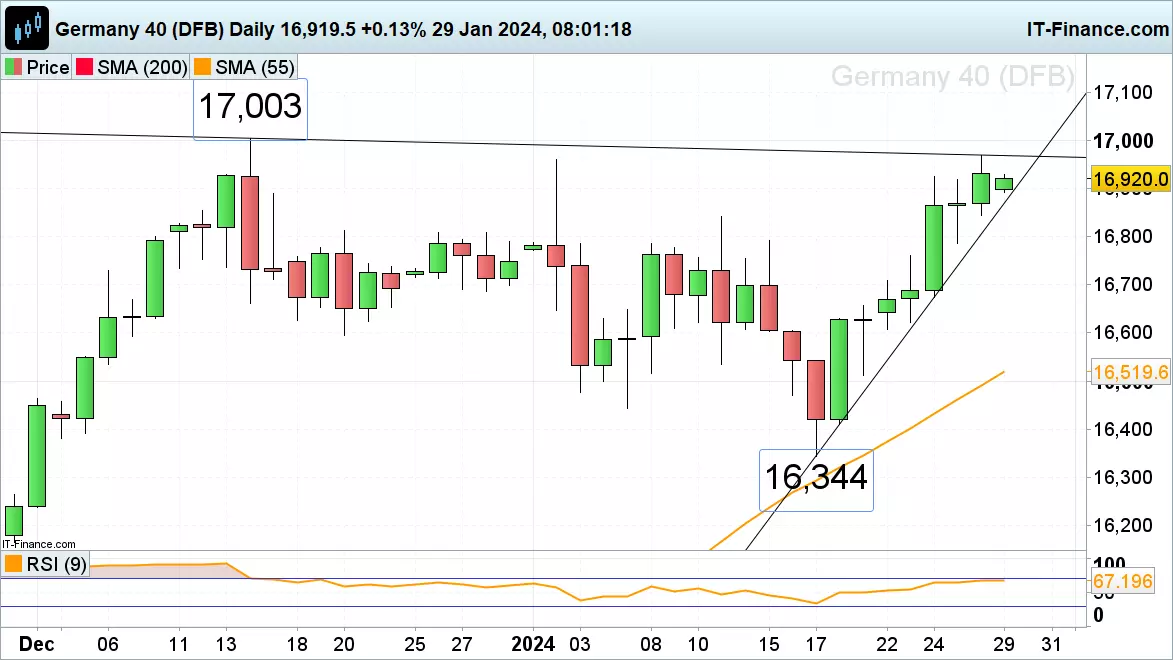
In our last update, it was noted that given the nature of the three-wave nature decline from the 17,123 high to the recent 16,464 low, it was likely a correction, and that the DAX should push to new highs in the 17,200/400 area.
With the DAX just a stone’s throw from a fresh record high, this remains our view. However, we would be careful about chasing the market to new highs as we think that a pullback in the magnitude of 5-10% is not too far away.
DAX daily chart
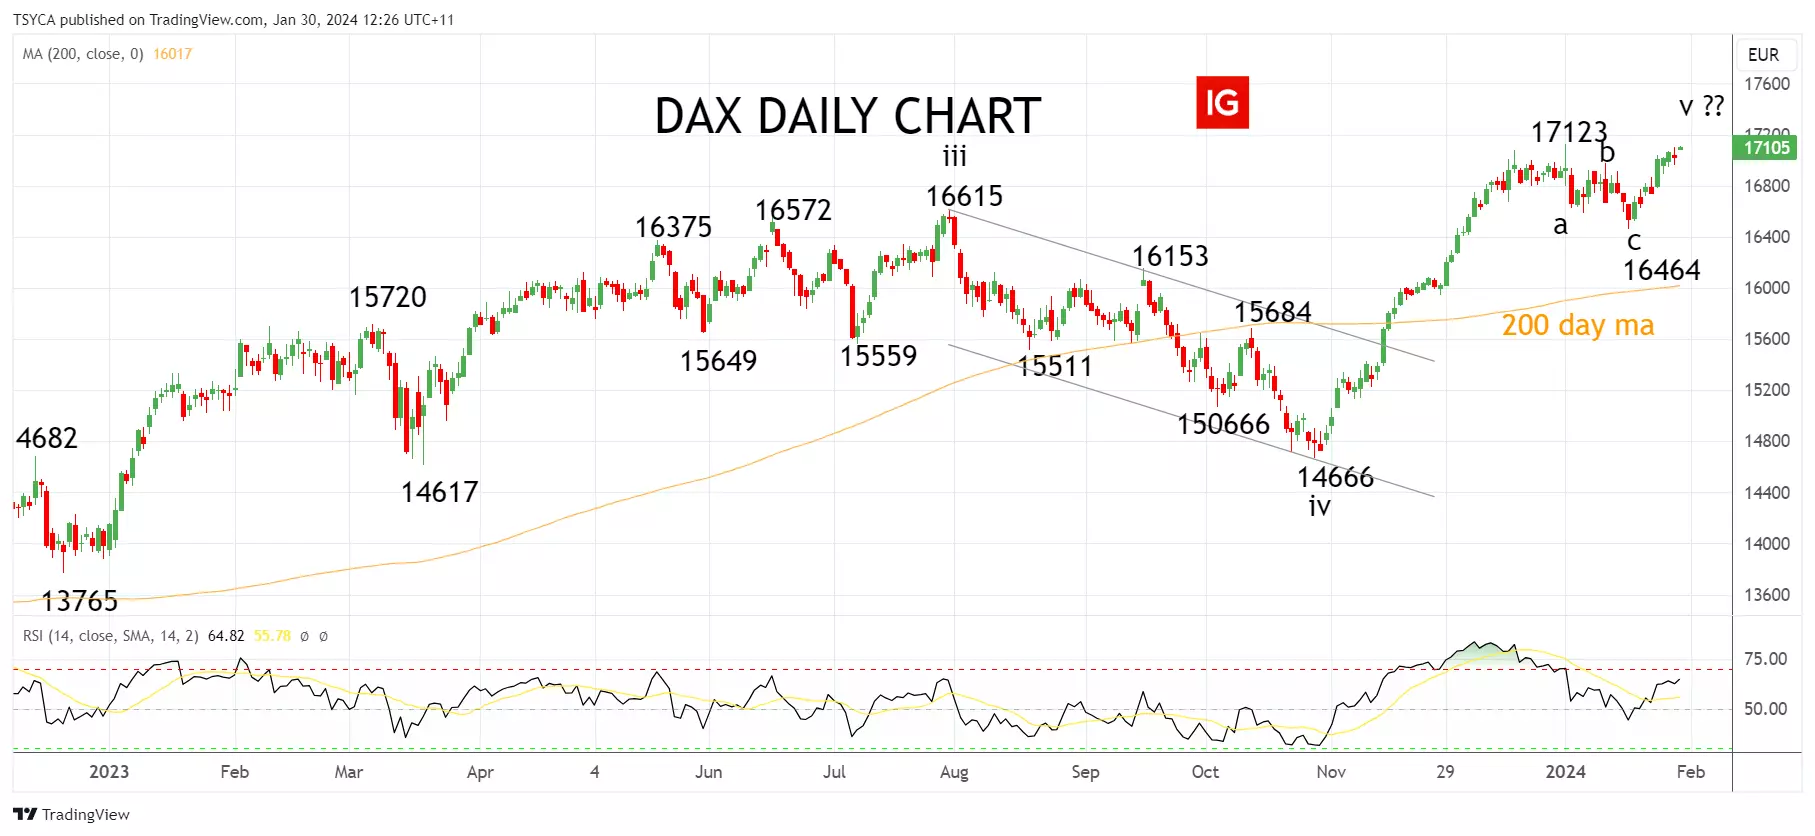 Source: TradingView
- Source: TradingView. The figures stated are as of 30 January 2024. Past performance is not a reliable indicator of future performance. This report does not contain and is not to be taken as containing any financial product advice or financial product recommendation.
This information has been prepared by IG, a trading name of IG Australia Pty Ltd. In addition to the disclaimer below, the material on this page does not contain a record of our trading prices, or an offer of, or solicitation for, a transaction in any financial instrument. IG accepts no responsibility for any use that may be made of these comments and for any consequences that result. No representation or warranty is given as to the accuracy or completeness of this information. Consequently any person acting on it does so entirely at their own risk. Any research provided does not have regard to the specific investment objectives, financial situation and needs of any specific person who may receive it. It has not been prepared in accordance with legal requirements designed to promote the independence of investment research and as such is considered to be a marketing communication. Although we are not specifically constrained from dealing ahead of our recommendations we do not seek to take advantage of them before they are provided to our clients.
-
Explore the latest fluctuations in crude oil prices as geopolitical tensions and economic stimuli influence market trends. Delve into how recent events and future economic indicators are impacting oil prices.
 Source: Bloomberg
IG Analyst | Publication date:
Source: Bloomberg
IG Analyst | Publication date:Crude oil prices retreat after recent gains
Crude oil prices retreated a little on Monday after a string of gains last week took them back to highs not seen for twelve weeks. The West Texas Intermediate benchmark has edged back above $78 per barrel for the first time since 30 November.
While a little pause for reflection is surely reasonable enough after a strong run, the near-term fundamentals continue to look very supportive. United States President Joe Biden has vowed a response to weekend attacks by reportedly Iranian-backed militia in Yemen which left three troops dead. Congressional hawks are already calling for a strike on Iran itself in retaliation and, whether this happens or not, it seems escalation in the Gaza/Red Sea conflict nexus is sadly assured.
Away from that region, the market is looking for more stimulus out of Beijing and, on Wednesday, confirmation that the US Federal Reserve is still on board with market hopes that interest rates will be heading significantly lower this year. While there’s scope for disappointment on both counts, oil prices have found support in both hopes. Throw in last week’s news that the US economy expanded ahead of expectations in the final three months of 2023, and it is clear enough why oil prices should be gaining.
Market outlook amidst uncertain demand and supply
The backdrop is, however, a little more clouded than the current upbeat assessment might suggest. Notwithstanding those stimulus efforts and others, the market faces plentiful oil supply and decidedly uncertain end-user demand. However, this reality seems unlikely to reassert itself while Middle Eastern geopolitics remains in charge of the headlines.
In terms of scheduled data, the Federal Reserve will be running the table for energy markets this week, as for all others. There are some other points of interest though, including Eurozone growth data and the Bank of England’s interest rate decision.
Technical analysis
Prices appear to have faltered at a point that confirms a broad uptrend channel in place since 13 December. The rejection of that channel top at $79.07 isn’t quite conclusive at this point but still bears watching. Support is likely at $76.79, the first Fibonacci retracement of the rise from those mid-December lows.
Bulls will need to recapture a trading band bounded by 1 November’s intraday low of $80.23 and 3 November’s high of $83.55, and consolidate their position there if they are going to make progress back to last year’s high of $94.98. Retaking that would be a massive ask even given current fundamental support. In any case, a period of consolidation looks likely now, albeit within the broader uptrend, which remains in place down to $73.
Crude’s Relative Strength Index is getting close to overbought territory, having risen steadily into 2024.
WTI crude oil daily chart
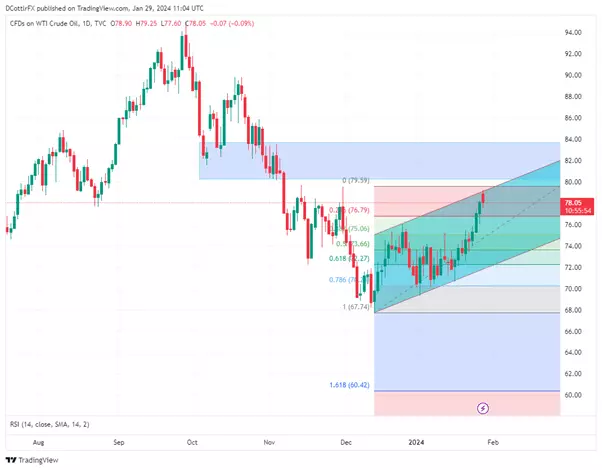 Source: TradingView
This information has been prepared by IG, a trading name of IG Australia Pty Ltd. In addition to the disclaimer below, the material on this page does not contain a record of our trading prices, or an offer of, or solicitation for, a transaction in any financial instrument. IG accepts no responsibility for any use that may be made of these comments and for any consequences that result. No representation or warranty is given as to the accuracy or completeness of this information. Consequently any person acting on it does so entirely at their own risk. Any research provided does not have regard to the specific investment objectives, financial situation and needs of any specific person who may receive it. It has not been prepared in accordance with legal requirements designed to promote the independence of investment research and as such is considered to be a marketing communication. Although we are not specifically constrained from dealing ahead of our recommendations we do not seek to take advantage of them before they are provided to our clients.
-
The Bank of England is not expected to loosen policy at this week’s meeting, but current market pricing points towards the possibility of rate cuts in 2024.
 Source: Bloomberg
Threadneedle Street to leave rates unchanged
The Bank of England (BoE), under the scrutiny of investors and market analysts, is expected to maintain its current interest rate position on 1 February.
This anticipation comes at a time when the central bank has consistently maintained a firm stance against any discussions of rate cuts. The Monetary Policy Committee (MPC), the decision-making body within the BoE, has been closely monitored for any shifts in its messaging that could indicate a change in monetary policy direction.
Markets pricing in 2024 cuts
Despite the BoE's tough stance, the markets are currently pricing in four rate cuts in 2024. This forward-looking sentiment suggests that traders and investors are betting on a softer monetary policy approach in the near future.
The rationale behind this expectation is rooted in the recent economic indicators showing a slowdown in inflation and wage growth. These factors are key considerations for the BoE when determining the appropriate interest rate level to achieve its primary goal of maintaining price stability and supporting economic growth.
Housebuilders to benefit from rate cuts?
For traders, the current economic climate presents a unique set of opportunities and challenges. On one hand, the prospect of future rate cuts could stimulate the economy and potentially boost stock prices. Companies in sectors such as housebuilders, which often benefit from lower borrowing costs, could see their stocks rise in anticipation of a more dovish monetary policy. For example, a company like Persimmon, a major UK homebuilder, might see increased investor interest as lower rates could lead to more affordable mortgage financing for homebuyers.
On the other hand, the uncertainty surrounding the timing and extent of any potential rate changes requires traders to be vigilant and adaptable. Fixed-income securities, such as government bonds, are particularly sensitive to interest rate fluctuations. A surprise rate cut or a delay in expected cuts could lead to significant price movements in bond markets, impacting the portfolios of traders who are exposed to these assets.
Technical analysis – GBP/USD
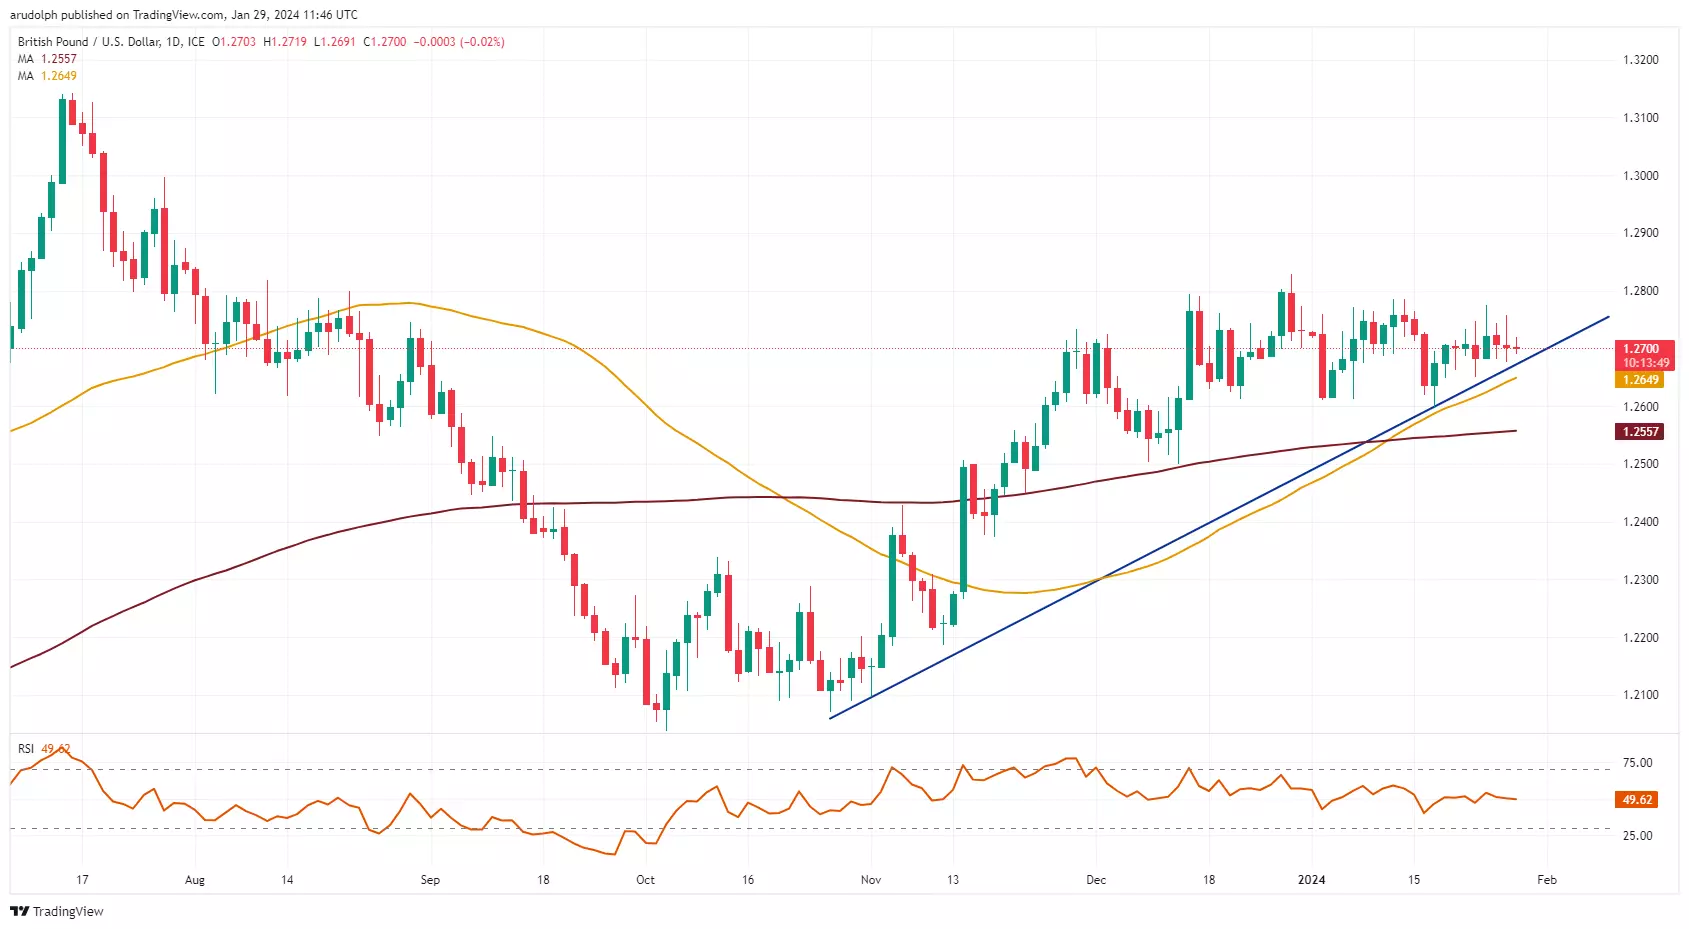
GBP/USD continues to trade sideways below last week’s high at $1.2775 while remaining above Friday’s $1.2676 low. Below it meanders the 55-day simple moving average (SMA) at $1.2649. Further down lies the more significant $1.2613 to $1.2597 area which consists of the late-December to January lows.
A rise above Friday’s high at $1.2758 is needed for last week’s peak at $1.2775 to be revisited. Above it lies significant resistance between the mid-December-to-January highs at $1.2794 to $1.2828.
GBP/USD chart
 Source: TradingView
Technical analysis – EUR/GBP
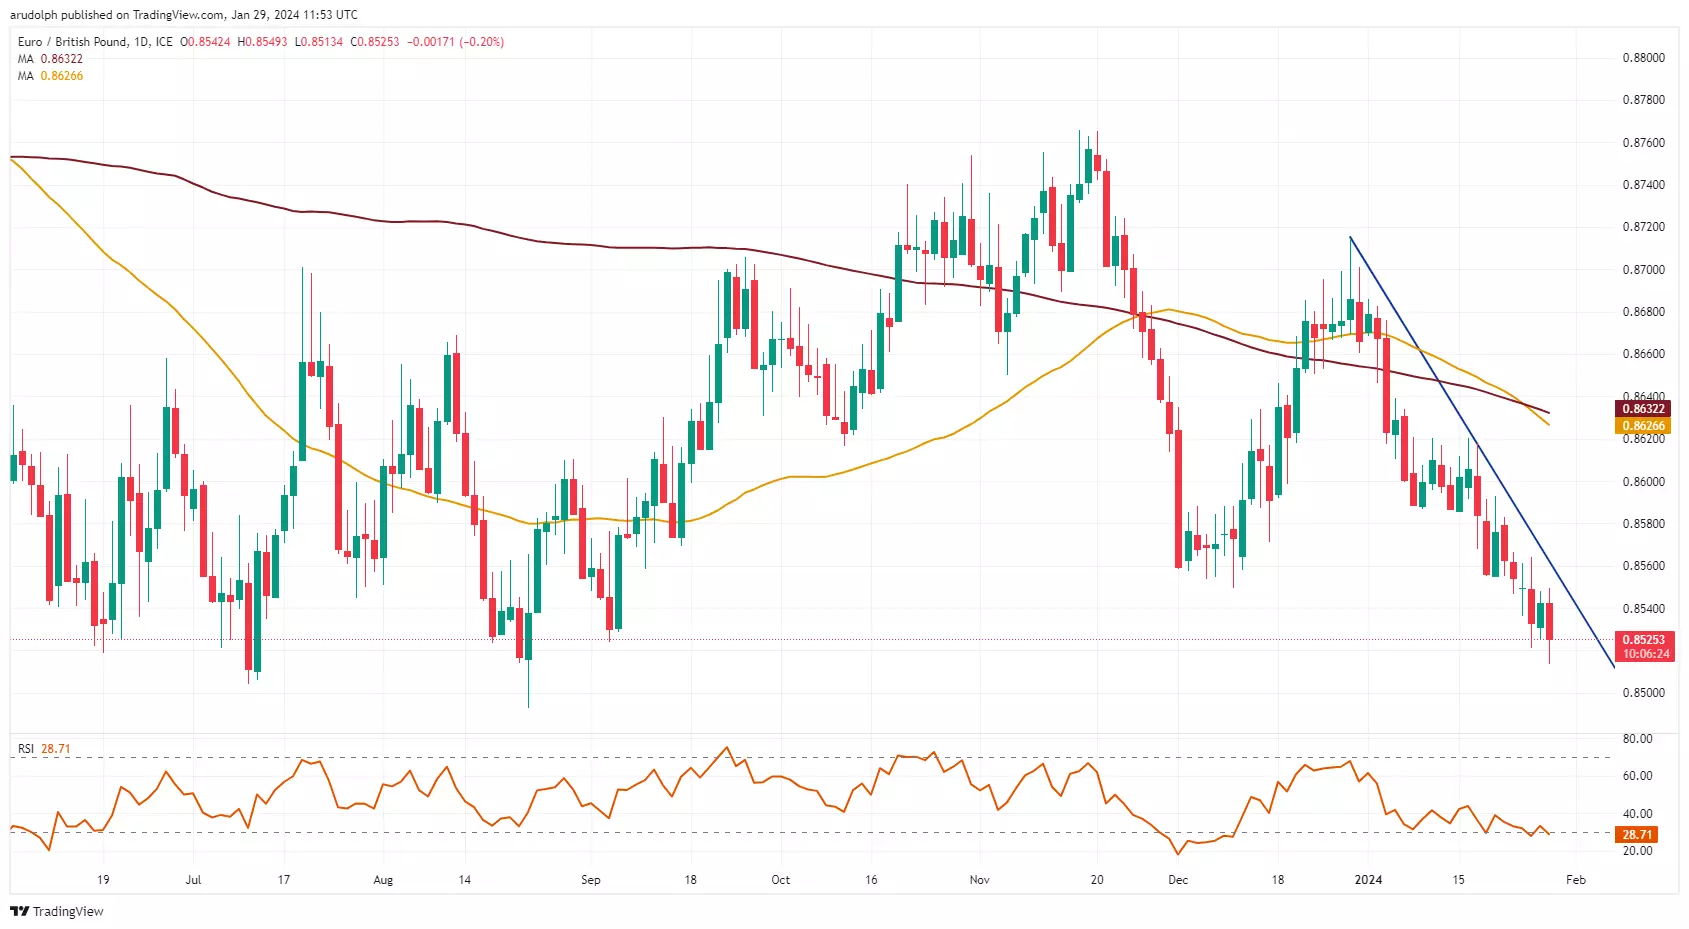
EUR/GBP’s decline from its £0.8714 December high has taken it to today’s £0.8514 five-month low which lies within the significant June-to-August support zone at £0.8519 to £0.8493. This area is likely to hold but if not, the April 2021 low at £0.8472 would be next in line.
Resistance above Monday's £0.8549 high, which coincides with the December low, can be seen along the December-to-January downtrend line at £0.8562. Whilst it caps, further downside is expected to be seen.
EUR/GBP chart
 Source: TradingView
This information has been prepared by IG, a trading name of IG Markets Limited. In addition to the disclaimer below, the material on this page does not contain a record of our trading prices, or an offer of, or solicitation for, a transaction in any financial instrument. IG accepts no responsibility for any use that may be made of these comments and for any consequences that result. No representation or warranty is given as to the accuracy or completeness of this information. Consequently any person acting on it does so entirely at their own risk. Any research provided does not have regard to the specific investment objectives, financial situation and needs of any specific person who may receive it. It has not been prepared in accordance with legal requirements designed to promote the independence of investment research and as such is considered to be a marketing communication. Although we are not specifically constrained from dealing ahead of our recommendations we do not seek to take advantage of them before they are provided to our clients. See full non-independent research disclaimer and quarterly summary.
-
Oil price slides on demand concerns while corn and wheat prices also drop
Outlook on WTI, corn and wheat ahead of Wednesday’s US FOMC meeting.
 Source: Bloomberg
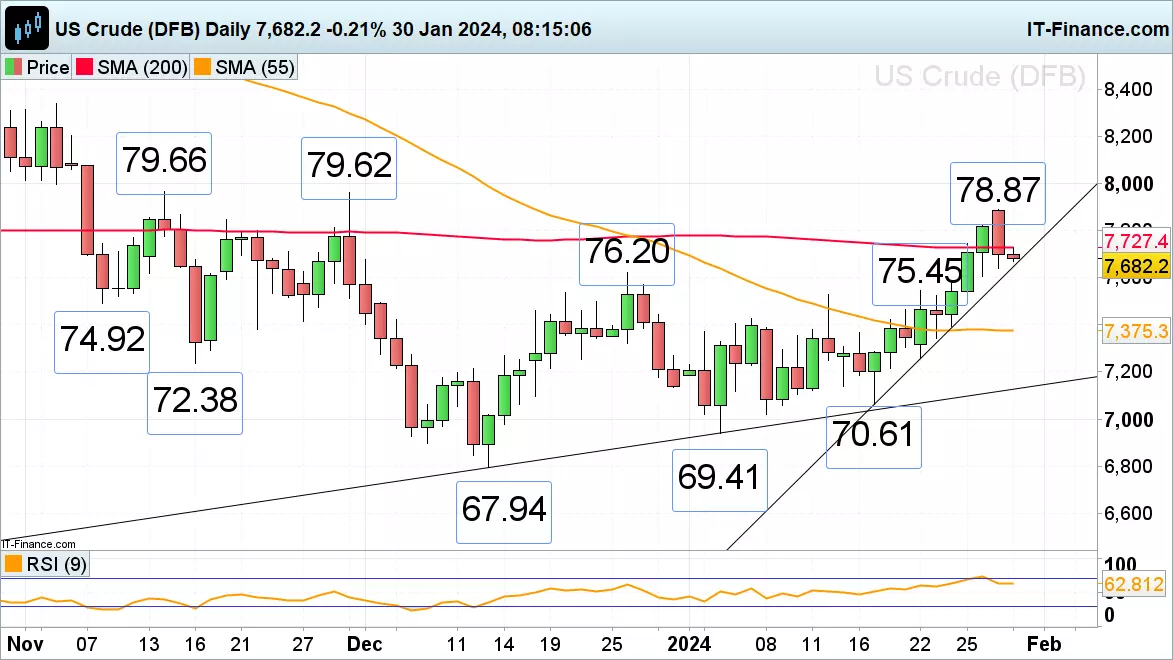
WTI slips on demand concerns
Front month WTI futures swiftly reversed their early Monday morning gains to 78.87 following a deadly drone attack on a US military base in Jordan by Iran-backed militia as China demand concerns outweighed the fear of an escalation in the Middle East. The fall through the 200-day simple moving average (SMA) at 77.27 puts the one-month uptrend line at 76.48 and also the late December high at 76.20 on the map. If slipped through, the 12 and 22 January highs at 75.45 to 75.27 would be eyed next. Minor resistance above the 200-day SMA at 77.27 sits at Friday’s 78.22 high ahead of Monday’s 78.87 near two-month peak.
 Source: ProRealTime
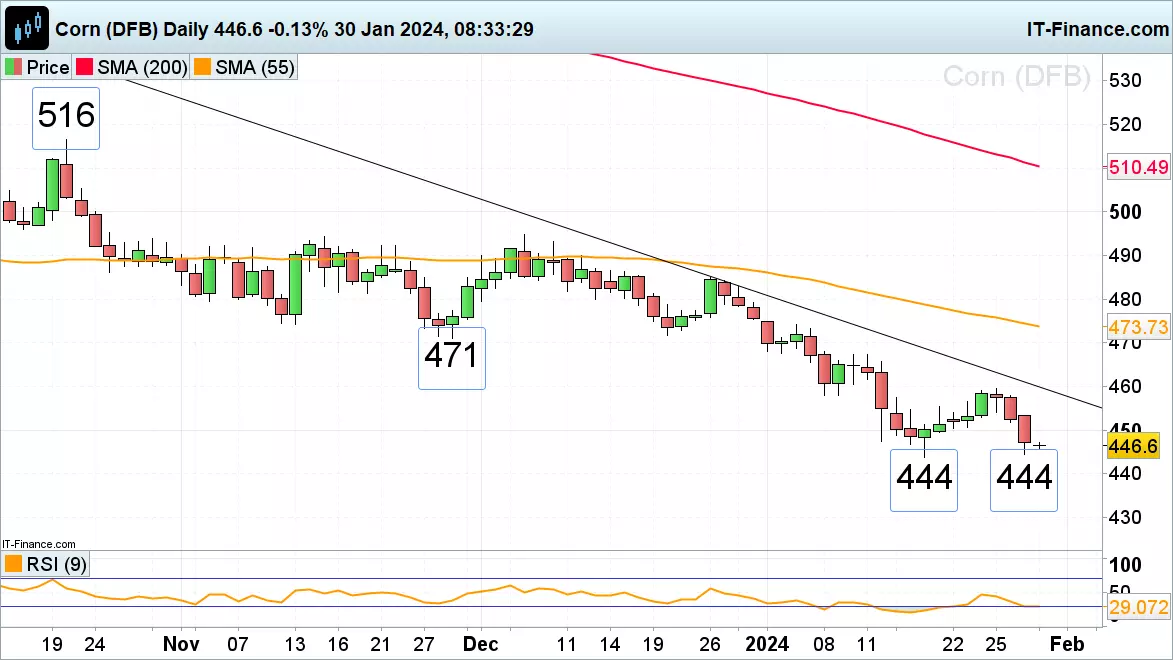
Corn price slips to mid-January low
Front month corn futures trade back in three-year lows and have so far fallen to 455, to their mid-January low which was made below the 460.1 July 2019 high, with the November 2020 high at 438 representing the next downside target. Minor resistance sits at the 451.8 low seen on Friday followed by the 22 January high and Thursday’s low at 454.0 to 454.1. More significant resistance lies at last week’s 459.5 peak.
 Source: ProRealTime
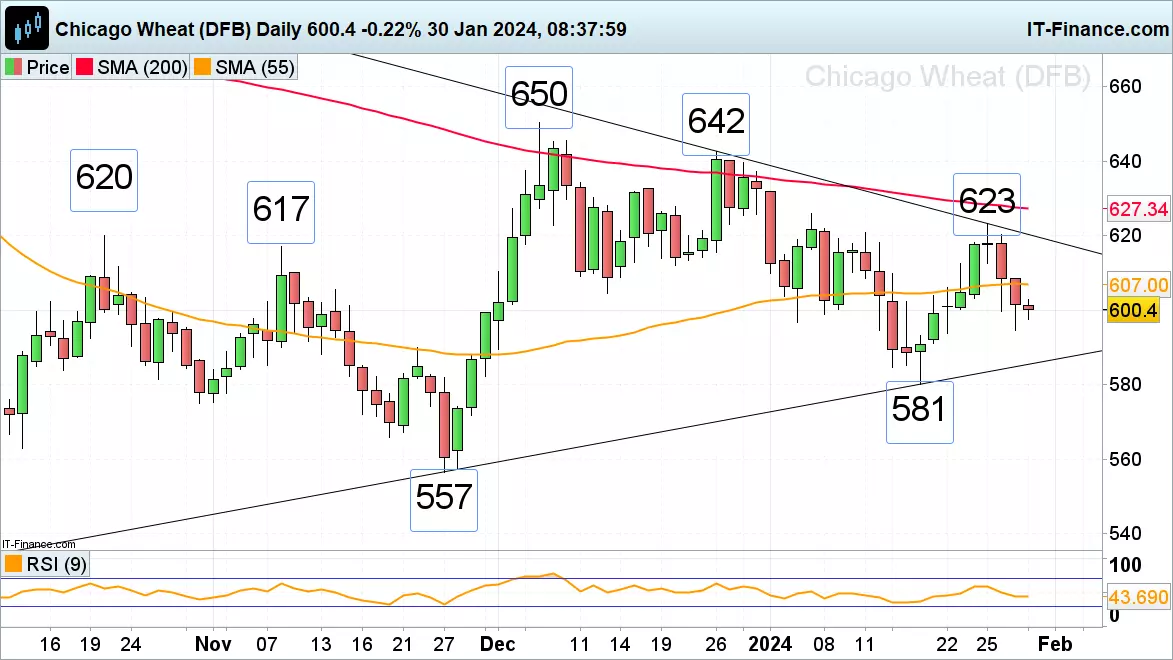
Chicago Wheat prices resume their descent
Chicago wheat front month futures prices have resumed their descent and are seen sliding back towards their November-to-January uptrend line at 585.5 which lies above the mid-January low at 581. Minor resistance can be spotted along the 55-day simple moving average (SMA) at 607. While last week’s high at 623 isn’t overcome, the medium-term trend remains bearish.
 Source: ProRealTime
-
Dow, Nasdaq 100 and Nikkei 225 resume their march higher
Indices have made gains once more, though US indices face a major test with big tech earnings, a Fed decision and payrolls data all happening this week.
 Source: Bloomberg
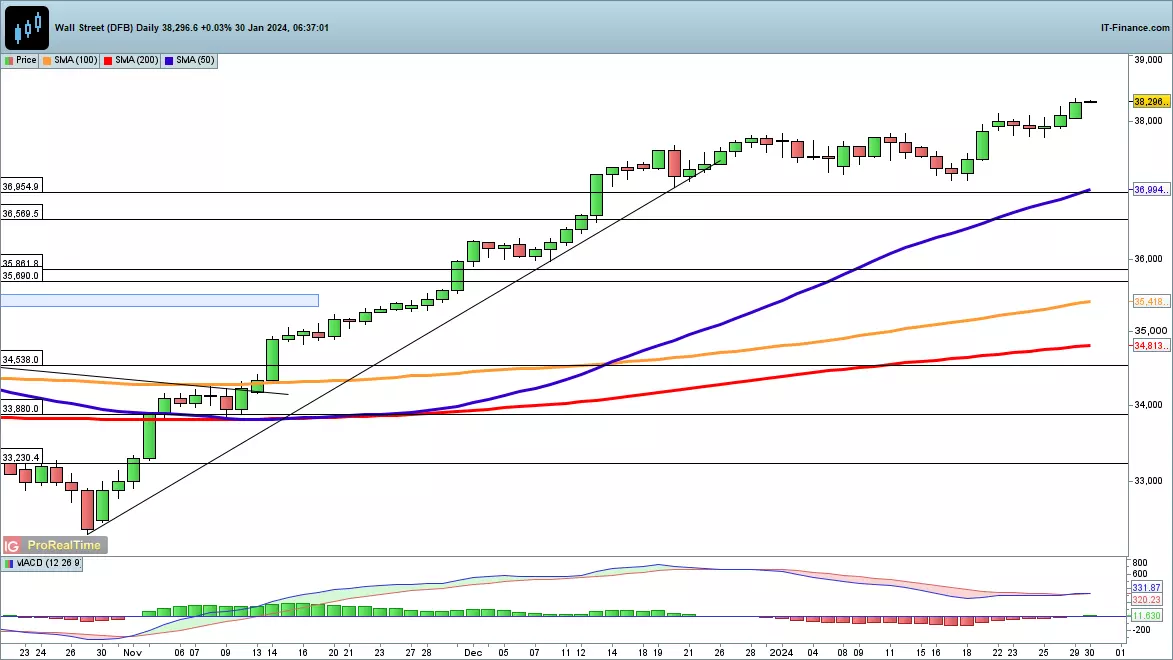
Dow hits new record
The index sits at a new record high, having made further gains on Monday. This marks a continuation of the breakout from 19 January, taking the index further into new territory. Recent weakness from mid-December found buyers at 37,100, so in the short-term any weakness may find support around this level. A deeper retracement may develop if the index closes below the 50-day simple moving average (SMA).
 Source: ProRealTime
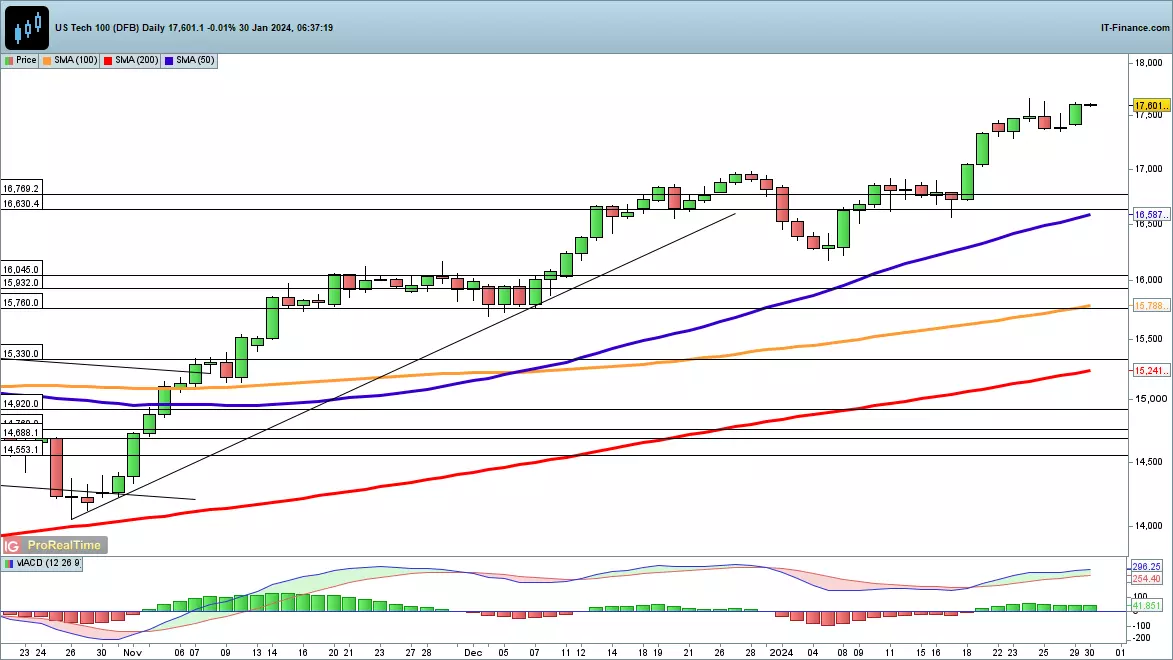
Nasdaq 100 steady ahead of tech earnings
Monday saw the index head back towards last week’s record high, maintaining the leg higher from the early January low. Trendline support from early January could come into play in the event of a push back towards 17,000. Below this the 16,630 support area and then the 50-day SMA come into view. This week could see some volatility return, given the presence of earnings from Microsoft, Alphabet, Apple, Meta and Amazon on the calendar.
 Source: ProRealTime
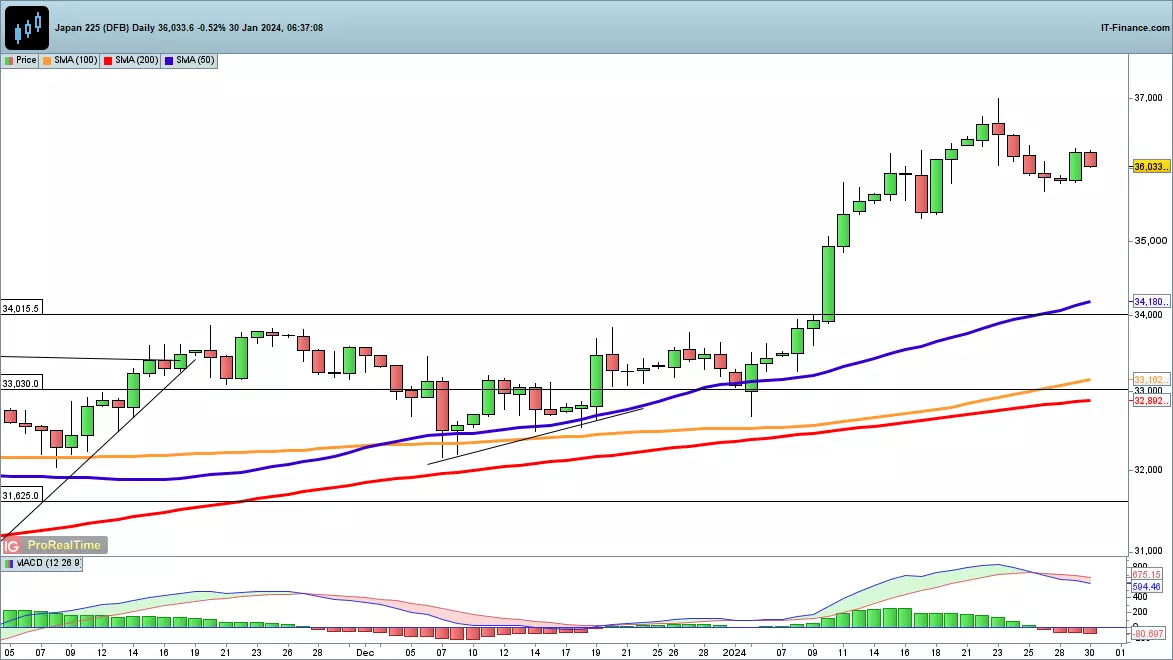
Nikkei 225 turns higher
The new week saw the Nikkei 225 move higher, recouping some of the losses suffered over the past week. Should a new higher low have been formed, then a resumption of the move higher will target 37,000. A close above this then leaves the 1990 high at 38,951 as the last area of potential resistance currently. Short-term weakness targets the mid-January low around 35,340.
 Source: ProRealTime
-
On 28/01/2024 at 11:27, Bash4j said:
Support and resistance are significant levels in the price and a direct offshoot of supply and demand levels. In fact, all support and resistance lines were originally supplies or demand zones in which the price was already tested a few times. That is how support and resistance are created – they are essentially the confirmed supply and demand levels

Thanks for sharing @Bash4j
-
-
On 28/01/2024 at 17:36, Bitroko said:
Cryptocurrency can be a risky investment, and it's important to be aware of the potential downsides before putting any money into it. Here are some of the ways crypto could break you:

Thanks for sharing @Bitroko
-
Asian indices were broadly lower overnight, with just the ASX 200 eking out a small gain. Chinese markets once again led the way lower as worries about the property sector and the prospect of new security laws in Hong Kong dampened sentiment. Markets face a wave of key data from today onwards, with eurozone GDP and earnings from Microsoft and Alphabet the big events of the session. US indices finished up the day with fresh gains, and the Dow hit a new record high, but with earnings, a Fed decision and payrolls all taking place this week stocks may struggle to hold their gains in the short-term. While oil prices dropped yesterday, the world continues to await a US response to the deaths of three of its soldiers in Jordan at the weekend, raising fears of an escalation in the situation in the Middle East.

-
McDonald’s Q4 2024 earnings preview: what to expect amid Middle East boycott.
 Source: Bloomberg
When will McDonald's report its latest earnings?
McDonald’s is set to release its fourth quarter (Q4) 2023 results on 5 February 2024. The results are for the quarter ending December 2023.
Key financial highlights for Q4 2023
Key financial highlights for the upcoming results are as follows:
Revenue of $6.452 billion : +8.86% year-on-year (YoY)
Earnings per Share (EPS) : $2.82: +8.88% (YoY)
Price-to-earnings (P/E) ratio: 25.75
Restaurant margin : 15.48% (versus 5.00% Q4 2022)
Dividend yield: 2.29%
McDonald’s Q4 earnings impacted by Middle East boycott
McDonald's is currently facing challenges from a boycott in the Middle East due to false accusations of supporting Israel. This boycott has had a meaningful impact on the company's business, and analysts will be interested in learning more about the sales impact and how long it is expected to last.
During the earnings call on the 5 February, analysts will also be looking for updates on the sustainability of operating margins in light of last year’s cost inflation. McDonald's has maintained stable margins in recent years through menu price increases and technology initiatives, and investors will want to see evidence that this can continue. Furthermore, there will be interest in an update on McDonald's business in China, which is its third largest market globally. Restoring operations in China to full capacity is crucial for the company's momentum.
McDonald's has strong business fundamentals and a strong brand, which should help it navigate through the difficulties, especially if inflation in the US continues to subside and the country’s economy manages the soft landing analysts currently forecast.
If inflation were to flare up again due to an escalation in the Middle East and the Suez Canal being de facto closed to non-Russian containerships, and perhaps soon oil tankers as well, McDonald's has in the past been successful in passing on price increases without significantly affecting demand and may well do so again. There are limits to its pricing power, though, especially in a potential recession which would negatively affect consumer spending while input and labour costs may increase once more. If market conditions were to worsen, McDonald's could implement discounting strategies to capture market share through value offerings and leveraging its size advantage.
Despite the challenging environment in the Middle East, McDonald's has maintained a strong appetite for its food and beverages. The company is expected to benefit from increased US same-store sales and a larger share of the quick-service market in 2023, driven by the growth of digital orders and value offerings. McDonald's loyalty program, with approximately 25 million active members, has the potential to drive digital sales and increase customer frequency, contributing to the growth of US comparable sales.
The company planned to expand its global franchise in 2023 with 400 openings in the US and 1,500 globally, including 900 in China. These new restaurants were expected to contribute around 1.5% to sales growth in 2023. The upcoming results should shed more light on these expansion plans.
How to trade McDonald’s into the results
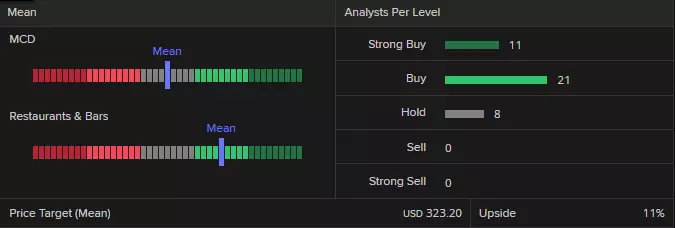 Source: Refinitiv
Refinitiv data shows a consensus analyst rating of ‘buy’ for McDonald’s – 11 strong buy, 21 buy and 8 hold - with the median of estimates suggesting a long-term price target of $323.20 for the share, roughly 10.68% higher than the current price (as of 29 January 2024).
McDonald’s technical view
The McDonald’s 23% share price gain from its October $245.73 low to last week’s $302.39 all-time record high has given way to some profit taking ahead of its Q4 results.
The fall through the October-to-January uptrend line at $295.36 puts the mid-December to current January lows at $287.20 to $285.72 back on the plate. As long as this support zone holds, the medium-term uptrend remains intact.
McDonald’s Daily Chart
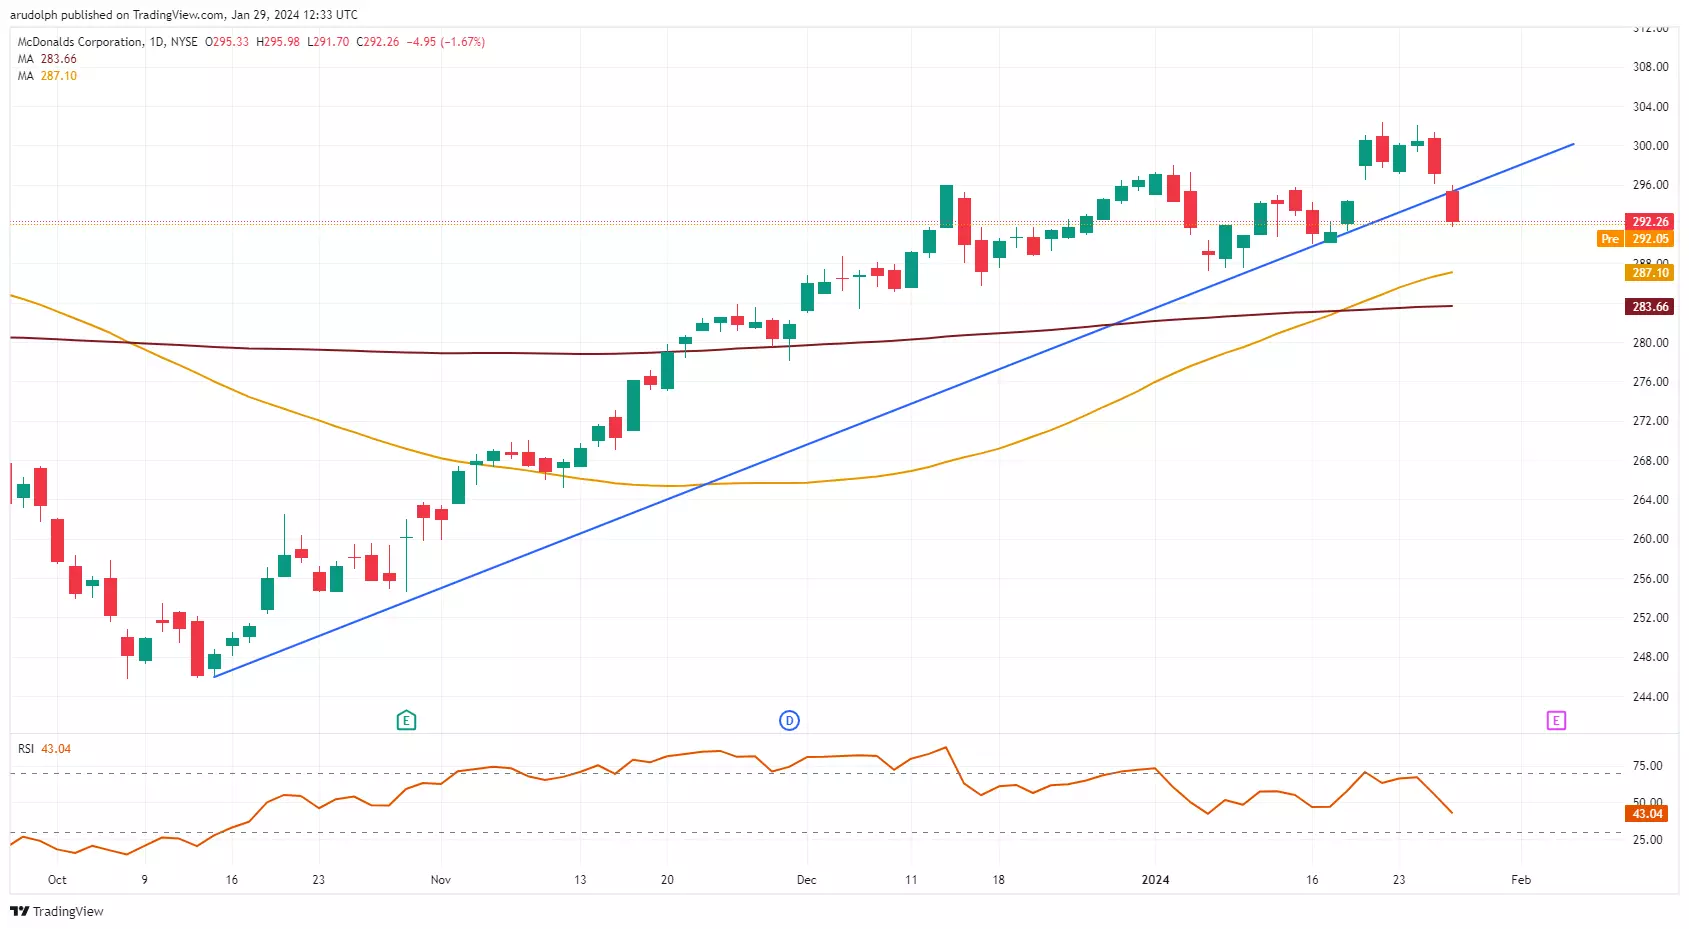 Source: Tradingview
A fall through and daily chart close below the $285.72 mid-December low would most likely lead to the 200-day simple moving average (SMA) at $283.66 being revisited.
Provided that the next lower late-November low at $278.06 isn’t being fallen through, though, the overall technical picture for the McDonald’s share price remains long-term bullish.
A rise above the current January all-time high at $302.39 would bring the minor psychological $350 region to the fore.
This information has been prepared by IG, a trading name of IG Markets Limited. In addition to the disclaimer below, the material on this page does not contain a record of our trading prices, or an offer of, or solicitation for, a transaction in any financial instrument. IG accepts no responsibility for any use that may be made of these comments and for any consequences that result. No representation or warranty is given as to the accuracy or completeness of this information. Consequently any person acting on it does so entirely at their own risk. Any research provided does not have regard to the specific investment objectives, financial situation and needs of any specific person who may receive it. It has not been prepared in accordance with legal requirements designed to promote the independence of investment research and as such is considered to be a marketing communication. Although we are not specifically constrained from dealing ahead of our recommendations we do not seek to take advantage of them before they are provided to our clients. See full non-independent research disclaimer and quarterly summary.
-
The first Fed decision of 2024 takes place this week. While no change is expected this time around, will the FOMC indicate rate cuts are on their way?
 Source: Bloomberg
First Fed decision of 2024 looms
As we approach the end of the first month of the year, the Federal Reserve's Open Market Committee (FOMC) meeting is a focal point for traders and investors alike. The anticipation of maintaining the current federal funds rate target range of 5.25-5.5% has set a tone of cautious optimism in the market.
For traders, understanding the implications of the Federal Reserve's (Fed) stance on interest rates is crucial. Interest rates are a fundamental driver of economic activity, influencing everything from consumer borrowing costs to corporate investment decisions. When interest rates are high, it can dampen economic growth as loans become more expensive, potentially leading to reduced spending by both consumers and businesses.
Rate hikes give way to cuts in 2024
In 2022 and 2023, the Fed implemented aggressive rate hikes in response to heightened inflation. This monetary tightening was aimed at cooling off an overheated economy and bringing inflation down to manageable levels. Since July, however, the Fed has held rates steady, which has been interpreted as a sign of confidence that inflation is beginning to moderate.
For traders, this period of stability offers a chance to reassess their portfolios and strategies. In particular, it provides an opportunity to look for companies that are well-positioned to benefit from stable interest rates. For example, financial institutions such as JPMorgan Chase & Co. (JPM) and Bank of America Corp. (BAC) might see a more predictable interest margin environment, which can help in planning their lending and investment activities.
Quantitative tightening replaces easing
Furthermore, the Fed's decision to continue allowing up to $95 billion per month of asset roll-offs from its balance sheet will have implications for liquidity in the financial system. This gradual reduction of the Fed's holdings, often referred to as quantitative tightening, can impact the availability of credit and the performance of various asset classes.
Despite the aggressive measures taken to combat inflation, recent data suggests that the U.S. economy remains resilient. Solid job growth and consumer strength indicate that a recession in 2023 now seems less likely. For traders, this resilience could translate into opportunities within the equity markets. Stocks have performed well over the past year, and sectors such as technology, represented by companies like Apple and Microsoft or consumer discretionary, where giants like Amazon lead the way, might continue to offer growth potential in a stable-rate environment.
Decision watched for clues on future policy
Investors are also closely monitoring the Fed's communications for any hints of future policy actions. The possibility of rate cuts starting in March or later in the year could signal a shift in the economic outlook and strategy. The timing of these cuts will be critical for traders, as markets typically react swiftly to any changes in monetary policy.
The Fed's forecasts for slower U.S. economic growth in 2024-2025, with higher unemployment and inflation still above target, present a mixed picture for traders. On one hand, slower growth and higher unemployment could signal caution, leading traders to seek shelter in more defensive stocks or asset classes. On the other hand, the continued strength of inflation above the Fed's target may maintain pressure on the central bank to keep interest rates higher for longer, which could benefit sectors like utilities or consumer staples, traditionally seen as less sensitive to economic downturns.
In the face of these economic projections, investors remain hopeful that the Fed can achieve a "soft landing" by bringing down inflation without severely damaging growth. This delicate balancing act by the Fed would be a best-case scenario, allowing the economy to adjust gradually to the new interest rate environment without tipping into recession.
This information has been prepared by IG, a trading name of IG Markets Limited. In addition to the disclaimer below, the material on this page does not contain a record of our trading prices, or an offer of, or solicitation for, a transaction in any financial instrument. IG accepts no responsibility for any use that may be made of these comments and for any consequences that result. No representation or warranty is given as to the accuracy or completeness of this information. Consequently any person acting on it does so entirely at their own risk. Any research provided does not have regard to the specific investment objectives, financial situation and needs of any specific person who may receive it. It has not been prepared in accordance with legal requirements designed to promote the independence of investment research and as such is considered to be a marketing communication. Although we are not specifically constrained from dealing ahead of our recommendations we do not seek to take advantage of them before they are provided to our clients. See full non-independent research disclaimer and quarterly summary.
-
Quiet day for FTSE 100, DAX 40 and S&P 500 ahead of key macro data and earnings
Outlook on FTSE 100, CAC 40 and S&P 500 amid Fed and BoE meetings and as five of the ‘magnificent seven’ US stocks report their earnings ahead of Friday’s US Non-Farm Payrolls.
 Source: Bloomberg
FTSE 100 mixed after healthy gains last week
The FTSE 100’s gradual advance from its mid-January low at 7,403 accelerated to the upside on Friday amid rallying luxury good stocks and general risk-on sentiment with the index gaining 1.4%. Monday morning is likely to be quieter, though, as the economic calendar looks pretty empty ahead of this week’s US Federal Reserve (Fed) and Bank of England (BoE) monetary policy meetings, earnings by five of the ‘magnificent seven’ US stocks and US employment data. A rise above Friday’s 7,653 high would engage the 11 January high at 7,694. Minor support comes in around the 12 December 7,609 high and at the 16 January 7,587 high.
 Source: ProRealTime
DAX 40 mixed after five consecutive days of gains
The DAX 40 index continues its advance towards its December record high around the 17,000 mark as investors look forward to a packed macro and earnings week. The January uptrend line at 16,872 may act as support, together with the 11 January high at 16,841 whereas the December-to-January resistance line at 16,966 and last week’s high at 16,969 should act as resistance ahead of the December 17,003 peak.
 Source: ProRealTime
S&P 500 consolidates below last week’s record highs
The S&P 500 is seen trading close to last week’s record highs made marginally above the 4,900 mark as investors await earnings by the likes of Alphabet, Amazon, Apple, Meta and Microsoft which are likely to provide additional volatility. A rise above last week’s 4,907 record high may engage the psychological 5,000 mark. Minor support below the Tuesday 23 high at 4,877 comes in at Friday’s 4,871 low.
 Source: ProRealTime
-
The US Federal Reserve is expected to maintain its key interest rates at current levels this week with the Funds Rate target range forecast to remain between 5.25% and 5.5% for a fourth consecutive meeting.
Fed funds futures currently price in a 97.4% chance of no change. Then on Thursday, the Bank of England (BoE) is also set to stay put on rates. Governor Andrew Bailey and other top BOE members have been saying until recently that a rate cut would be premature. They also warned about the risks from strong wage growth, as IGTV’s Angela Barnes explains.
(AI Video Summary)
The Federal Reserve
The Federal Reserve, which is basically the central bank of the United States, is most likely going to keep its key interest rates the same for the fourth time in a row. This means they won't be changing how much it costs to borrow money. However, there is a good chance (around 59.7%) that when they meet in March, they might actually lower the rates by a little bit, like 0.25%. The goal of all this is to make sure the US economy grows in a nice and steady way, not too fast or too slow. They expect the economy to grow by about 1.4% in 2024 and they want the unemployment rate to be around 4.1%.
At the same time, the Federal Reserve plans to shrink its balance sheet, which is basically the total amount of money and assets they have, by selling some of the things they own. Right now, they're selling up to $95 billion worth of stuff every month, but they still have a long way to go to get back to where they were before the pandemic, which was around $4.15 trillion in February 2020.
The Bank of England
Now, let's talk about the Bank of England (BOE), which is the central bank of the United Kingdom. They're also probably going to keep their interest rates the same for now. The top people at the bank, like Governor Andrew Bailey, have said it's too early to lower the rates. They're worried that if they do, it might lead to some problems because the wages people are getting paid are going up too quickly. However, the recent data on things like how prices are going up, how much people are getting paid, and how the economy is doing, has been not as good as they expected. So they might change their minds and decide to lower the rates after all.
In short, the Federal Reserve is going to keep interest rates the same and wants the US economy to keep growing in a nice way. The Bank of England is also not planning to change interest rates, but if the economy keeps underperforming, they might change their minds.
This information has been prepared by IG, a trading name of IG Markets Limited. In addition to the disclaimer below, the material on this page does not contain a record of our trading prices, or an offer of, or solicitation for, a transaction in any financial instrument. IG accepts no responsibility for any use that may be made of these comments and for any consequences that result. No representation or warranty is given as to the accuracy or completeness of this information. Consequently any person acting on it does so entirely at their own risk. Any research provided does not have regard to the specific investment objectives, financial situation and needs of any specific person who may receive it. It has not been prepared in accordance with legal requirements designed to promote the independence of investment research and as such is considered to be a marketing communication. Although we are not specifically constrained from dealing ahead of our recommendations we do not seek to take advantage of them before they are provided to our clients. See full non-independent research disclaimer and quarterly summary.
-
Closing January with style, Wall Street sees the S&P 500 and Nasdaq breaking winning streaks as investors eye the Core PCE data drop and await the critical FOMC interest rate decision.
The S&P 500 and the Nasdaq snapped six-session winning streaks on Friday, with traders booking profits and moving to the sidelines ahead of a busy week of corporate earnings and economic data. With three trading sessions left in January, the tech-heavy Nasdaq has added 3.54% MTD, the S&P 500 has added 2.54%, and the Dow Jones is 1.11% higher.
The much-anticipated December Core Personal Consumption Expenditures (PCE) fell to 2.9% versus 3% expected, the lowest rate since March 2021. Core PCE on a six-month annualised basis sits at 2%, and with the disinflation trend firmly in place, Federal Reserve rate cuts are coming. The only question is when.
This week’s key economic events, the January Federal Open Market Committee (FOMC) meeting and Non-Farm Payrolls, could see the rates market pull forward or push back a first Federal Reserve rate cut currently fully priced for May.
US Q4 earnings season continues this week with reports scheduled from companies including Pfizer, Alphabet, Starbucks, AMD, Microsoft Corp (previewed here), Mastercard, Boeing, Qualcomm, Meta, Apple (previewed here), Amazon, Exxon Mobil Corp, and Chevron Corp.
What is expected from the FOMC interest rate decision
Date: Thursday, February 1st at 6 am AEDT
At its last meeting in December, the FOMC kept the Federal Funds rate unchanged at 5.25%-5.50% for a third consecutive meeting. In the accompanying statement, the Fed noted that economic growth has slowed, job gains have moderated, and inflation has eased. The all-important Fed’s “dot plots” within the Summary of Economic Projections (SEP) indicated 75 basis points of rate cuts in 2024.
While the Fed will no doubt be pleased that the disinflation trend has continued against a backdrop of moderating growth, comments from Federal Reserve Board Governor Waller in mid-January indicate that the Fed is not yet ready to signal that rate cuts are imminent.
As such, the FOMC is expected to keep the Federal Funds rate unchanged at 5.25%-5.50%. It will likely open the door to future rate cuts via a change in its forward guidance. This can be done by removing its out-of-date tightening bias that says “the extent of any additional policy firming” with a neutral statement that indicates the Fed's rate-hiking cycle is over.
Fed fund rates
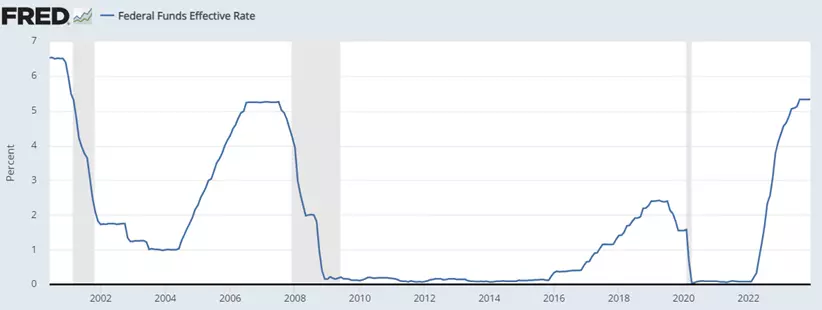 Source: Federal Reserve Economic Data
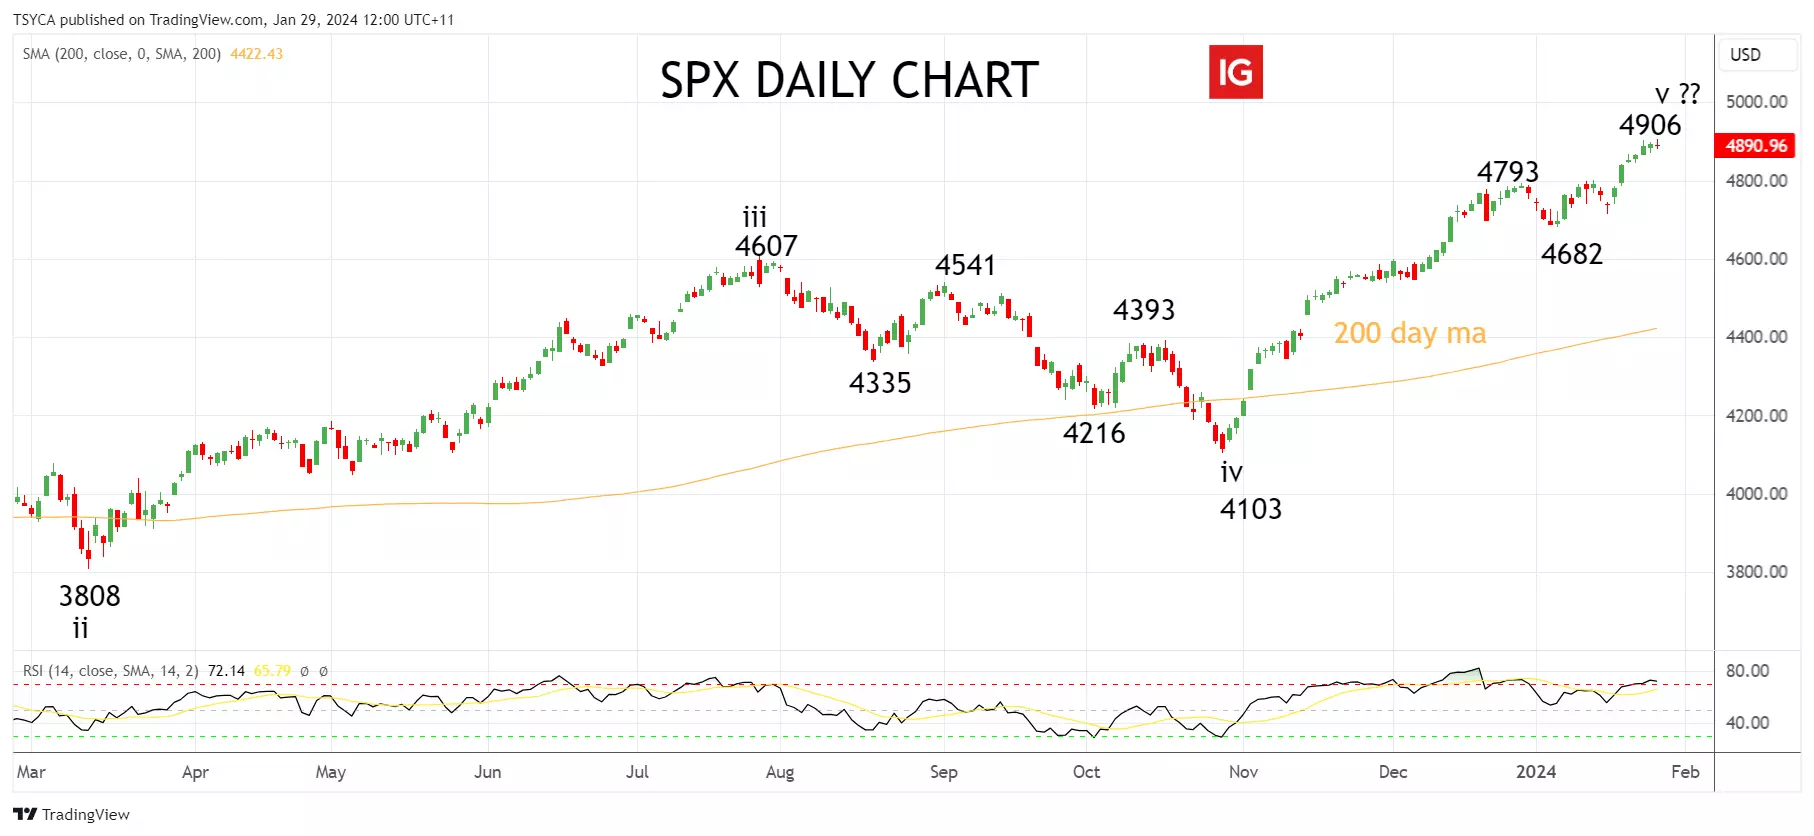
S&P 500 technical analysis
After a strong rally for the S&P 500 towards the end of 2023, we started the New Year with a more cautious and neutral mindset.
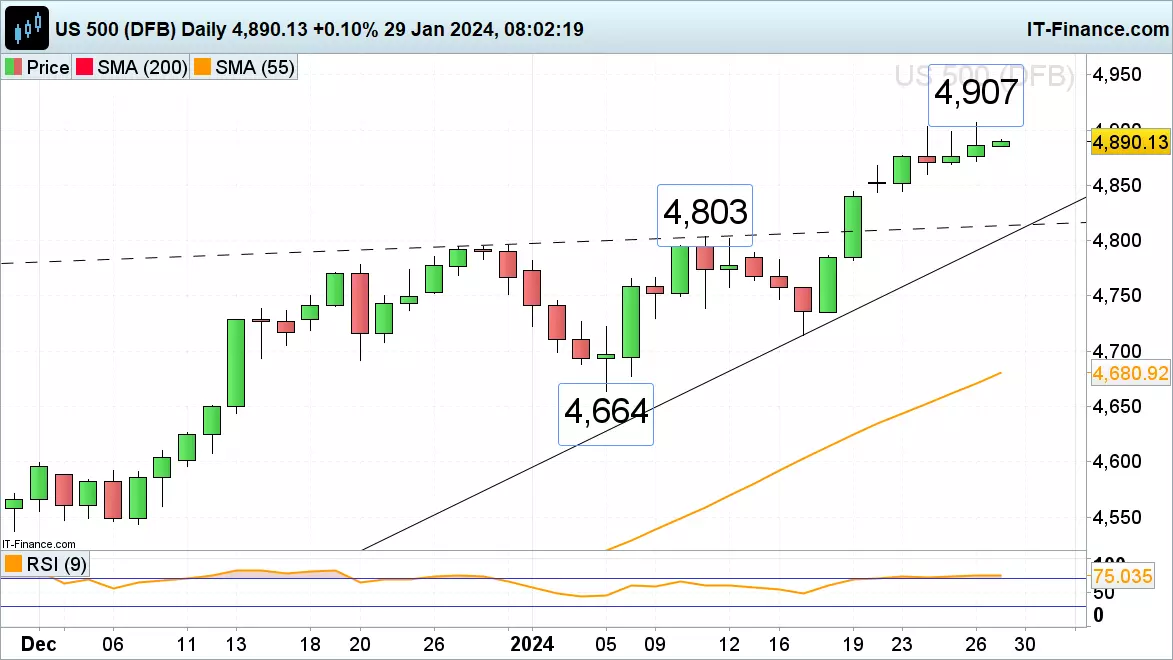
We maintain the view that the S&P 500 is in the final stages, or Wave V, of its rally from the October 2023 low. We again note the bearish Relative Strength Index (RSI) divergence on the daily chart. Bearish RSI divergence occurs when prices make new highs, but the RSI fails to reach new highs.
Consequently, we remain patient, awaiting the development of a pullback in the coming weeks in the order of 5-8% — a pullback we are looking to buy.
S&P 500 daily chart
 Source: TradingView
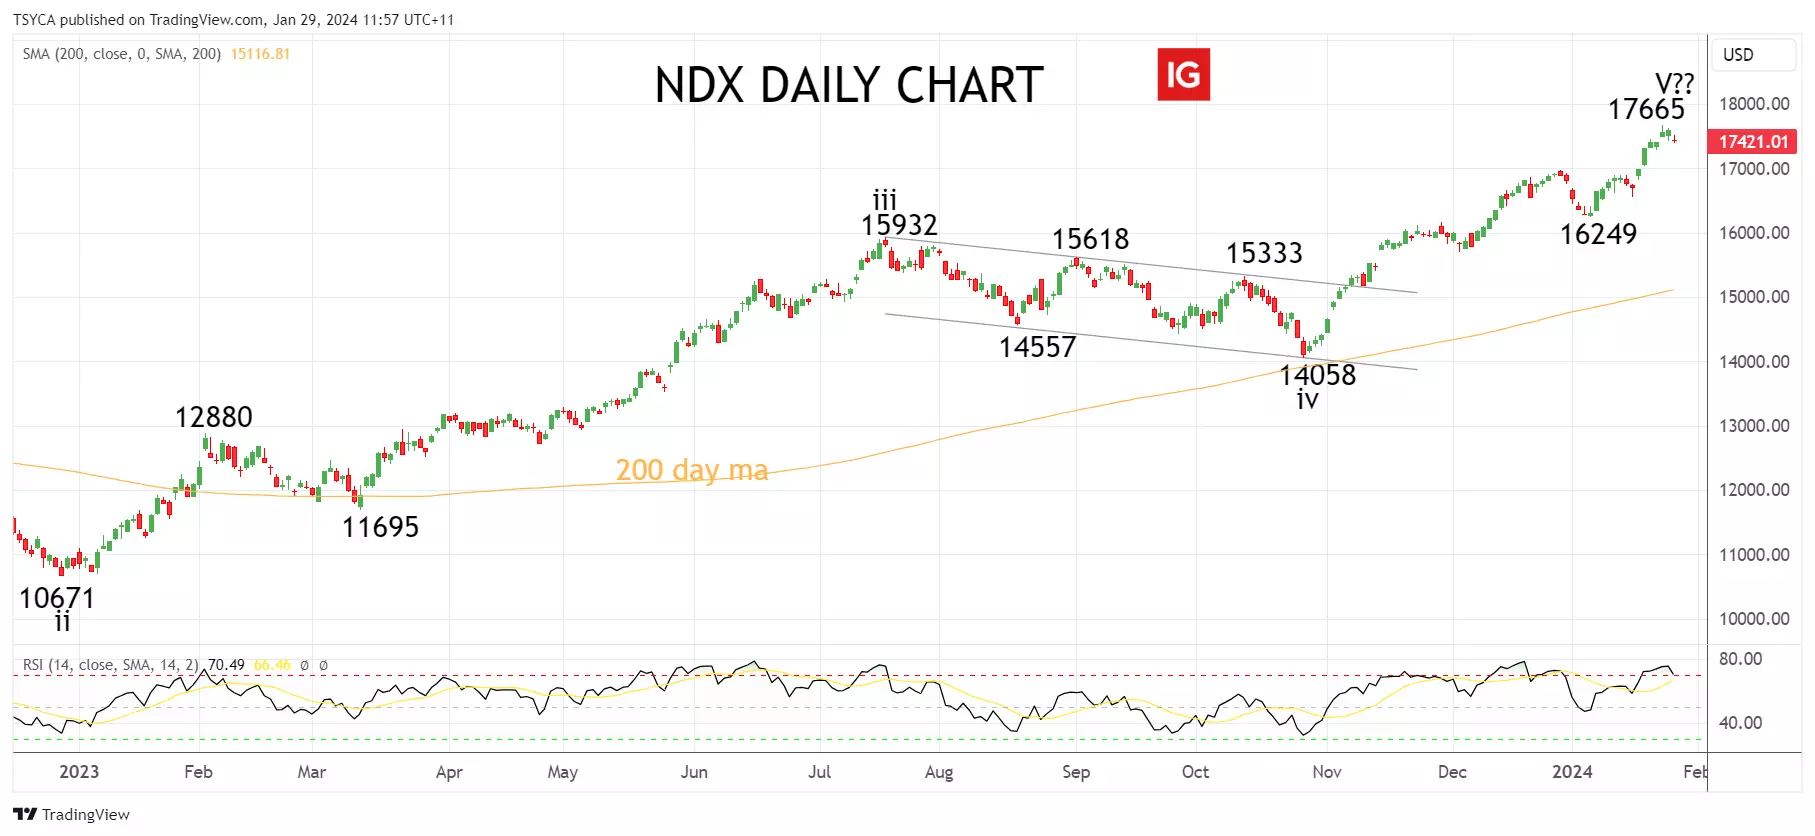
Nasdaq technical analysis
After a strong rally for the Nasdaq towards the end of 2023, we entered the new year with a more cautious and neutral mindset.
We continue to believe that the Nasdaq is in the final stages, or Wave V, of its rally from the low in October 2023. This perspective is bolstered by ongoing evidence of bearish Relative Strength Index (RSI) and a 'loss of momentum' type weekly candle.
In light of this, we remain patient, waiting for a pullback to develop in the coming weeks in the order of 5-10% — a pullback we are preparing to buy.
Nasdaq daily chart
 Source: TradingView
- Source: TradingView. The figures stated are as of 29 January 2023. Past performance is not a reliable indicator of future performance. This report does not contain and is not to be taken as containing any financial product advice or financial product recommendation.
This information has been prepared by IG, a trading name of IG Markets Limited. In addition to the disclaimer below, the material on this page does not contain a record of our trading prices, or an offer of, or solicitation for, a transaction in any financial instrument. IG accepts no responsibility for any use that may be made of these comments and for any consequences that result. No representation or warranty is given as to the accuracy or completeness of this information. Consequently any person acting on it does so entirely at their own risk. Any research provided does not have regard to the specific investment objectives, financial situation and needs of any specific person who may receive it. It has not been prepared in accordance with legal requirements designed to promote the independence of investment research and as such is considered to be a marketing communication. Although we are not specifically constrained from dealing ahead of our recommendations we do not seek to take advantage of them before they are provided to our clients. See full non-independent research disclaimer and quarterly summary.
-
The dollar may find temporary support before the Fed builds its case for rate cuts; euro appears vulnerable heading into next week due to GDP data; and GBP/USD range likely to be tested. Meanwhile USD/JPY shows a sign of fatigue.
 Source: Bloomberg
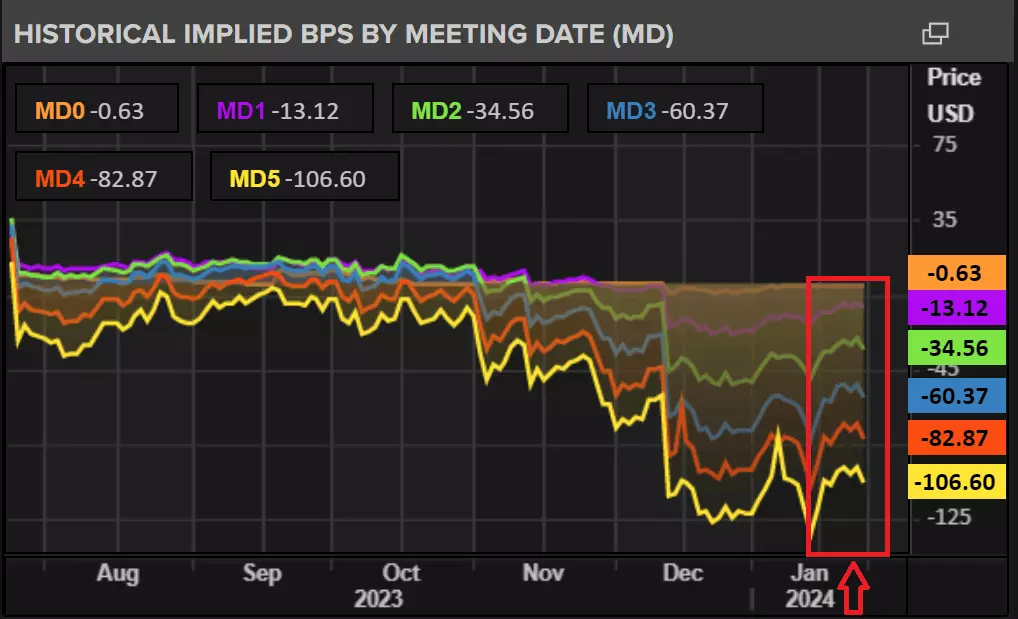
The dollar may find temporary support before the Fed builds its case for rate cuts
In the days and weeks leading up to the next week’s FOMC meeting, prominent Fed members warned that overzealous expectations around future rate cuts were too optimistic, and that the Fed does not intend to cut the benchmark rate as quickly as markets anticipated.
The chart below shows how future rate expectations for all 2024 Fed funds futures contracts have been tapered back since. The coloured lines have moved higher, signaling a reduced probability of rate cuts across the board since the end of last year. Reduced rate cut adds support to the dollar, but the bar for an extended bullish move is very high.
Rate cut expectations for 2024
 Source: Refinitiv
Accompanying data has helped drive the Fed’s message home as hotter than expected December CPI revealed lingering price pressures, although a lot of that was influenced by base effects which are mostly behind us now.
Additionally, January’s flash PMI data was strong as was the Q4 GDP print despite falling from the 4.9% growth in Q3. Equity markets soar and the unemployment rate is well below 4% now, meaning the ‘soft landing’ or ‘golden path’ gains favour once again. If the Fed sees upside risks to services inflation as a result of the strong data, it will continue to proceed with caution, but the statement in general is expected to move towards a more neutral tone which we could see as early as next week.
Moving from rate hikes to rate cuts is a lot like trying to turn around a massive freight ship. You first have to reduce speed, then turn before proceeding in the opposite direction. I anticipate we’ll see more of a reduction in speed next week. The chart below shows the duration between the last rate hike, and first rate cut since the 1970s. Interestingly, the average of these plateaus can be rounded up to 6 months. Today marks exactly 6 months since the Fed last hiked the Fed funds rate.
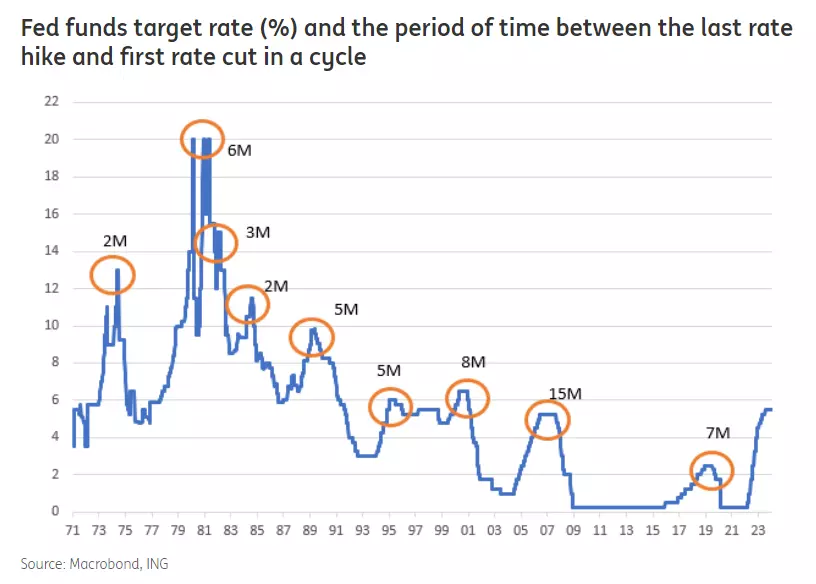 Source: ING, Macrobond
Euro appears vulnerable heading into next week
The EU has received lacklustre economic data recently and even sentiment indicators have lost a bit of the recent momentum. PMI data continued to contract while positive developments were seen in the US. Next week, EU and German GDP data could finally confirm a technical recession, but based off comments from ECB members today, it would appear stagnation is seen as more realistic than a recession. That is according to the ECB’s Vujcic.
The weekly EUR/USD chart is on track for a second weekly close lower, extending the downtrend since the late December swing high. This week’s high failed to close above 1.0929, seeing the pair on track to close in the red.
EUR/USD weekly chart
 Source: TradingView
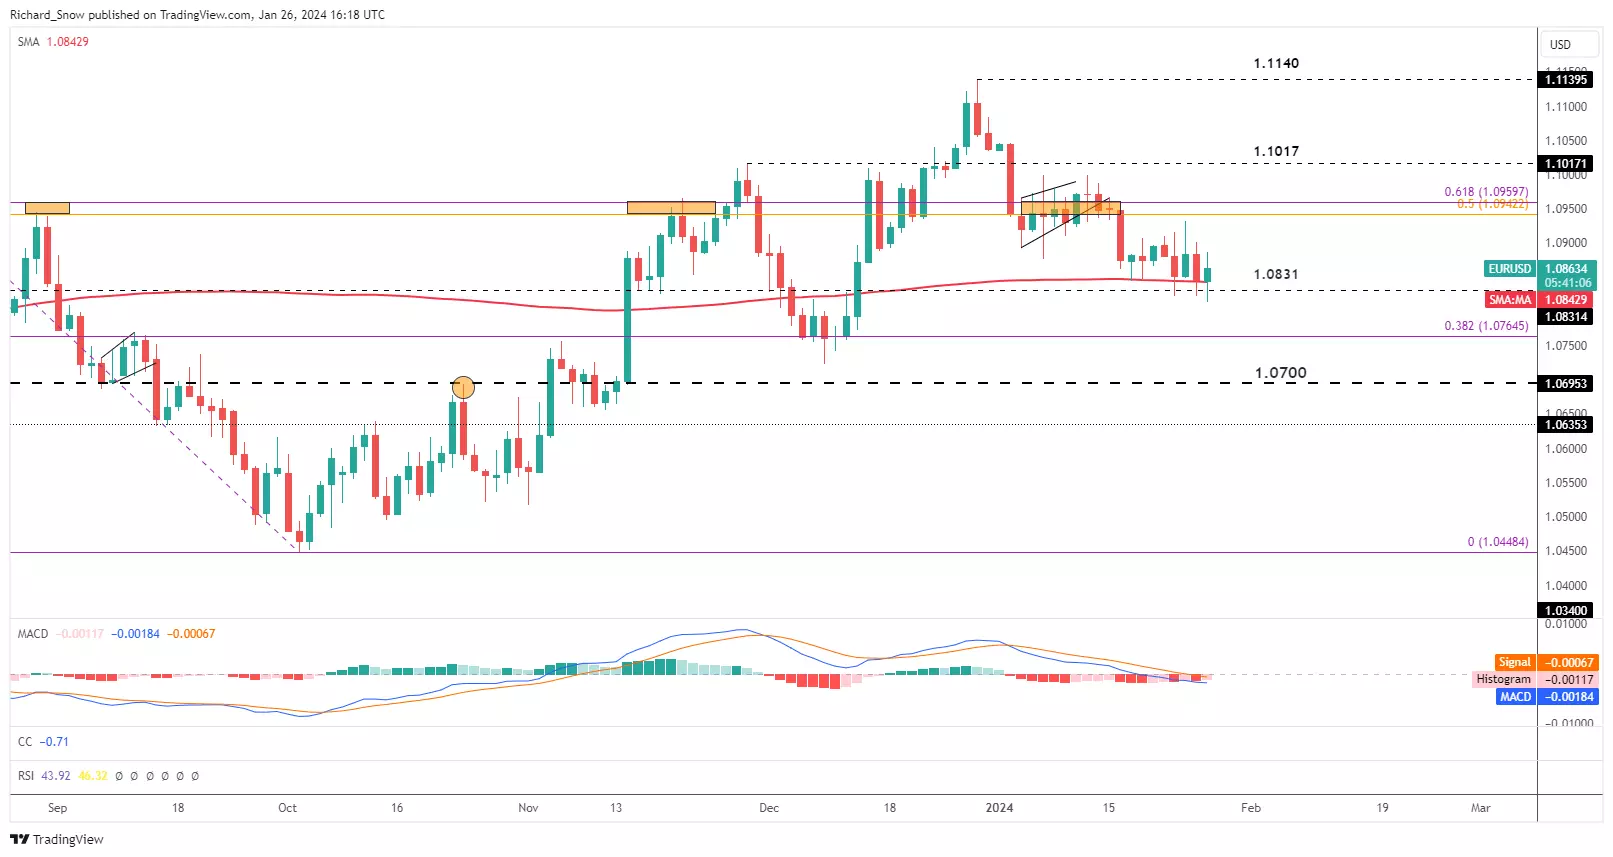
The daily EUR/USD chart found dynamic resistance at the 50-day simple moving average (SMA), restricting price action between the 50 and 200-day SMAs. The pair was unable to post a directional move in either direction as momentum appeared to be lacking.
In the coming week, I expect the 200 SMA to come under pressure again, especially if EU data disappoints again. Immediate support remains at the 200 SMA, followed closely by 1.0830 with 1,0765 next up (the 38.2% Fibonacci retracement of the 2023 decline).
Resistance remains at the 50-day SMA, followed by the zone of resistance around 1.0950.EUR/USD daily chart
 Source: TradingView
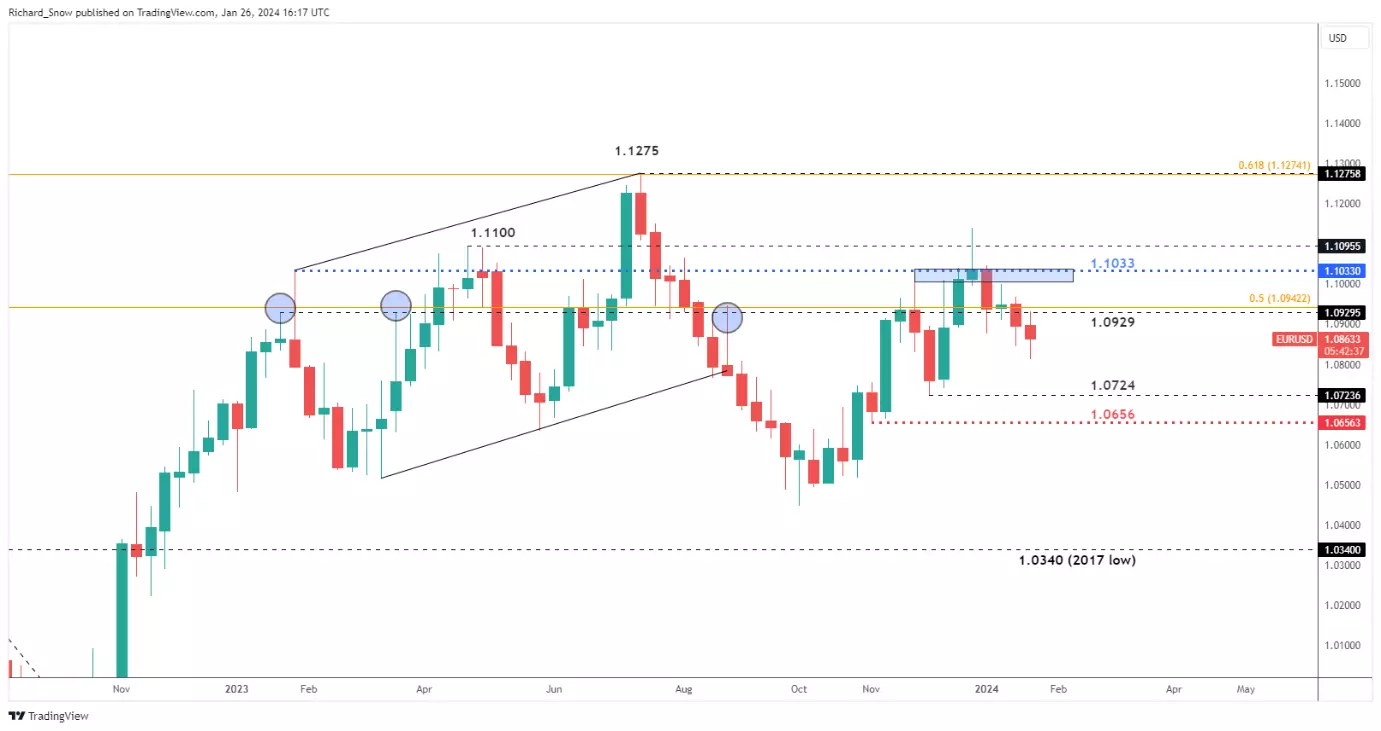
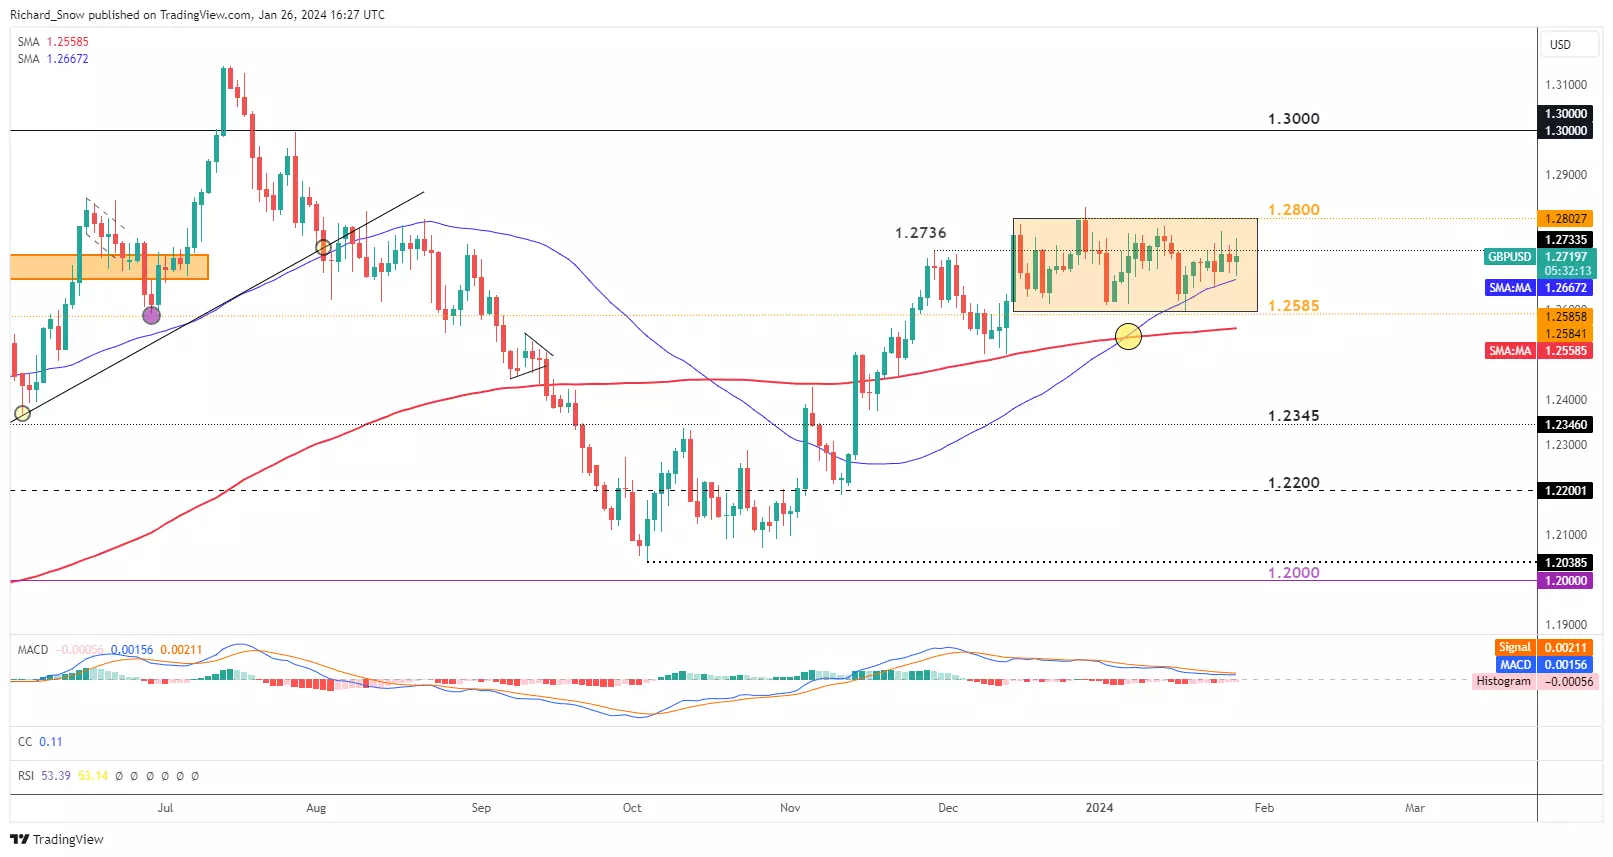
Cable (GBP/USD) range likely to be tested due to anticipated lift in volatility
GBP/USD has traded within a broad range for a number of weeks now with the little sign of sufficient momentum either to the upside or the downside. The 50-day simple moving average has tracked price action closely, acting as dynamic support.
The prior swing high at 1.2736 has repelled bulls, particularly on a daily closing basis evidenced via multiple extended upper wicks. Volatility is anticipated to rise towards the middle of next week around the Bank of England and Fed meetings but that doesn’t promise there’ll be a concerted directional move. In fact, given recent directional uncertainty, the pair may experience an uptick in volatility but revert to trading sideways once the dust settles.
The assumption behind the continued lack of direction is based on the January meetings perhaps not providing much, if any, new information. The January meetings seem like a moment too soon to make drastic changes to policy, allowing central banks the time to more seriously consider changes at later meetings after analysing more data. There will be a lot of new data between the January meeting and the 20th and 21st of March meetings for the Fed and BoE respectively.
GBP/USD daily chart
 Source: TradingView
USD/JPY shows sign of fatigue after strong bull run
USD/JPY made a strong and swift recovery after the late December swing low, rising over 6% since then as the markets tapered aggressive rate cut bets which provided broad support for the greenback. The bullish move was helped in part by a more bearish view of the yen which became vulnerable after recent inflation data showed signs of easing.
Japanese CPI has declined over the last two months at a time when the Bank of Japan is closely watching price trends and rising wage growth as the two preconditions for a policy shift. However, after the BoJ meeting, Governor Ueda’s comments continued to focus on what seemed like an inevitable policy shift and crucially admitted that “the probability of reaching the bank’s 2% target is rising gradually” – something that could see the yen reclaiming some lost ground.
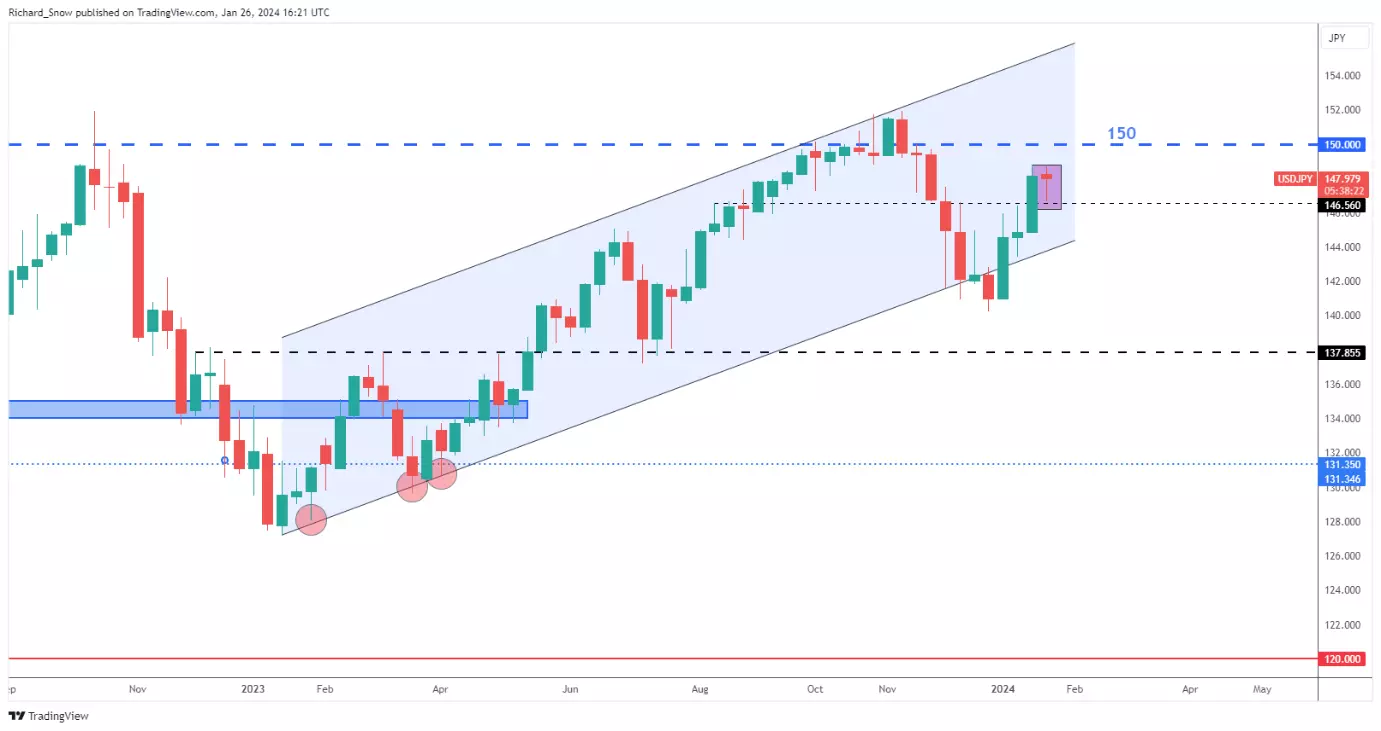
The weekly chart reveals a hanging man candle, which is typically viewed as a bearish continuation pattern. Since price was unable to surpass or even retest the prior high, another move lower cannot be disregarded. The major psychological level of 150 appears some distance away but one level to note to the downside is 146.56. A close below this level could see another test of channel support thereafter. While the other pairs reveal a susceptibility to dollar strength, USD/JPY may struggle to rally if broader yen appeal grows.
USD/JPY weekly chart
 Source: TradingView
Major US event risk ahead:
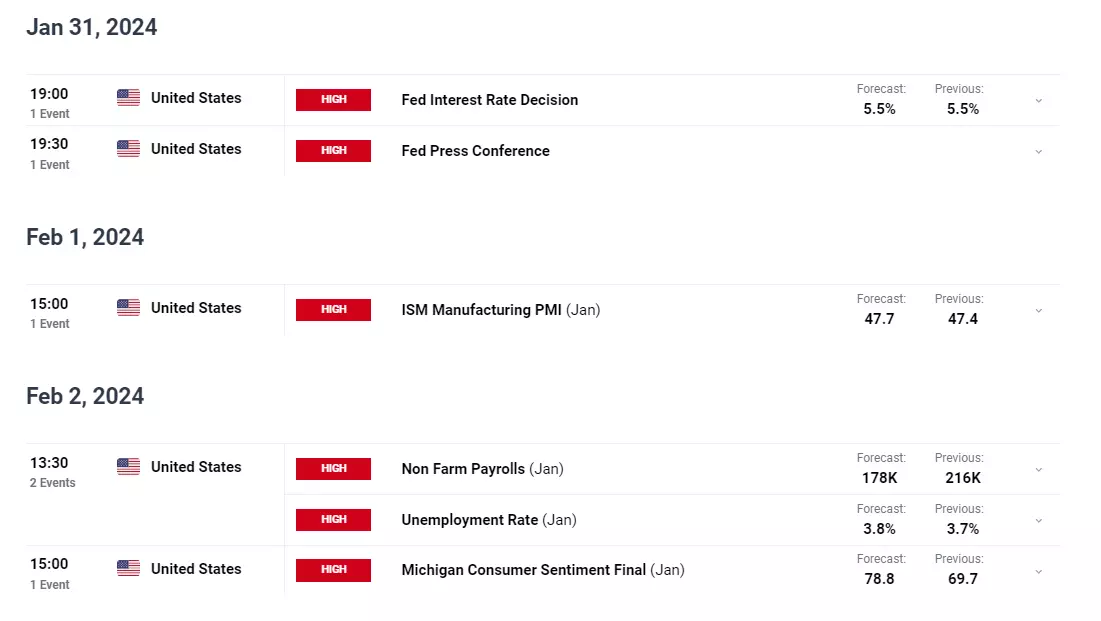 Source: TradingEconomics
This information has been prepared by IG, a trading name of IG Australia Pty Ltd. In addition to the disclaimer below, the material on this page does not contain a record of our trading prices, or an offer of, or solicitation for, a transaction in any financial instrument. IG accepts no responsibility for any use that may be made of these comments and for any consequences that result. No representation or warranty is given as to the accuracy or completeness of this information. Consequently any person acting on it does so entirely at their own risk. Any research provided does not have regard to the specific investment objectives, financial situation and needs of any specific person who may receive it. It has not been prepared in accordance with legal requirements designed to promote the independence of investment research and as such is considered to be a marketing communication. Although we are not specifically constrained from dealing ahead of our recommendations we do not seek to take advantage of them before they are provided to our clients.
-
AUD/USD falls for the fourth week to .6573, with upcoming q4 inflation data set to impact RBA's rate decision amid China's stimulus and Australian tax cuts.
 Source: Bloomberg
A fourth consecutive weekly fall for the AUD/USD, as it finished the week at .6573 (-0.35%), extended its pullback from the late December .6871 high.
Last week's weakness in the AUD/USD came despite the price of iron ore snapping a two-week losing streak and new stimulus announcements in China, including a cut to the Reserve Requirement Ratio.
On top of this, the Australian federal government is tinkering with the stage three income take-cuts, which will boost the economy more than previously estimated by the RBA, and reduce the prospect of rate cuts in the second half of 2024.
This week's key local economic event for the AUD/USD will be Wednesday's December quarter (Q4) inflation data - one of the last pieces of data the RBA will receive before its first board meeting of 2024 on Tuesday, February 6th.
What is expected from Australia's December quarter (Q4) inflation data (Wednesday, January 31st at 11.30 am)
In the September 2023 quarter (Q3), headline inflation rose by 1.2%, up from 0.8% in the June quarter and above expectations for a 1.1% increase. Annual Trimmed mean inflation eased to 5.2%, from 5.9% in the June quarter, but it is still well above the RBA's 2-3% inflation target.
In the December quarter (Q4), headline inflation is expected to increase by 0.8% for an annual rate of 4.3%. The Trimmed mean is expected to rise by 0.9%, allowing the annual trimmed mean rate to ease to 4.3%. At this rate, inflation will be below the RBA's forecast of 4.5% (for trimmed mean) and support expectations of RBA rate cuts in the second half of 2024.
Australian trimmed mean inflation chart
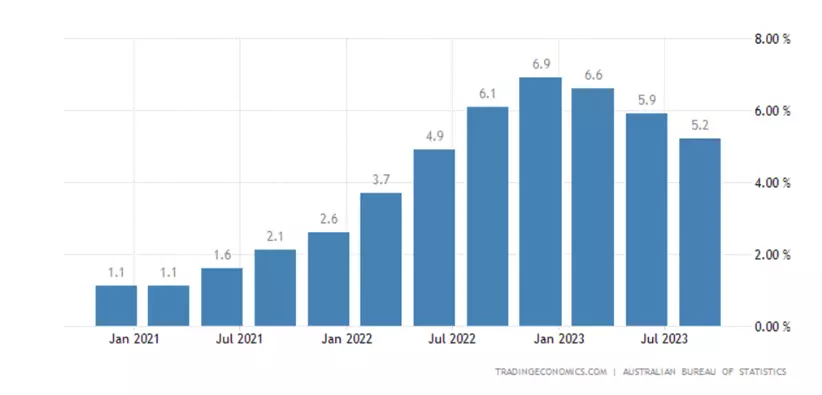 Source: TradingEconomics
AUD/USD technical analysis
Looking past the price action over the past eight sessions, which has seen the AUD/USD tightly pinned to the 200-day moving average at .6581.
From the October .6270 low to the December .6871 high, the AUD/USD gained just under 10% in two months. The rally unfolded in five waves (Elliott Wave), which suggests the pullback from the .6871 high is part of a correction rather than a reversal lower.
This view is supported by the AUD/USD continuing to hold above a strong layer of horizontal support at .6520/00, which includes the 61.8% Fibonacci retracement of the October to December rally at .6500c.
Therefore, leaning against support at .6520/00, a positive bias is in place, looking for a rebound initially towards resistance at .6700/25. The bullish view would increase in confidence on a daily close above recent highs in the .6620 area.
Aware that if a sustained break of .6520/00 were to occur, it would warn that a deeper decline is unfolding towards 6400c.
AUD/USD daily chart
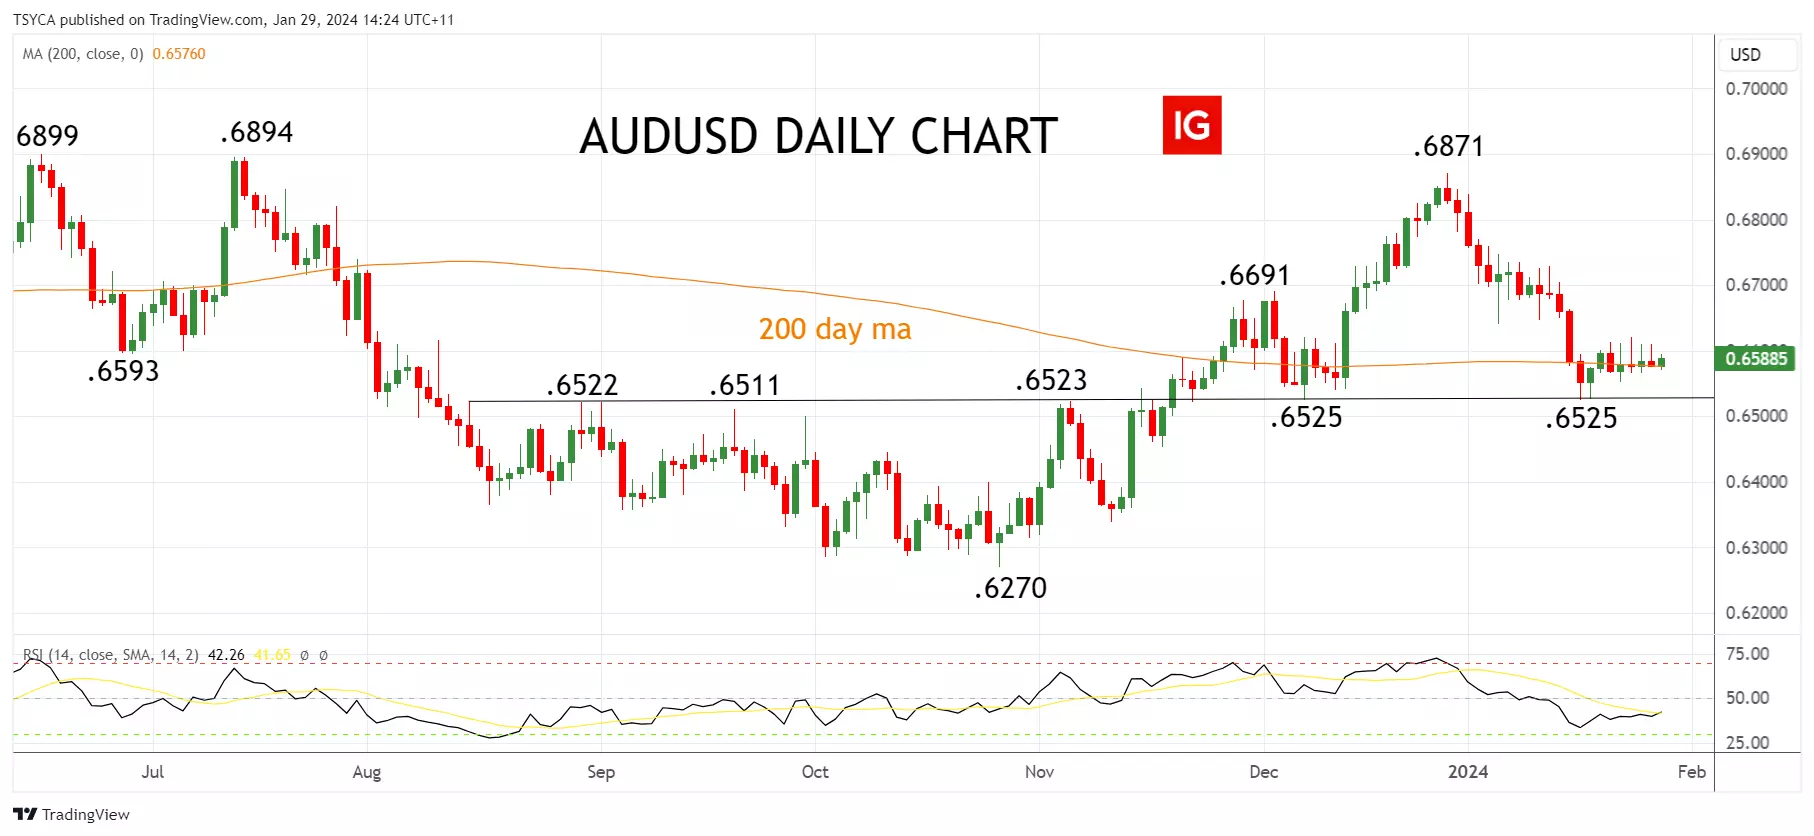 Source: TradingView
- Source: TradingView. The figures stated are as of 29 January 2023. Past performance is not a reliable indicator of future performance. This report does not contain and is not to be taken as containing any financial product advice or financial product recommendation.
This information has been prepared by IG, a trading name of IG Australia Pty Ltd. In addition to the disclaimer below, the material on this page does not contain a record of our trading prices, or an offer of, or solicitation for, a transaction in any financial instrument. IG accepts no responsibility for any use that may be made of these comments and for any consequences that result. No representation or warranty is given as to the accuracy or completeness of this information. Consequently any person acting on it does so entirely at their own risk. Any research provided does not have regard to the specific investment objectives, financial situation and needs of any specific person who may receive it. It has not been prepared in accordance with legal requirements designed to promote the independence of investment research and as such is considered to be a marketing communication. Although we are not specifically constrained from dealing ahead of our recommendations we do not seek to take advantage of them before they are provided to our clients.


IG Morning Call
in General Trading Strategy Discussion
Posted
Meta's announcement of its first dividend, and a $50 billion share buyback programme, provided a tonic for markets that had been wobbling after the Fed decision. Strong figures from Amazon helped too, helping to offset Apple, which dropped 3% on news of weak China revenue. The ASX 200 and Kospi both rose sharply overnight, with the Nikkei 225 seeing more muted gains. While the Hang Seng was flat, indices in mainland China dropped sharply again. Today's payrolls reading is expected to see job growth slow again, and the unemployment rate to rise. Given the Fed is on watch for any signs of weakening data, today's figures will prove crucial for near-term direction in indices and the US dollar.