

MongiIG
-
Posts
9,886 -
Joined
-
Last visited
-
Days Won
41
Content Type
Profiles
Forums
Blogs
Events
Community Tutorials
Store
Posts posted by MongiIG
-
-
Boosted by tech giants, the S&P 500 and Nasdaq reach new highs. Investors await crucial economic data, including Jan's inflation figures, to discern the US economy's trajectory and Feds' next steps amid a lively earnings season.
On Friday night, the S&P 500 and the Nasdaq hit new record highs, buoyed by mega-tech companies including Nvidia, Amazon, and Alphabet. The Nasdaq increased by 1.81% for the week and is up 6.75% CYTD (Calendar Year To Date). The S&P 500 closed 1.37% higher for the week, at a 5.38% increase CYTD, while the Dow Jones finished the week flat, up 2.61% CYTD.
Following a series of stronger-than-expected data this year, the Atlanta Fed's GDPNow forecast for Q1 predicts growth at 3.4%, prompting discussions on whether the US economy is slowing down or reaccelerating. Further insights will be provided by this week's key macroeconomic events, including inflation and retail sales reports for January and the Michigan Consumer Sentiment Index for February.
The economic calendar also includes eight Federal Reserve speaker events, and the Q4 earnings season continues with reports from companies such as Coca-Cola, Airbnb, Lyft, Cisco, Robinhood, AMD, Dropbox, and Coinbase.
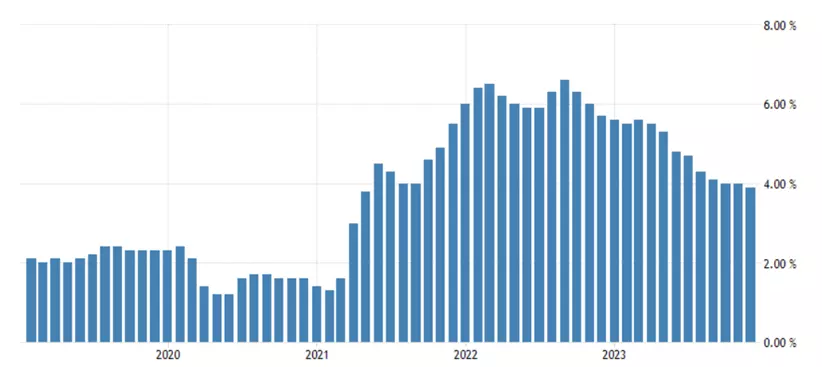
What is expected from January’s inflation report
Date: Wednesday, 14 February at 12.30am AEDT
With stronger-than-expected data and less dovish Federal Reserve commentary, the market has almost completely discounted the possibility of a Fed rate cut in March. However, around five rate cuts are still priced in for 2024 compared to the three cuts suggested by the Fed, largely based on the ongoing disinflationary trend.
The headline Consumer Price Index (CPI) is expected to rise by 0.2% in January, bringing the annual rate down to 2.9% YoY (Year on Year) from 3.4% previously. Core inflation is anticipated to increase by 0.3% MoM (Month on Month), which would see the annual core inflation rate ease to 3.7% from 3.9% YoY. The risk lies in potentially firmer-than-expected numbers.
US headline CPI chart
 Source: TradingEconomics
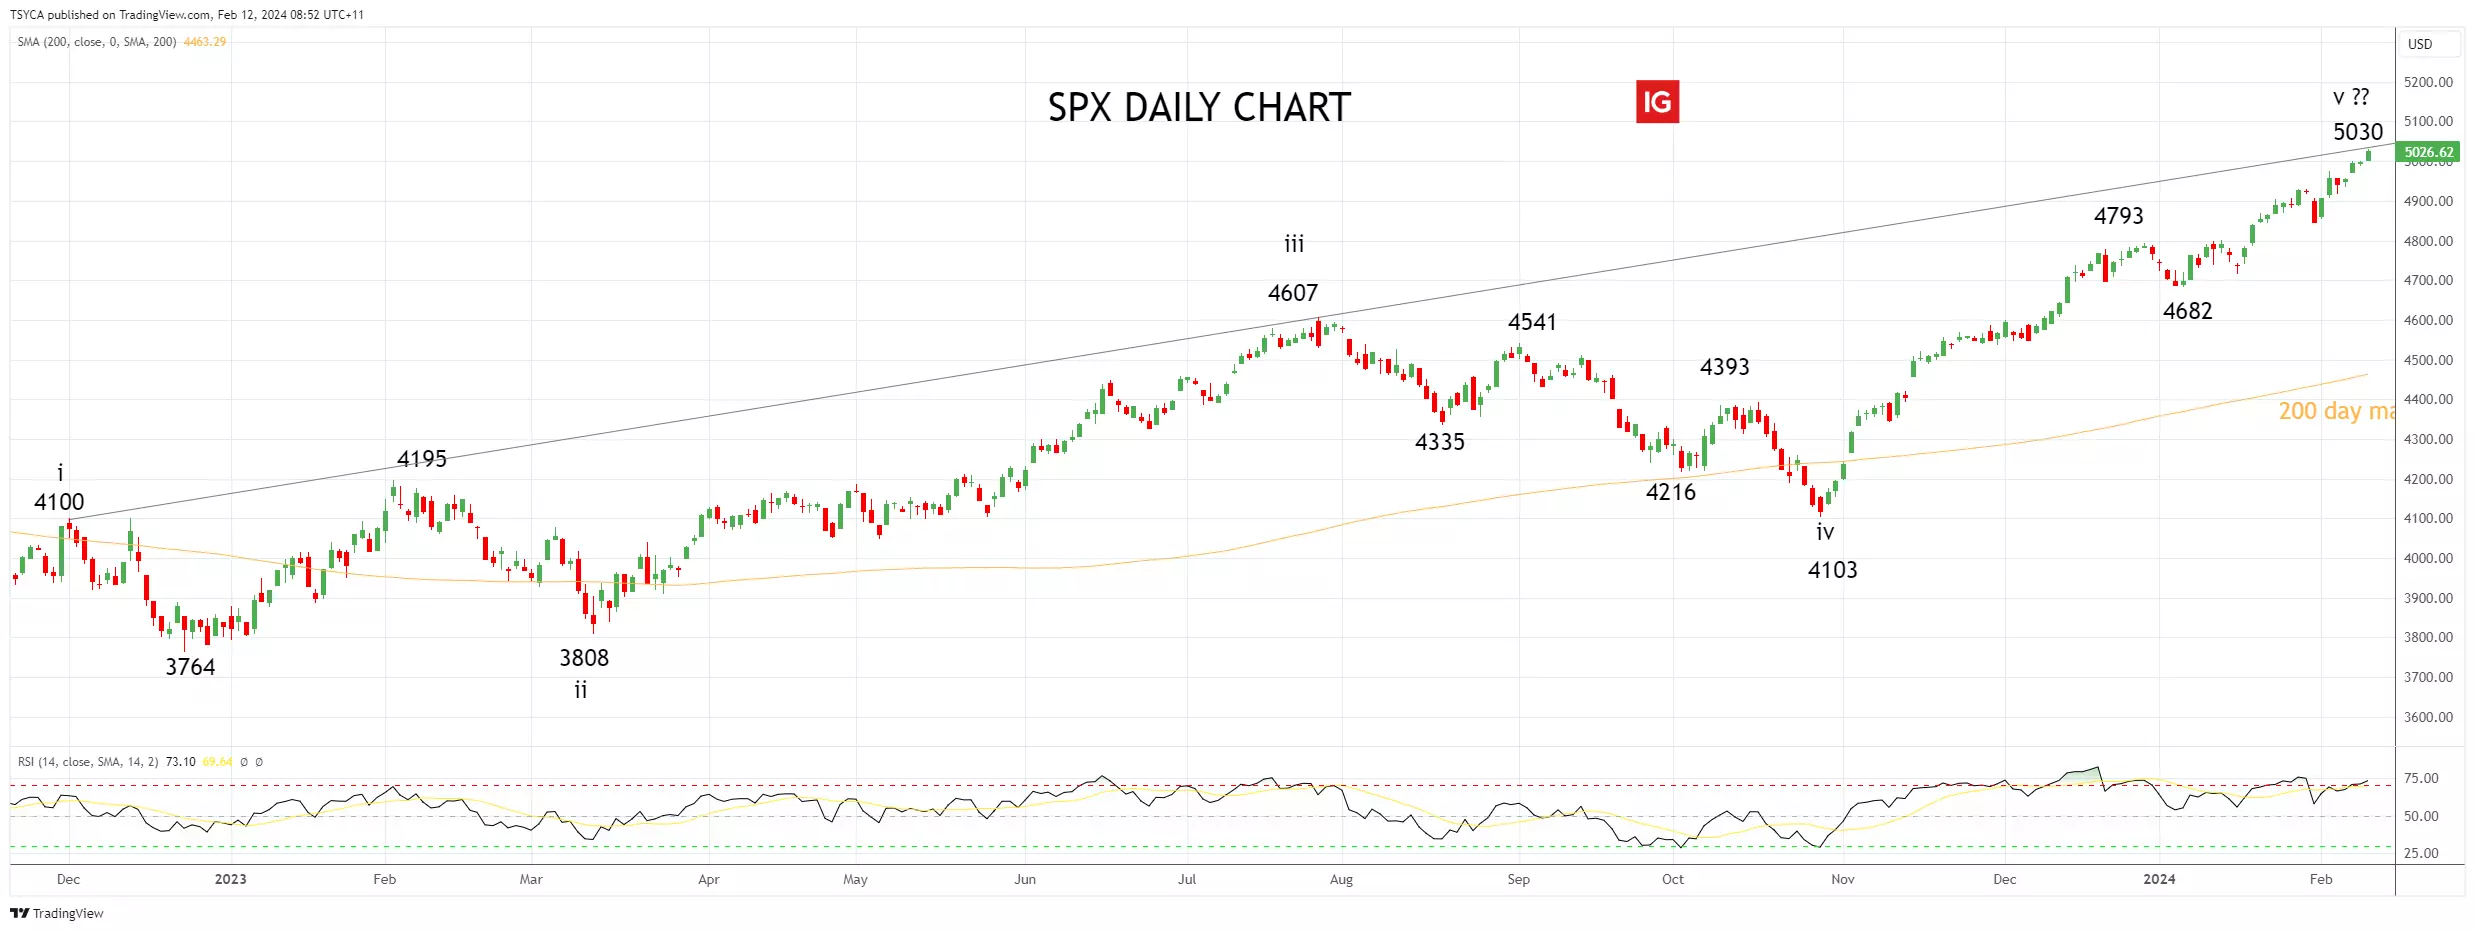
S&P 500 technical analysis
After capitalising on the strong rally in the S&P 500 at the end of 2023, we entered the New Year with a more cautious and neutral mindset—a stance that has not been rewarding as the mega-tech frenzy pushed the market higher.
Nonetheless, our assessment is that the S&P 500 is in the final stages (Wave V) of its rally from the low in October 2023, with continued evidence of bearish Relative Strength Index (RSI) divergence on the daily chart. Bearish RSI divergence occurs when prices hit new highs, but the RSI does not.
Moreover, the S&P 500 cash level has now encountered trendline resistance at 5030, drawn from the December 1st high of 4100, as shown in the chart below. Therefore, we are not inclined to pursue the market at these levels and maintain the perspective that a pullback is imminent.
S&P 500 daily chart
 Source: TradingView
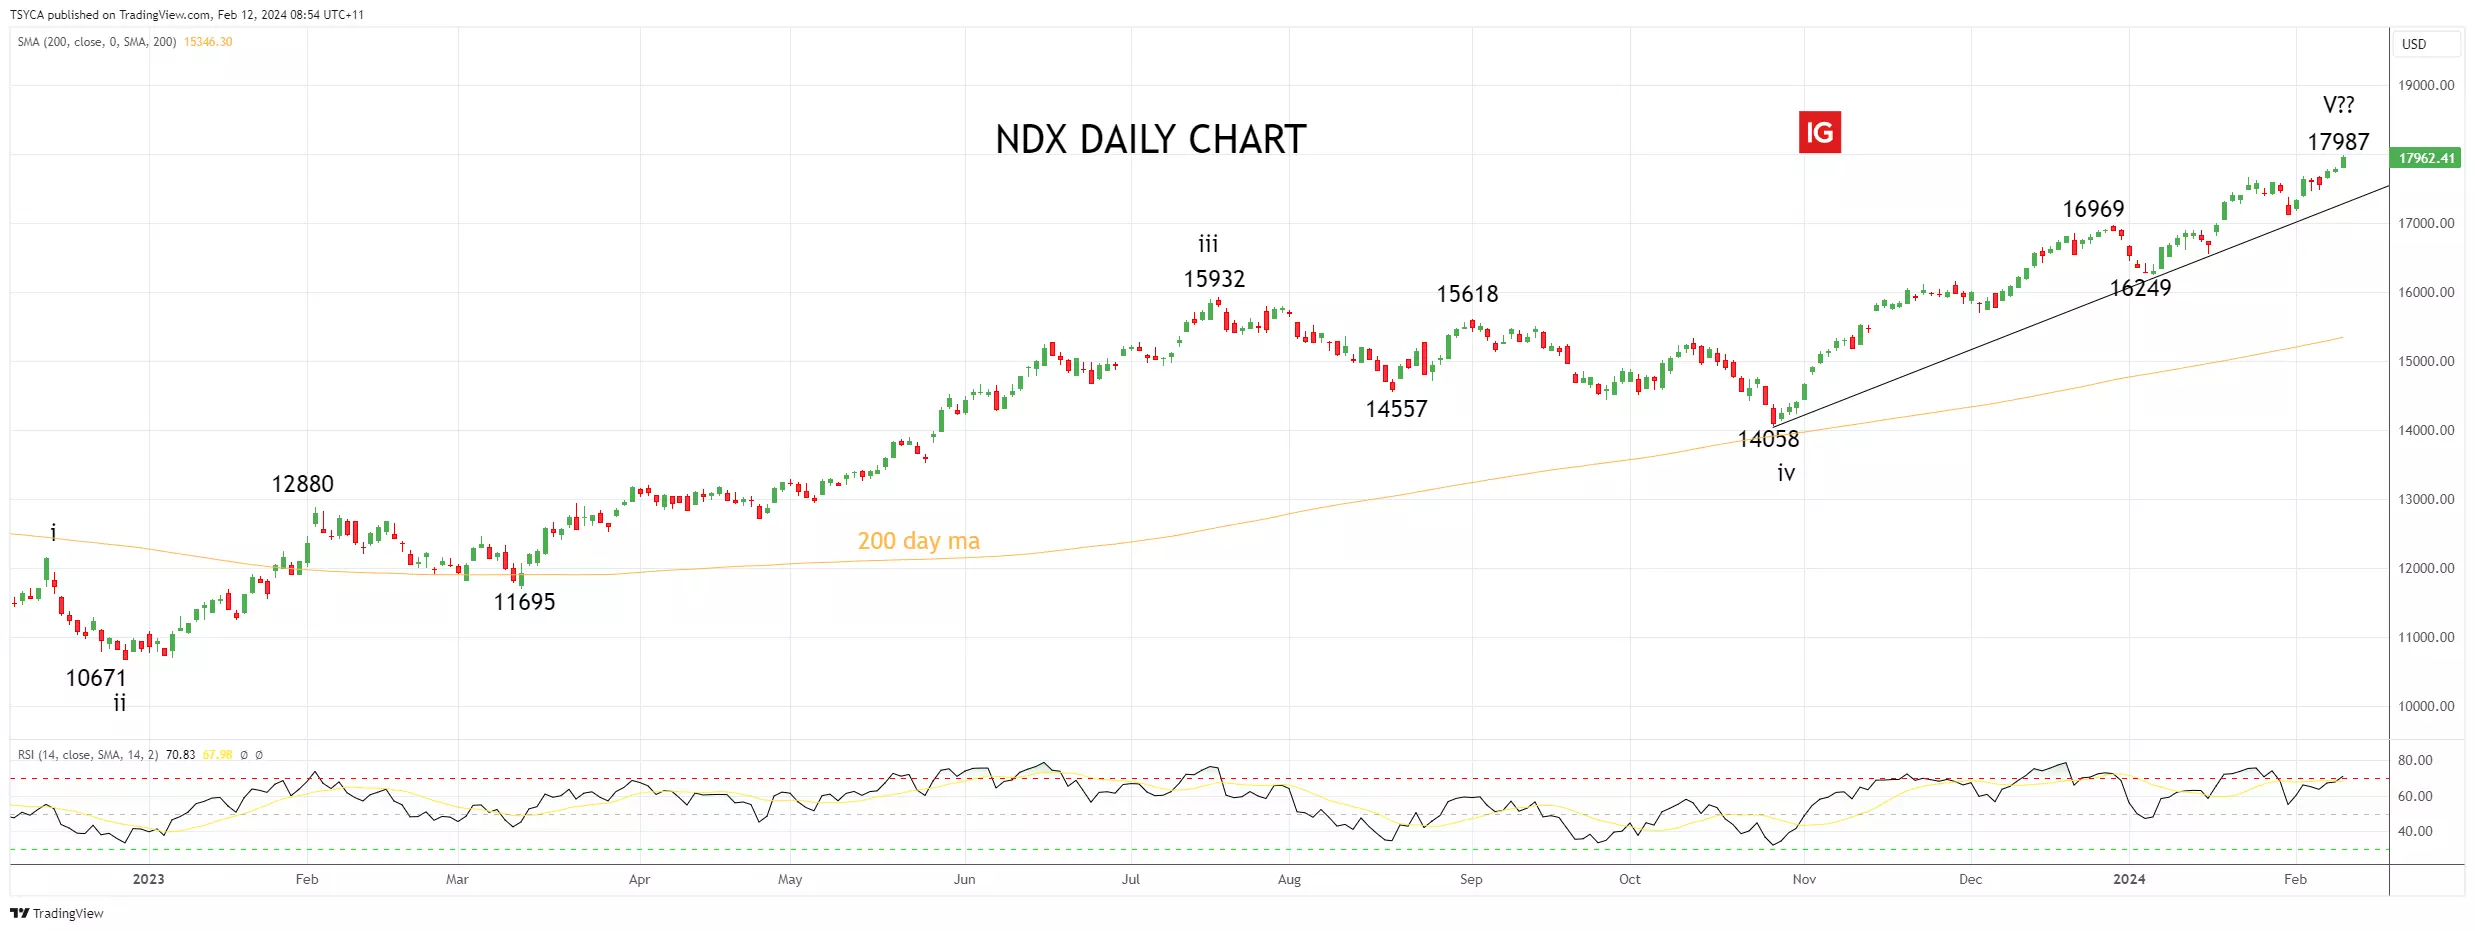
Nasdaq technical analysis
After witnessing the remarkable rally in US equity markets in the final months of 2023, we approached the new year with increased caution—a strategy that has not yielded expected returns as the Mega Tech frenzy propelled the market upwards.
Despite this, we maintain the perspective that the Nasdaq is approaching the final stages (Wave V) of its ascent from the low in October 2023. A decisive break or daily closure below the uptrend support at 17,300, originating from the October lows, would indicate that the Nasdaq has reached its peak and a more substantial retracement towards support levels at 16,200/16,000 could be imminent. Until such a break occurs, the Nasdaq's rally is likely to persist.
Nasdaq daily chart
 Source: TradingView
- Source:TradingView. The figures stated are as of 12 February 2023. Past performance is not a reliable indicator of future performance. This report does not contain and is not to be taken as containing any financial product advice or financial product recommendation.
This information has been prepared by IG, a trading name of IG Markets Limited. In addition to the disclaimer below, the material on this page does not contain a record of our trading prices, or an offer of, or solicitation for, a transaction in any financial instrument. IG accepts no responsibility for any use that may be made of these comments and for any consequences that result. No representation or warranty is given as to the accuracy or completeness of this information. Consequently any person acting on it does so entirely at their own risk. Any research provided does not have regard to the specific investment objectives, financial situation and needs of any specific person who may receive it. It has not been prepared in accordance with legal requirements designed to promote the independence of investment research and as such is considered to be a marketing communication. Although we are not specifically constrained from dealing ahead of our recommendations we do not seek to take advantage of them before they are provided to our clients. See full non-independent research disclaimer and quarterly summary.
-
Asian stocks saw a mixed performance, with the Nikkei 225 and ASX 200 flat, while mainland China indices saw strong gains and the Hang Seng suffered fresh losses. The Nikkei 225 crossed the 37,000 mark for the first time in 34 years, as a weak yen lifted exporter stocks, and the broader Topix index also made a new high. A quiet end to the week sees European futures pointing to a muted open, while crude oil is calm after a 3% gain yesterday. Markets face a light economic calendar, with just Canadian job numbers on the agenda for the session.

-
Apple, Amazon, Alphabet, Meta and Microsoft results have highlighted the growing importance of AI integration.
 Source: Bloomberg
Key Takeaways:
- Meta Platforms, Inc. (META) and Amazon.com, Inc. (AMZN) have surpassed market expectations with their quarterly earnings and outlooks
- Microsoft Corporation (MSFT) has posted its strongest revenue growth since 2022, thanks in part to the impressive performance of its Azure AI services, which continue to attract new customers.
- Apple Inc. (AAPL) has returned to revenue growth despite challenges in the Chinese market, while Tesla, Inc. (TSLA) faces concerns about the sustainability of its growth and the impact of price cuts on profit margins.
- Alphabet's enterprise cloud and workspace services have seen substantial adoption, but its ad revenue has not met expectations.
The current US reporting season has seen recent earnings releases from some of the biggest names in technology, namely: Apple, Amazon, Alphabet, Tesla, Meta and Microsoft. These companies make up six of the ‘magnificent seven’ tech shares, with the seventh (NVIDIA) still to report.
Meta, Microsoft and Amazon results impress
Meta Platforms, Inc. (META) and Amazon.com, Inc. (AMZN) have set a high bar with their quarterly earnings and outlooks surpassing market expectations. Meta has seen a substantial uplift in profitability, announcing its maiden dividend, a move that signals confidence in its long-term revenue streams. This comes on the heels of Meta incorporating advanced AI into its algorithms, enhancing ad targeting across its suite of social apps, which has led to increased ad impressions and a higher price per ad.
Microsoft Corporation (MSFT) has also been a standout, posting its strongest revenue growth since 2022. The tech behemoth's success is partially attributed to the impressive performance of its Azure AI services, which continue to attract new customers.
The enterprise business segments of these tech giants have been particularly robust, with corporate customers investing in cloud services, software platforms, and devices to enhance their operations. Microsoft and Amazon have benefited from their cloud offerings, with AWS experiencing a 13% growth in revenue and Microsoft's cloud business growing by 20%.
Apple and Tesla economic cautions
Despite a mixed global economic outlook, Apple Inc. (AAPL) has managed to return to revenue growth, although it has faced challenges in the Chinese market. Meanwhile, Tesla, Inc. (TSLA) has been a topic of intense debate, with concerns about the sustainability of its growth in the face of potential declines in electric vehicle demand and the impact of price cuts on profit margins.
Alphabet Ad revenue under pressure
Alphabet's enterprise cloud and workspace services have seen substantial adoption, although its ad revenue has not met expectations. Nonetheless, Alphabet's commitment to AI innovation remains steadfast, as evidenced by the development of its new AI model, "Gemini."
AI integration helping drive revenue
Similarly, to Microsoft’s’ success of its Azure AI services, Alphabet Inc. (GOOGL), through its subsidiaries Google Workspace and Google Cloud, and Amazon with its Amazon Web Services (AWS), have made significant strides by integrating AI-powered services, which have been instrumental in driving revenue.
The ongoing AI revolution is reshaping the tech landscape, with Meta, Microsoft, Amazon, Apple, Alphabet and NVIDIA at the forefront. Their strategic investments in AI have not only enhanced their product offerings but have also led to more efficient operations and new revenue opportunities. However, these companies may face more regulatory challenges regarding their AI and cloud partnerships.
This information has been prepared by IG, a trading name of IG Markets Limited. In addition to the disclaimer below, the material on this page does not contain a record of our trading prices, or an offer of, or solicitation for, a transaction in any financial instrument. IG accepts no responsibility for any use that may be made of these comments and for any consequences that result. No representation or warranty is given as to the accuracy or completeness of this information. Consequently any person acting on it does so entirely at their own risk. Any research provided does not have regard to the specific investment objectives, financial situation and needs of any specific person who may receive it. It has not been prepared in accordance with legal requirements designed to promote the independence of investment research and as such is considered to be a marketing communication. Although we are not specifically constrained from dealing ahead of our recommendations we do not seek to take advantage of them before they are provided to our clients. See full non-independent research disclaimer and quarterly summary.
-
Trading the trend: long USD/JPY
USD/JPY is seeing a minor retracement lower which could be used to enter a long trade in the direction of this year’s uptrend. We would thus like to go long USD/JPY with a stop loss below ¥145.90 and an upside target at ¥152.00.
Publication date:Previous Arabica coffee trading outcome
In this week's "Trading the trend" video, Axel Rudolph reflects on his recent trades and talks about their current positions. He started by betting on the price of Arabica coffee to go up. He entered the trade when the price was around 186 and watched it climb to 194. However, things took a turn and the price went down, causing them to sell at his entry level.
Current New York cotton futures trading progress
Next, he moves on to his current trade in New York cotton futures. He entered at about 85.70 and are currently making a profit. To protect his gains, he raised the level at which he would sell if the price goes down, so he doesn't lose anything. He has set his sights on a target price of 90, which he sees as a strong resistance level based on previous market behavior.
This week's trading opportunity
For his trade this week, he plans to jump on the upward trend of the USD/JPY. He sees a temporary drop in the price as an opportunity to buy. He bases his decision on the difference in interest rates between the US and the Bank of Japan. The Bank of Japan has a cautious approach, while the US is more optimistic. He believes the upward trend will continue in the upcoming days and weeks, particularly if the price breaks through recent highs between 148.80 and 18.90.
With all of this in mind, he suggests buying USD/JPY at its current price, and setting a level at which he would sell if the price drops further. He also set an upside target at around 152, meaning he expects the price to go up to that level. By carefully managing his trades and considering market trends, he aims to make successful trades and achieve profits.
This information has been prepared by IG, a trading name of IG Markets Limited. In addition to the disclaimer below, the material on this page does not contain a record of our trading prices, or an offer of, or solicitation for, a transaction in any financial instrument. IG accepts no responsibility for any use that may be made of these comments and for any consequences that result. No representation or warranty is given as to the accuracy or completeness of this information. Consequently any person acting on it does so entirely at their own risk. Any research provided does not have regard to the specific investment objectives, financial situation and needs of any specific person who may receive it. It has not been prepared in accordance with legal requirements designed to promote the independence of investment research and as such is considered to be a marketing communication. Although we are not specifically constrained from dealing ahead of our recommendations we do not seek to take advantage of them before they are provided to our clients. See full non-independent research disclaimer and quarterly summary.
-
Overnight, stocks in the Asia-Pacific region were mixed following the fresh record levels seen on Wall Street, where the S&P 500 came within a whisker of 5000, though the Nikkei 225 managed a 2% gain. Soft Chinese data ahead of the Lunar New Year holiday kept sentiment in check overall. The Reserve Bank of India (RBI) kept the Repurchase Rate unchanged at 6.50%, as expected, and maintained its stance of remaining focused on the withdrawal of accommodation. European equity futures are indicating a slightly higher open, taking their cue from a positive session on Wall Street. US jobless claims are the main event scheduled for today.
-
-
Embark on a captivating journey with us in the next installment of our Sentiment Study series, as we delve into the intriguing worlds of the FTSE 100 and the DAX 40—also known as the Germany 40 in IG's trading realm.
Today, we're peeling back the layers of market sentiment to reveal a fascinating contrast: a prevailing inclination towards bullish positions among IG's clients in one index, juxtaposed with a strategic dance of range-trading in the other.
As we navigate through this tale of two indices, we'll uncover the underlying currents that drive investor behavior and market dynamics. Join us as we dissect the reasons behind the steadfast confidence in one market and the cautious maneuvering in another, offering you a richer understanding and sharper insights to refine your trading strategy.
This information has been prepared by IG, a trading name of IG Australia Pty Ltd. In addition to the disclaimer below, the material on this page does not contain a record of our trading prices, or an offer of, or solicitation for, a transaction in any financial instrument. IG accepts no responsibility for any use that may be made of these comments and for any consequences that result. No representation or warranty is given as to the accuracy or completeness of this information. Consequently any person acting on it does so entirely at their own risk. Any research provided does not have regard to the specific investment objectives, financial situation and needs of any specific person who may receive it. It has not been prepared in accordance with legal requirements designed to promote the independence of investment research and as such is considered to be a marketing communication. Although we are not specifically constrained from dealing ahead of our recommendations we do not seek to take advantage of them before they are provided to our clients.
-
The US dollar eases after strong payroll and ISM services PMI data suggest economic resilience, potentially delaying Fed rate cuts.
 Source: Bloomberg
Economic data and Fed speakers to provides tailwind for the dollar
The dollar is slightly softer at the time of writing, but is coming off a massive two-day advance after Friday’s non-farm payroll report revealed a significant beat to the upside. The labour market not only looks robust but appears to be in the ascendancy, after the December figure received a massive revision higher.
Further evidence of a resilient economy, despite restrictive monetary policy, appeared via the ISM services PMI readings below. The headline reading beat the forecast of 52 as well as the prior 50.5, continuing the expansion in the services sector for 13 straight months now.
 Source: DailyFX
Some of the more interesting stats appear within the sub-sections of the report like ‘new orders’, ‘prices’ and ‘imports’ which all saw notable improvements. New orders is often used as a proxy for future economic conditions; the increase in prices suggests increased costs of shipping in the Red Sea is being passed down to the consumer. Imports posted the largest month-on-month percentage change of all the categories, and suggests consumption and spending are strong.

In addition, a lesser observed report called the Senior Loan Officer Survey (SLOOS) revealed that credit providers are less reluctant to extend credit (greater supply) while demand for credit made marginal progress. The report was a main focus around the time of the regional banking instability and has come back onto the radar again after New York Community Bancorp had to cut its dividend – sending other regional bank shares lower with it.
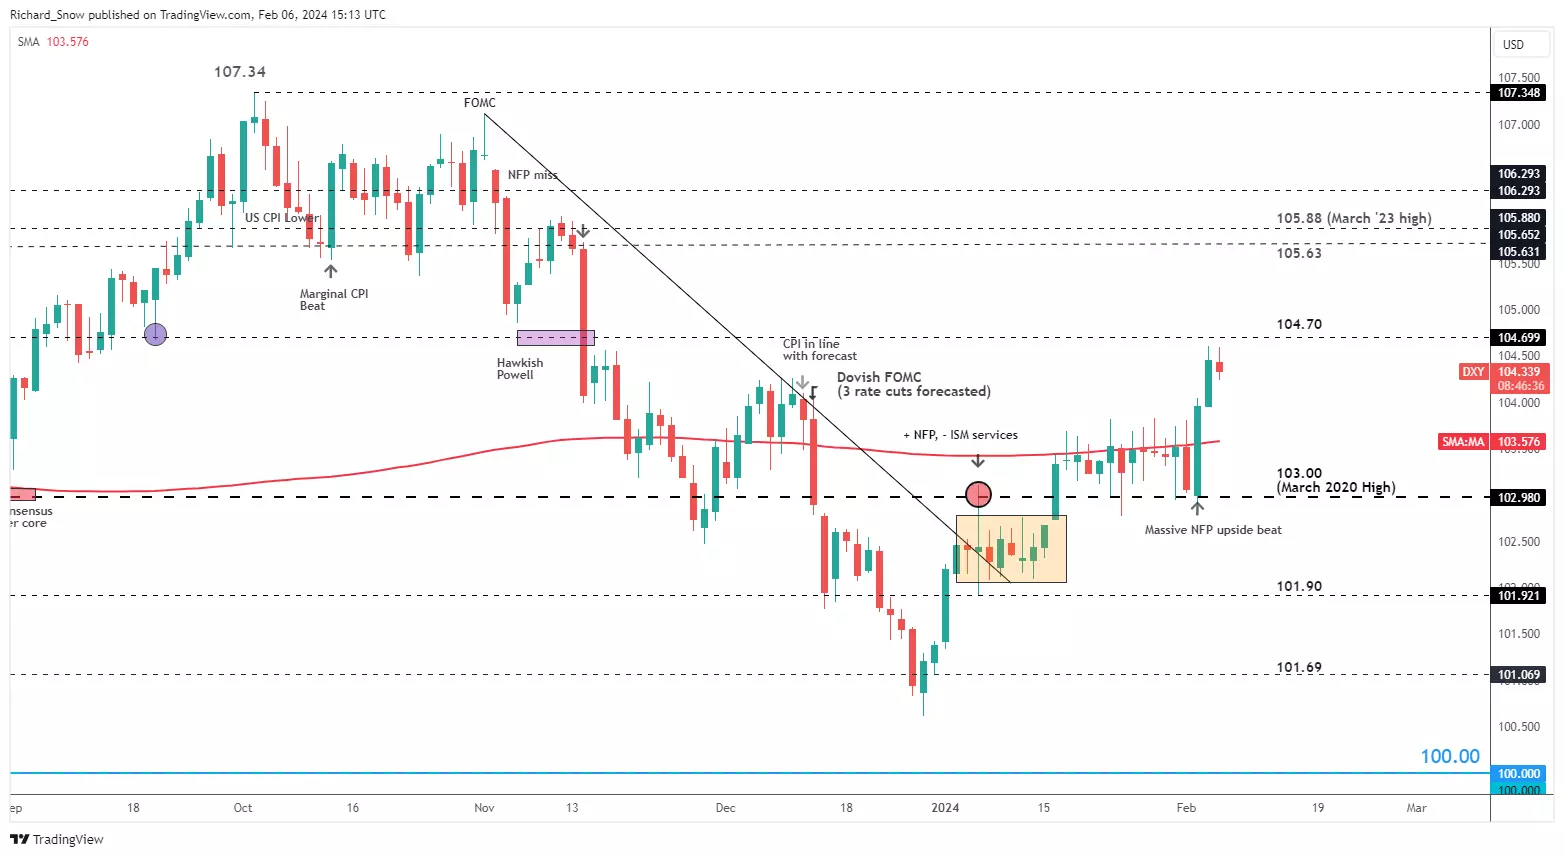
Economic strength defies interest rate pressures, influencing Fed decisions and dollar dynamics
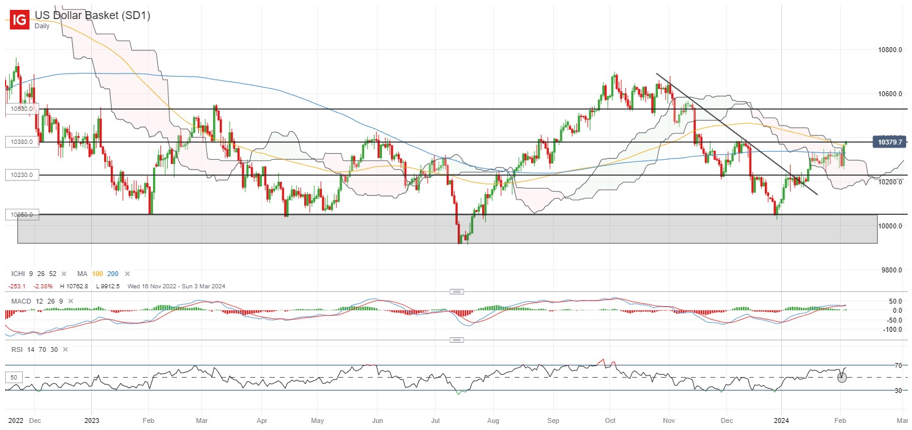
The above data is not consistent with an economy that ought to be constrained by elevated interest rates – suggesting that the start of rate cuts may need to be pushed back even further. As such, US yields and the dollar have risen in recent sessions.The dollar basket (DXY) is viewed as a benchmark of broader dollar performance and witnessed massive gains on Friday, which continued into Monday. Today however, prices have eased back a tad, ahead of the 104.70 level which has acted as support in September and November 2023.
The Fed’s very own Neel Kashkari seemed surprised at the US economy’s strength, suggesting that the current level of interest rates is not having as much of an impact as would typically be the case if the neutral rate hadn’t been shifted higher. The neutral rate is a theoretical rate that is neither restrictive of supportive to the economy and is said to be higher in the post-Covid period.
Price action remains above the 200-day simple moving average and could continue with the help of additional Fed speakers who are lined up today to provide their thoughts on monetary policy and interest rates. Further talk about the impressive economic data and the need to move cautiously before deciding to cut rates could add to the recent USD advance.
US dollar basket (DXY) daily chart
This information has been prepared by IG, a trading name of IG Australia Pty Ltd. In addition to the disclaimer below, the material on this page does not contain a record of our trading prices, or an offer of, or solicitation for, a transaction in any financial instrument. IG accepts no responsibility for any use that may be made of these comments and for any consequences that result. No representation or warranty is given as to the accuracy or completeness of this information. Consequently any person acting on it does so entirely at their own risk. Any research provided does not have regard to the specific investment objectives, financial situation and needs of any specific person who may receive it. It has not been prepared in accordance with legal requirements designed to promote the independence of investment research and as such is considered to be a marketing communication. Although we are not specifically constrained from dealing ahead of our recommendations we do not seek to take advantage of them before they are provided to our clients.
-
Gold prices are in the green after two days of big falls; last week’s news of US labor market strength continues to weigh. However, falls have been more limited than other assets.
 Source: Bloomberg
IG AnalystPublication date:
Source: Bloomberg
IG AnalystPublication date:Gold prices have managed some modest gains on Tuesday, after a punishing few sessions, courtesy of the United States’ labor market and the Federal Reserve.
Last week’s news of astonishing job creation has seen interest-rate-cut bets taken off for March, although a May move remains very much in play. This will hugely benefit the dollar.
The prospect of US borrowing costs remaining higher for longer has taken a clear, obvious toll on gold - in a double whammy for the metal. It suffers once by virtue of being non-yielding; and then again thanks to the fact that so many gold products are priced in US dollars, so more expensive for everyone trying to pay for them with other currencies.
It’s notable, however, that gold has suffered rather less from last week’s play than some other assets (such as sterling). The current broad market scene still offers perceived haven assets like the precious metal plenty of support. After all investors are fretting the prospect of a tougher battle against inflation and a broad spectrum of geopolitical risk from Gaza, the Red Sea, Ukraine, the South China Sea and so on. China’s economic underperformance is also simmering away.
Given all of that, it’s perhaps not too surprising that prices have remained above the important $2000/ounce level, even as the dollar’s strength has brought that level rather closer to the market.We’re heading into a rather quieter period of scheduled economic data, which will leave gold prices in thrall to general market risk appetite and, in all likelihood, whatever coming individual Fed speakers have for the market.
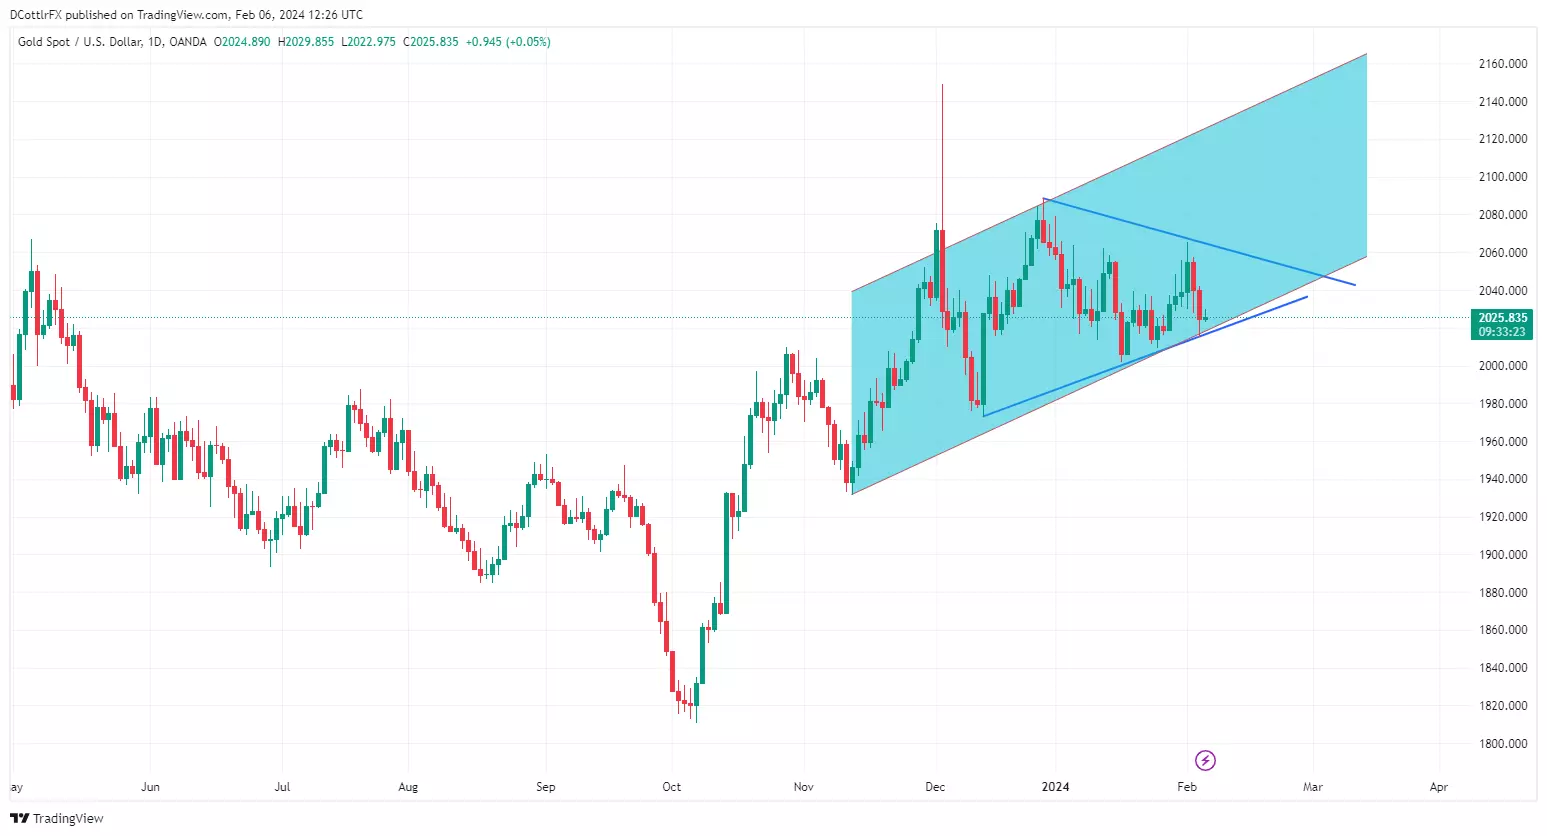
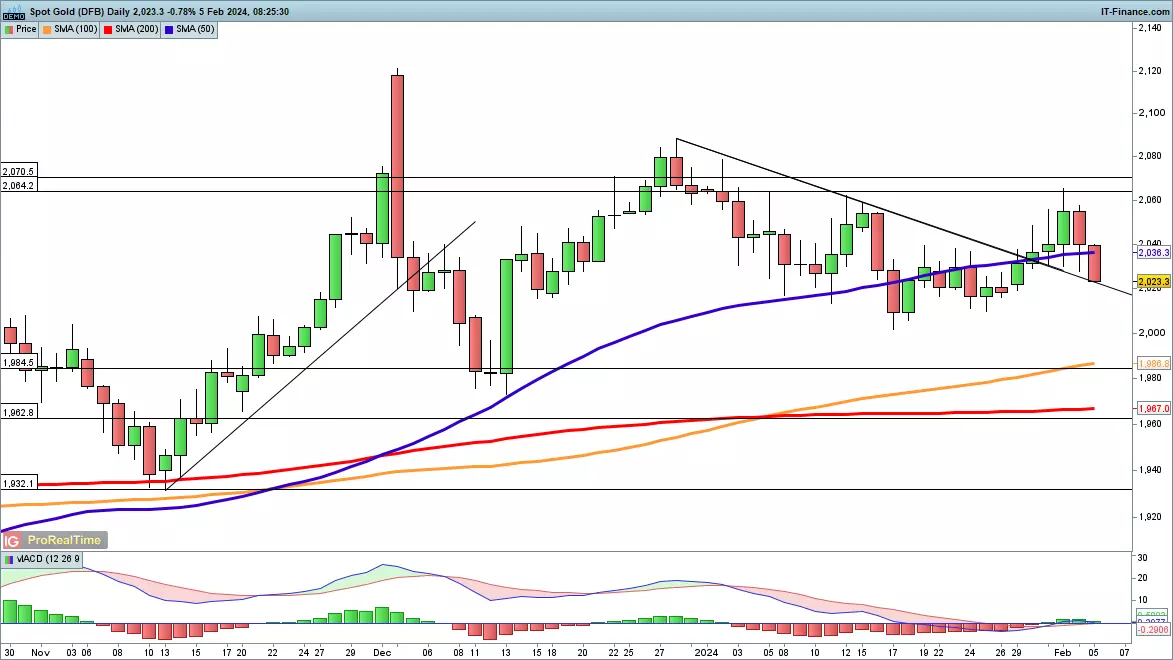
Gold prices technical analysis
Prices are once again testing the bottom of their wide, dominant uptrend channel from mid-November, an extension of the gains made since early October’s lows.
The tell-tale higher highs and higher lows of a ‘pennant’ formation are also visible on the daily chart. As a continuation pattern this ought perhaps to indicate that prices will begin to rise again once it plays out, as they did before, but there’s obviously no guarantee they will.
For now, the uptrend channel offers support at $2030.25 level, with 17 January’s intraday low of 1972.88 lying in wait should that give way. A conclusive break of the uptrend, however, might mean a deeper retracement. Near-term resistance is at 2 February’s top of $2056.96 ahead of trendline resistance at $2063.84.
IG’s own sentiment data on gold is mixed, but, with 64% of traders coming to the metal from the bullish side, enough to suggest that the market is looking for modest gains at current levels.
Gold price daily chart
 Source: TradingView
This information has been prepared by IG, a trading name of IG Australia Pty Ltd. In addition to the disclaimer below, the material on this page does not contain a record of our trading prices, or an offer of, or solicitation for, a transaction in any financial instrument. IG accepts no responsibility for any use that may be made of these comments and for any consequences that result. No representation or warranty is given as to the accuracy or completeness of this information. Consequently any person acting on it does so entirely at their own risk. Any research provided does not have regard to the specific investment objectives, financial situation and needs of any specific person who may receive it. It has not been prepared in accordance with legal requirements designed to promote the independence of investment research and as such is considered to be a marketing communication. Although we are not specifically constrained from dealing ahead of our recommendations we do not seek to take advantage of them before they are provided to our clients.
-
Overnight, stocks in Asia were mostly positive following a decline in global yields and additional support efforts from China. However, the Hang Seng and Shanghai Composite saw early momentum fade, as doubts persisted over the abilities of the authorities to power a sustainable rally. FOMC member Mester said that the Fed could lower interest rates later this year if the economy performs as expected. She also mentioned that any rate cuts would likely be implemented gradually, without providing a specific timeline. The line from the ECB continues to be more hawkish, with German member Schnabel saying that a too-hasty move to cut rates could lead to a revival in inflation. Uber, Disney and PayPal earnings are expected today, while just EIA crude oil inventories are on the calendar for economic data.
-
The Reserve Bank of Australia (RBA) joined in the cautious line from central banks, pushing back against expectations of imminent rate cuts. While policy was left unchanged, the RBA did note that inflation was easing. However, it also lowered its near-term outlook for growth due to a weaker consumer spending forecast. Chinese markets enjoyed a solid session, which saw the Hang Seng gain 3.8%, the Shanghai composite rise 2.7% and the Shenzhen composite gain a remarkable 6.3%. Chinese regulators said that they would guide institutional investors to raise stock investments, and also encourage listed companies to raise their level of share buybacks, moves which follow on from the decision to shore up the market with $17 billion last week. A quieter day on the economic front lies ahead, though earnings from Ford will be of interest.

-
The Magnificent Seven – Apple, Alphabet, Amazon, NVIDIA, Microsoft, Meta Platforms, Tesla – individually soared between around 50% and 240% in 2023. But are they still a buy? Should you cherry pick, or are they looking risky?
Publication date:The outlook of the Magnificent Seven in 2024
In 2023, a group of seven influential companies, known as the Magnificent Seven, had a big impact on the market. These companies include Microsoft, Meta Platforms, Tesla, Apple, Alphabet, Amazon, and NVIDIA. Now, after their earnings reports, investors are wondering if these companies are still a good investment.
Amazon
Let's start with Amazon. Their shares went up after a strong performance in the December quarter. They surpassed revenue expectations, especially in online spending during the important holiday season.
Alphabet
On the other hand, Alphabet, the parent company of Google, disappointed investors with lower sales than expected in holiday season advertising. They also announced that they would be spending more on AI infrastructure, which raised concerns about costs.
Microsoft
Microsoft did better than expected in terms of profit and revenue. However, investors started to question whether the money they were putting into AI would pay off in the long run. Despite that, Microsoft's new AI features have been attracting customers to their Azure cloud services.
Meta
Meanwhile, Facebook reached a record high in its stock price and is now valued at around $1.1 trillion. Their revenue also increased by 25% due to strong advertising and device sales.
Apple
Apple had some challenges in China as their sales in the country fell short of estimates. This disappointment caused a decline in Apple's stock price. They also faced tough competition in China as they released their Vision Pro.
Tesla
Lastly, Tesla had a major setback. Their shares dropped to the lowest point in eight months, leading to a loss of about $80 billion in market value. This drop came after Elon Musk warned of slower growth in 2024.
In conclusion
Given these circumstances, investors might choose to take their profits and diversify their investments. However, some argue that these companies have become safe bets because of their large size, making them less likely to fail. Ultimately, the decision to buy, hold, or sell stocks from these companies depends on each individual's perspective and investment strategy.
This information has been prepared by IG, a trading name of IG Markets Limited. In addition to the disclaimer below, the material on this page does not contain a record of our trading prices, or an offer of, or solicitation for, a transaction in any financial instrument. IG accepts no responsibility for any use that may be made of these comments and for any consequences that result. No representation or warranty is given as to the accuracy or completeness of this information. Consequently any person acting on it does so entirely at their own risk. Any research provided does not have regard to the specific investment objectives, financial situation and needs of any specific person who may receive it. It has not been prepared in accordance with legal requirements designed to promote the independence of investment research and as such is considered to be a marketing communication. Although we are not specifically constrained from dealing ahead of our recommendations we do not seek to take advantage of them before they are provided to our clients. See full non-independent research disclaimer and quarterly summary.
-
While oil prices have been steadier, BP is expected to report a weaker performance at its upcoming quarterly results.
 Source: Bloomberg
BP earnings – what to expect?
BP's underlying adjusted net income for the fourth quarter (Q4) is expected to decrease to $3 billion, according to consensus estimates. The company′s adjusted cashflow is projected to be around $6 billion.
The key drivers of performance in the Q4 include relatively stable oil and gas prices, as well as softer global refining margins. Gas trading may continue to be weak due to low volatility in the market.
In terms of financial decisions, BP is likely to maintain buybacks at $1.5 billion in the Q1. The dividend could see a small increase after a 10% raise in the first half of 2023, bringing it to 7.27 cents.
BP's balance sheet is expected to show net debt in the range of $22 billion, with a leverage ratio of 20% based on IAS-17 accounting standards.
High upstream production to aid performance
The company's resilience is particularly noteworthy, as recent operations suggest that BP is poised to achieve its highest upstream production in the Q4, with over 2.3 million barrels of oil equivalent per day. This robust production level is a testament to BP's robust operational capabilities and strategic positioning in the face of a broadly stable commodity-price environment.
While full inventories and a flat market structure have indicated a potential for underwhelming gas-trading gains, it's important for traders to consider the broader context. Low volatility, although presenting challenges in trading, can also offer a stable ground for strategic decision-making and long-term investments. However, the potential unknown swing factor in this equation is oil trading, which could significantly impact BP's financial performance depending on market movements and company trading strategies.
On the downstream front, BP is confronted with a sharply lower refining margin and availability, which contrasts with the previous quarter where these factors provided a substantial offset for earnings weaknesses. This shift underscores the importance of diversification within a company's portfolio—a lesson for traders who similarly seek to balance their investments to mitigate risks.
New CEO on the cards
As for leadership, the market is anticipating the conclusion of BP's CEO search. The likelihood of interim CEO Murray Auchincloss being appointed as the permanent CEO represents continuity and stability for the company. Auchincloss, already familiar with BP's operations and strategy, is expected to maintain the current course rather than introducing radical changes.
For traders, the potential appointment of Auchincloss should be seen as a signal of steady leadership, which could translate into continued resilience and reliability in BP's performance. This is an essential factor to consider when evaluating BP's stock for one's portfolio.
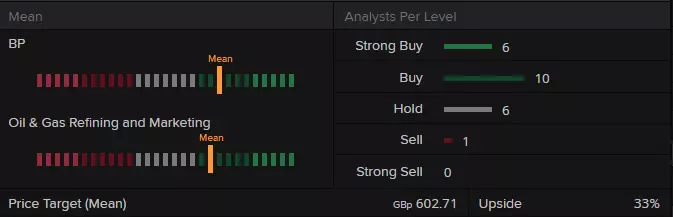
Analyst ratings for BP
Refinitiv data shows a consensus analyst rating of ‘buy’ for BP with 6 strong buy, 10 buy, 6 hold and 1 sell – and a mean of estimates suggesting a long-term price target of 602.71 pence for the share, roughly 33% higher than the current price (as of 5 February 2024).
 Source: Refinitiv
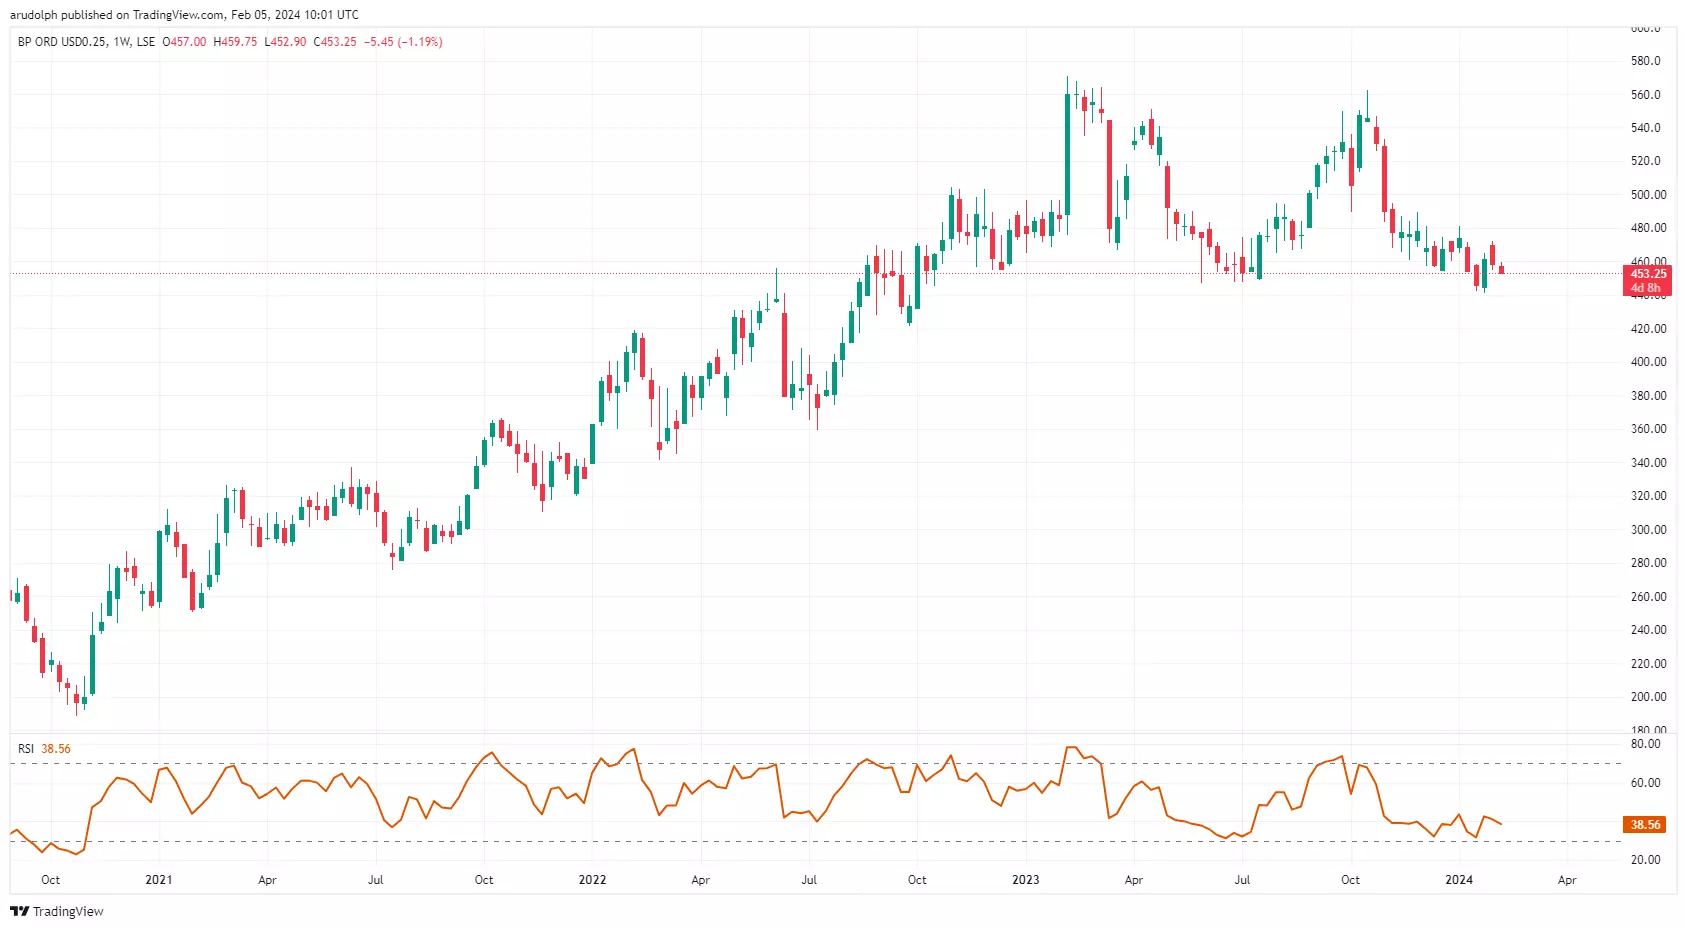
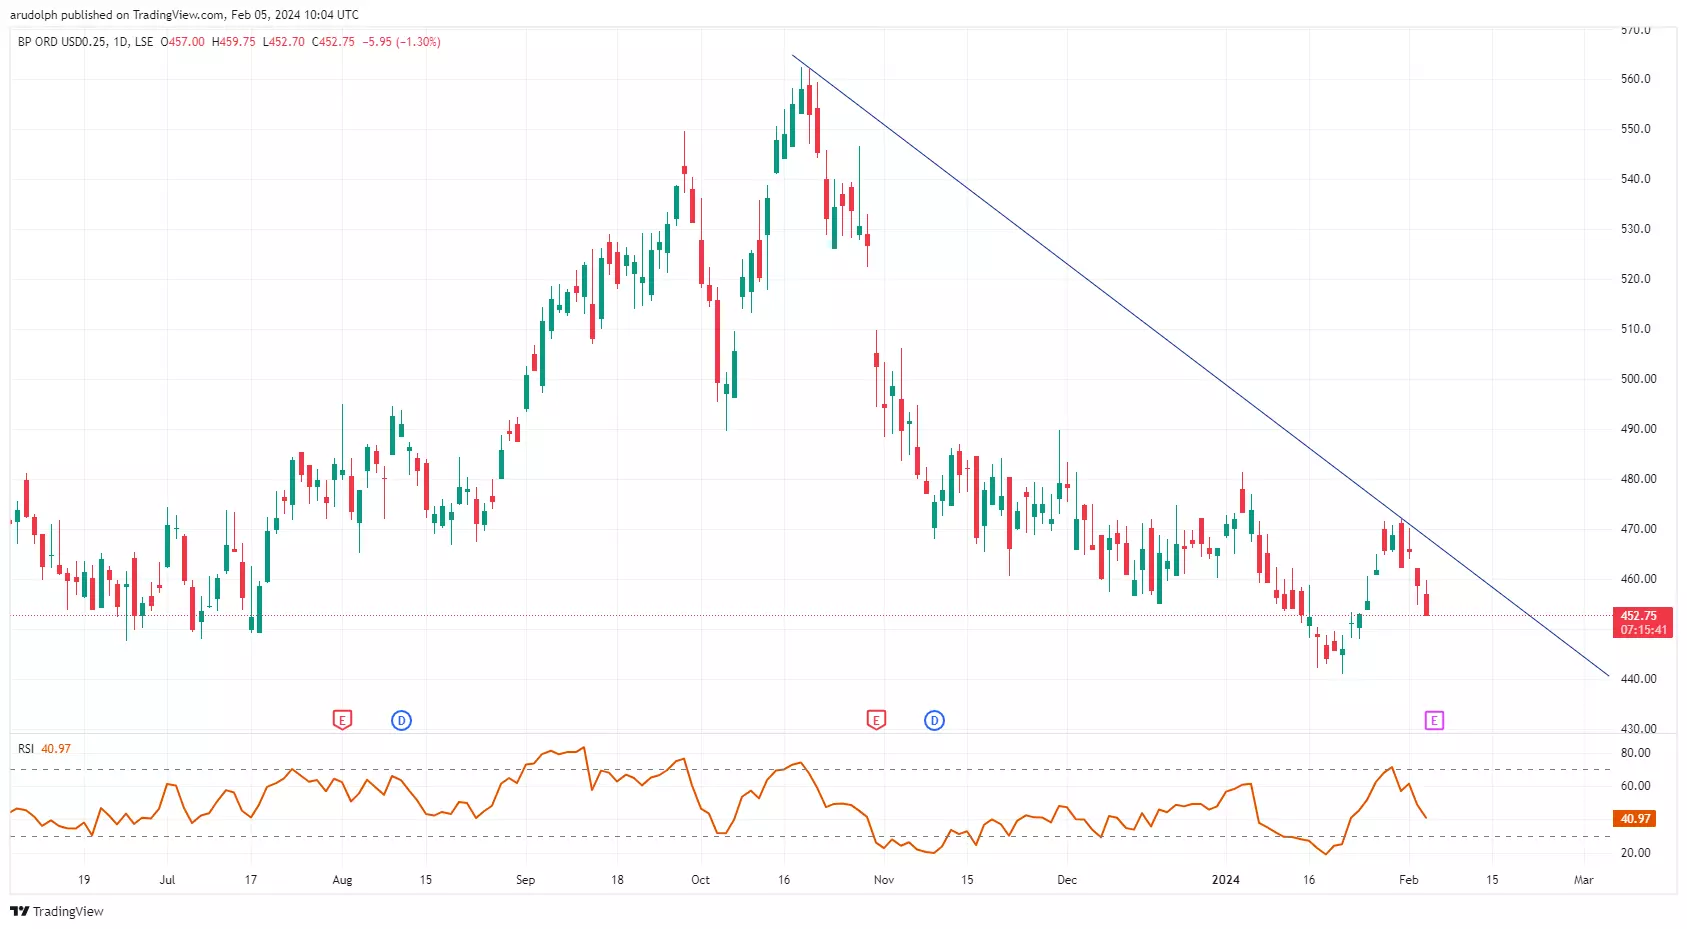
Technical outlook on the BP share price
BP’s share price, which recovered from its January 15-month low at 441.05 pence low, only managed to rise to last week’s high at 471.90p before resuming its descent towards the key long-term 455.00p to 441.05p support zone.
BP Weekly Candlestick Chart
 Source: TradingView
The decline in the BP share price from its October 2023 peak at 562.3p remains firmly entrenched and will continue to do so as long as no bullish reversal takes it above its early January high at 481.40p.
BP Daily Candlestick Chart
 Source: TradingView
A drop through the 441.05p January low would open the way for the February 2022 high and the September 2022 low at 421.10p to 419.15p to be reached.
This information has been prepared by IG, a trading name of IG Markets Limited. In addition to the disclaimer below, the material on this page does not contain a record of our trading prices, or an offer of, or solicitation for, a transaction in any financial instrument. IG accepts no responsibility for any use that may be made of these comments and for any consequences that result. No representation or warranty is given as to the accuracy or completeness of this information. Consequently any person acting on it does so entirely at their own risk. Any research provided does not have regard to the specific investment objectives, financial situation and needs of any specific person who may receive it. It has not been prepared in accordance with legal requirements designed to promote the independence of investment research and as such is considered to be a marketing communication. Although we are not specifically constrained from dealing ahead of our recommendations we do not seek to take advantage of them before they are provided to our clients. See full non-independent research disclaimer and quarterly summary.
-
Stronger US dollar sinks gold, WTI and silver prices
Friday’s impressive US jobs report gave the dollar a big lift, while putting fresh pressure on commodity prices.
 Source: Bloomberg
Gold goes into reverse
Friday’s strong payroll report bolstered the dollar and hit gold, though it managed to hold its ground above the 50-day simple moving average (SMA). However, it is a different story this morning. The price has fallen sharply in early trading and is now back below the 50-day SMA. It is testing previously-broken trendline resistance from the late December high. If this holds, then buyers will need to push the price on above $2060 to signal a renewed bullish outlook. Conversely, further declines below the mid-January low at $2000 will open the way to the 100-day SMA, and then to the early December low around $1975.
 Source: ProRealTime
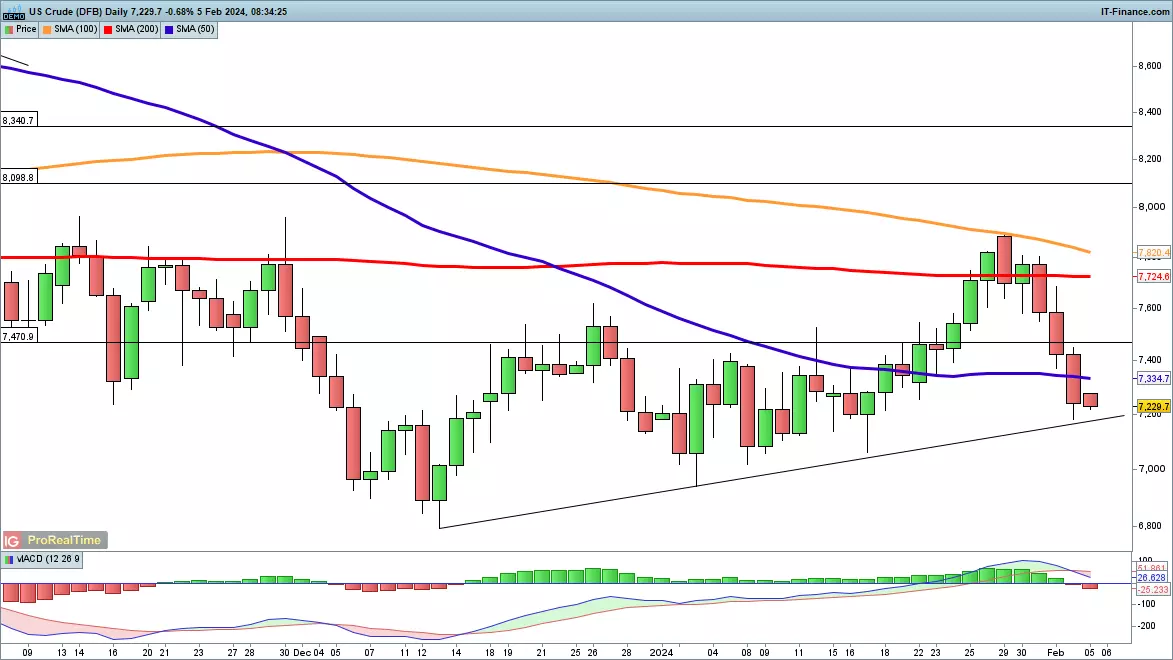
WTI pullback reaches trendline support
Friday’s sharp losses built on the existing weakness in oil prices, and took WTI back below the 50-day SMA. This has reversed almost all of the bounce seen since mid-January, and fresh losses appear to beckon. This then takes the price on towards $70.45, an area of support during the first half of January. Below this lies the lows of December around $68.40. Buyers will need a recovery above $74 to suggest that a low has formed for now. One hope for a recovery remains in the form of potential trendline support from the December low.
 Source: ProRealTime
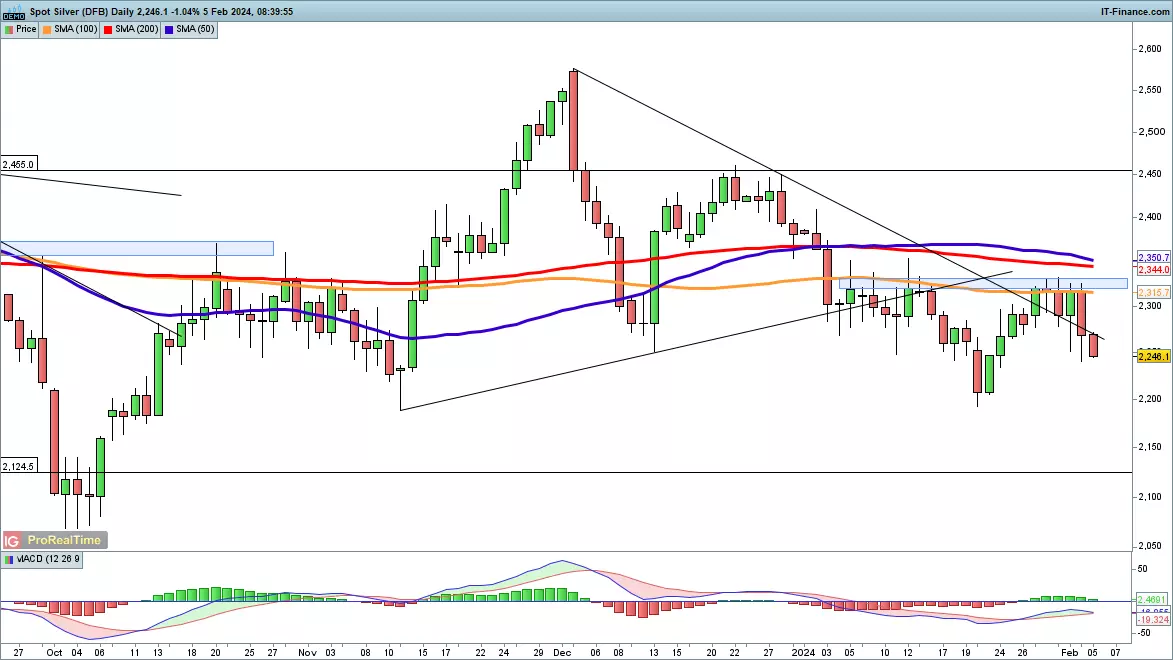
Silver price slump intensifies
Silver prices suffered a reverse on Friday, and have taken further losses this morning, like gold. Having rallied from their mid-January low, the price hit resistance around $23.25 as they did earlier in January. A turn lower has taken the price back below trendline resistance from early December, and now a move to the $22 low of January. Notably, this was also the low from mid-November, before the price began its sharp ascent into the December high. A close below these lows could see further losses towards October’s bottom around $20.80.
 Source: ProRealTime
-
FTSE 100, DAX 40 side-lined while S&P 500 trades in record highs
Outlook on FTSE 100, CAC 40 and S&P 500 as major company earnings by the ‘magnificent seven’ are out of the way.
 Source: Bloomberg
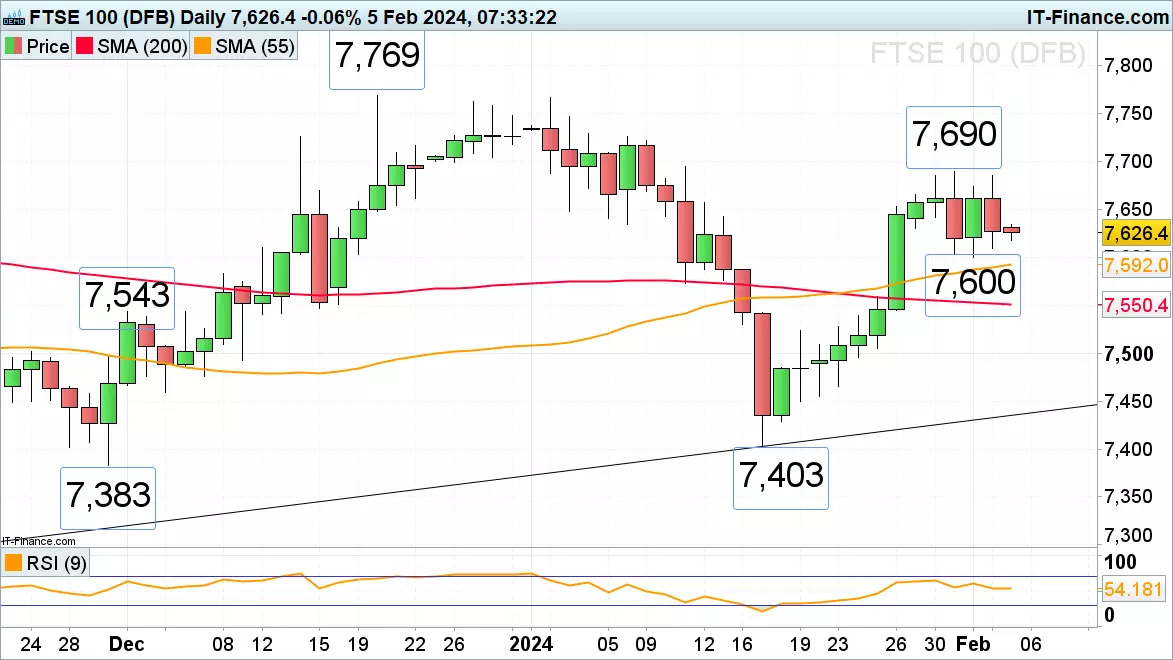
FTSE 100 continues to be side-lined
The FTSE 100 is stuck in its 7,690 to 7,600 sideways trading range, the break out of which may well determine the next minor trend. A fall through last week’s 7,600 low would lead to the 55-day simple moving average (SMA) at 7,592 being eyed, below which meanders the 200-day SMA at 7,550. Minor resistance can be found at last Tuesday’s 7,641 low above which lies last week’s high at 7,690. A rise above 7,690 and the 11 January high at 7,694 would likely target the mid-October high at 7,702. Further up the July and September highs can be seen at 7,723 to 7,747. As long as last week’s low at 7,600 underpins, the medium-term uptrend remains intact.
 Source: ProRealTime
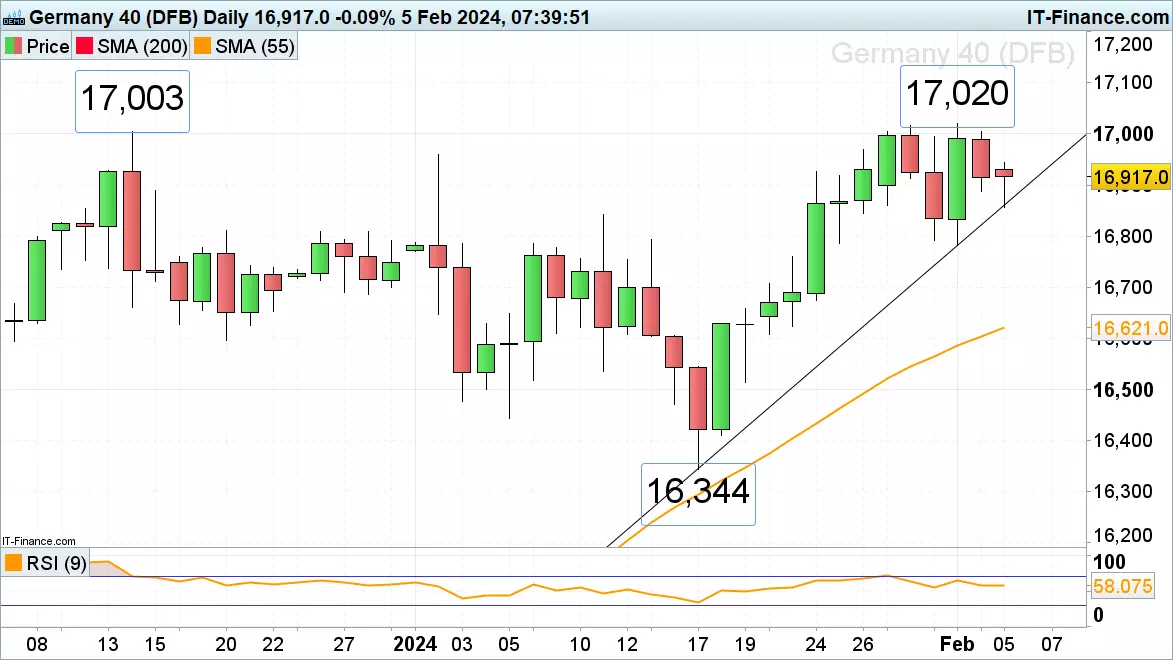
DAX 40 dips but tries to regain lost ground
The DAX 40 index dipped to its January-to-February uptrend line at 16,856 in overnight trading before recovering some lost ground and heading back up to its Monday 16,943 high. Above it beckon the mid-December and early February record highs at 17,003 to 17,020. Above 17,020 lies the 17,100 mark which may be reached next. This high will be eyed provided no bearish reversal to below last Thursday’s low at 16,782 is seen. Support above that low sits at Friday’s 16,889 low.
 Source: ProRealTime
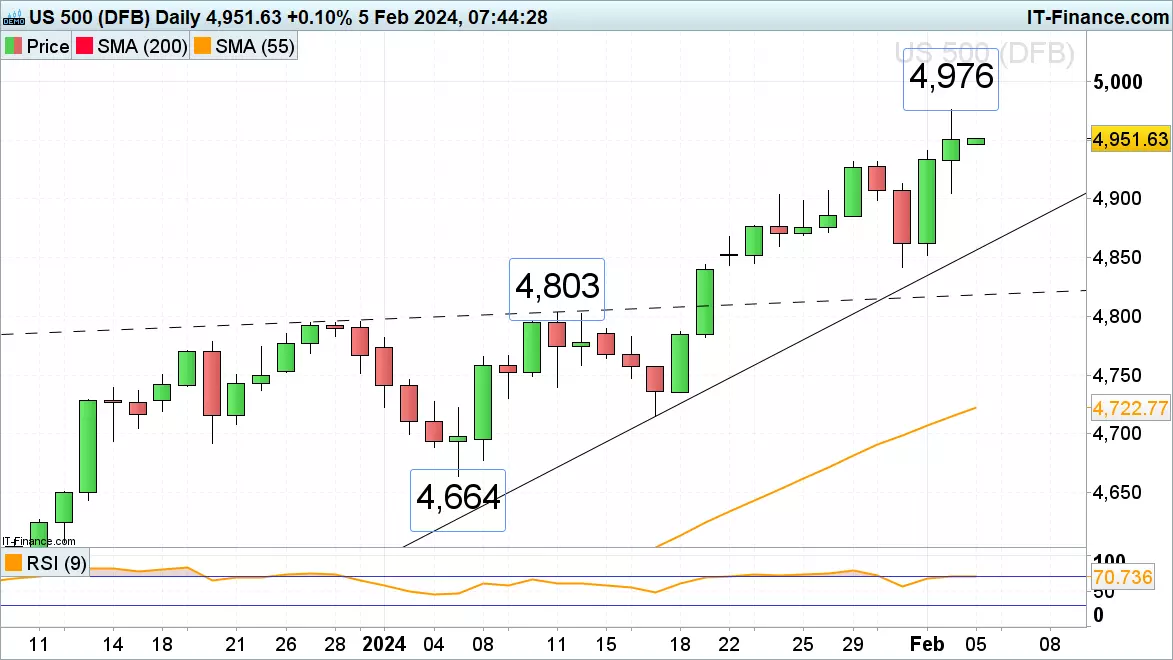
S&P 500 trades in new record highs
The S&P 500 continues to steam ahead and is fast approaching its psychological 5,000 mark around which it is expected to at least short-term lose upside momentum. Slips should find support around last Monday and Tuesday’s 4,931 high ahead of Friday’s 4,905 low. Slightly further down sits solid support between Tuesday’s 4,899 low and the 4,903 late January high.
 Source: ProRealTime
-
Friday's blowout non-farm payrolls reading has seen the chances of a March rate cut by the Fed diminish yet further. The payroll report blew past expectations, restating the strength of the US economy. An interview with Powell, broadcast last night, revealed that the Fed chief still expected 75bps of cuts this year, but reiterated that the committee was in no rush to cut rates would wait for more data before making a move. Stocks in Asia were muted - while the Nikkei 225 rose, Chinese markets were under pressure once again, as was the ASX 200. The dollar continues to revive, though US indices show little sign of heading substantially lower; indeed, the S&P 500 came within touching distance of 5000 on Friday. After the heavyweight data and earnings of last week, things cool down slightly, though today's US ISM report will be worth watching to see if it confirms the strong outlook for US jobs.

-
A blowout US jobs report continues to keep rate cut bets in check, with robust labour conditions validating Fed Chair Jerome Powell’s recent discussion to keep rates high for slightly longer.
 Source: Bloomberg
Market Recap
A blowout US jobs report last Friday continues to keep rate cut bets in check, with robust labour conditions validating Federal Reserve (Fed) Chair Jerome Powell’s recent discussion to keep rates high for slightly longer. The US job market has shown renewed signs of acceleration, with a recent gain of 353,000 jobs in January almost double the 180,000 consensus, while earlier numbers were revised higher as well. Along with a 0.6% month-on-month gain in hourly wages (versus 0.3% consensus), this will likely call for more patience in the unwinding of tight Fed policies and as the Fed Chair said, policymakers will likely wait beyond March.
The paring of dovish bets saw US Treasury yields higher, with the two-year yields up 16 basis point (bp) while the 10-year yields rose 14 bp, providing the catalyst for the US dollar to push to a near one-month high. That failed to dent the mood for equities however. Sentiments continued to bask in optimism around big tech earnings last Friday, but may have to take its cue from Fed’s policy outlook eventually once earnings are behind us.
The US dollar has seen some resilience lately, reclaiming its 200-day moving average (MA) last week while its relative strength index (RSI) on the daily chart defended the key 50 level to keep the near-term upward bias intact. A further move above the 103.80 level of resistance may set its sight to retest the 105.30 level next. On the downside, the 200-day MA will serve as immediate support to hold for buyers.
 Source: IG charts
Ahead this week, attention will be on the US Institute for Supply Management (ISM) services purchasing managers index (PMI) out tomorrow, where a slight bounce to 52.5 from previous 50.4 is expected, which should further validate more wait-and-see from US policymakers in terms of rate cut timeline. In addition, the earnings season will see notable releases from McDonalds, Caterpillar, Alibaba, Walt Disney.
Asia Open
Asian stocks look set for a mixed open, with Nikkei +0.43%, ASX -0.93% and KOSPI -1.60% at the time of writing. Chinese equities continue to struggle, with China regulators’ pledge to stabilise markets over the weekend failing to impress. A lack of details over how they plan to “guide more medium- and long-term funds into the market” may drive some reservations, although the tone suggests that authorities are keeping a closer look at the lacklustre market performance thus far.
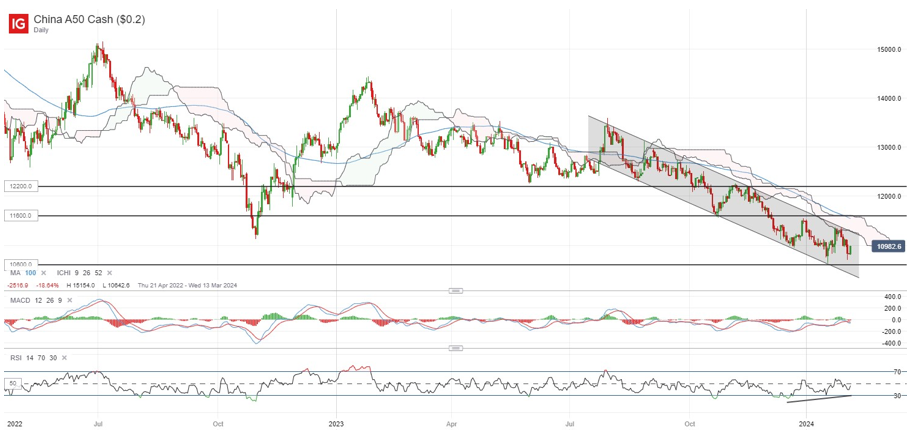
Today’s economic calendar saw more of the same out of China’s Caixin PMI, in which subdued growth conditions are presented. Its composite PMI edged slightly lower to 52.5 from previous 52.6, while the services component underperformed (52.7 versus 53.0 consensus). The data shows some signs of stabilisation for now, but whether this will lead to a firmer recovery ahead remains to be seen.
The China A50 index continues to trade within a descending channel pattern on the daily chart, which keeps the overall downward trend intact. But at least for now, higher lows on its daily RSI could point to abating downside momentum and drive some attempt to stabilise in the near term. The 11,200 level remains a crucial immediate resistance to overcome, where the upper channel trendline stands alongside the lower edge of its daily Ichimoku cloud.
 Source: IG charts
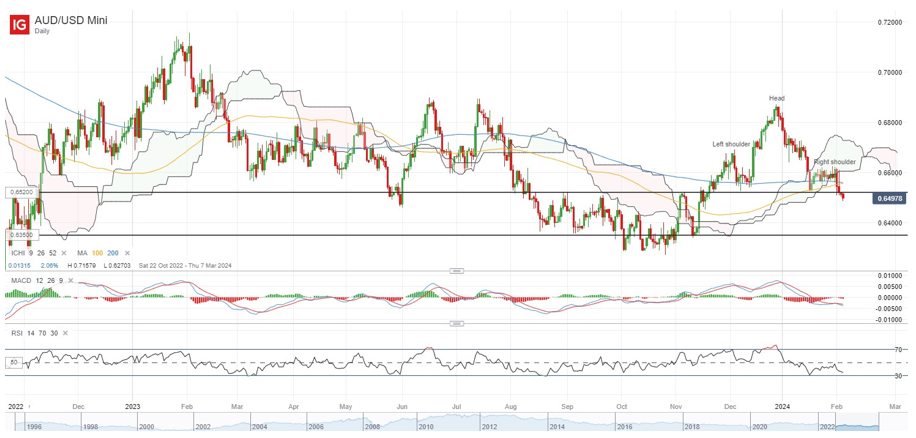
On the watchlist: Near-term head-and-shoulder formation keeps AUD/USD bulls in check
Renewed strength in the US dollar on a blowout US job report, alongside a quicker moderation in Australia’s inflation seen last week, has kept the AUD/USD under pressure lately. The pair has reverted to its two-month low, with a breakdown of a near-term head-and-shoulder formation keeping the bias to the downside.
To add to the caution, its 100-day and 200-day MAs have given way for now, along with a move back below its Ichimoku cloud on the daily chart. Its daily RSI has also failed to reclaim its 50 level after a retest last week. Ahead, the 0.652 level may serve as immediate resistance to overcome, where its 200-day MA coincides with the head-and-shoulder neckline. On the downside, the 0.635 level may be on watch.
 Source: IG charts
Friday: DJIA +0.35%; S&P 500 +1.07%; Nasdaq +1.74%, DAX +0.35%, FTSE -0.09%
IGA, may distribute information/research produced by its respective foreign affiliates within the IG Group of companies pursuant to an arrangement under Regulation 32C of the Financial Advisers Regulations. Where the research is distributed in Singapore to a person who is not an Accredited Investor, Expert Investor or an Institutional Investor, IGA accepts legal responsibility for the contents of the report to such persons only to the extent required by law. Singapore recipients should contact IGA at 6390 5118 for matters arising from, or in connection with the information distributed.
The information/research herein is prepared by IG Asia Pte Ltd (IGA) and its foreign affiliated companies (collectively known as the IG Group) and is intended for general circulation only. It does not take into account the specific investment objectives, financial situation, or particular needs of any particular person. You should take into account your specific investment objectives, financial situation, and particular needs before making a commitment to trade, including seeking advice from an independent financial adviser regarding the suitability of the investment, under a separate engagement, as you deem fit.
No representation or warranty is given as to the accuracy or completeness of this information. Consequently, any person acting on it does so entirely at their own risk. Please see important Research Disclaimer.Please also note that the information does not contain a record of our trading prices, or an offer of, or solicitation for, a transaction in any financial instrument. Any views and opinions expressed may be changed without an update.
-
US stocks reach new highs post-FOMC, fueled by tech earnings and a robust January jobs report. Ahead: economic insights and Fed speeches amid February's market challenges.
After a brief FOMC-inspired volatility episode mid-week, regular service resumed as US stock markets finished last week at fresh record highs, following strong earnings reports from Mega Tech (Meta +20.32%) and a robust jobs report. For the week, the Dow Jones added 545 points (+1.43%), the S&P 500 added 1.38% and the Nasdaq gained 1.27%.
Non-farm payrolls on Friday night surprised to the upside as the US economy added 353k jobs in January, smashing expectations for a gain of 180k. The number was accompanied by cumulative upward revisions over the prior two months of 126k, as the unemployment rate held steady at 3.7%, slightly below the 3.8% forecast. The US rates market is pricing in just a 20% chance of a rate cut in March, down from a near 80% probability in early January.
The US economic calendar is much lighter this week, following a blockbuster couple of weeks. ISM services PMI will be of interest, as well as updated thoughts from Fed speakers, including Bostic, Bowman, and Barkin. US Q4 earnings season continues this week with reports scheduled from companies including McDonalds, Caterpillar, Alibaba, Walt Disney, Uber, Paypal and PepsiCo.
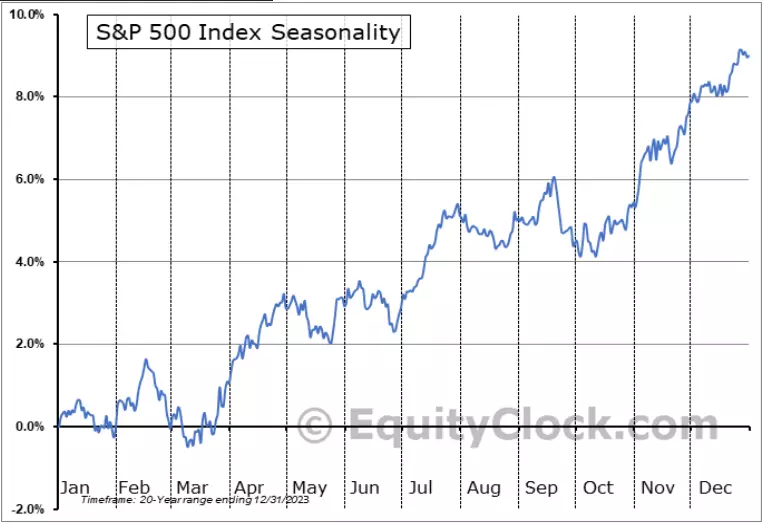
As we push deeper into February, it is worth remembering that February is traditionally one of the more challenging months of the year for US equity markets. The slippery slope usually starts in mid-February and extends into the first week of March.
S&P 500 Seasonality Index
 Equityclock.com
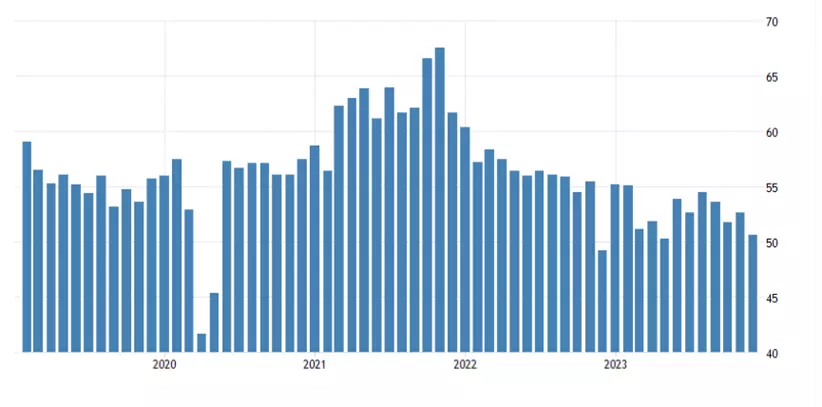
What is expected from the ISM Services PMI (Tuesday, February 6th at 2 am)
Last week, the ISM manufacturing PMI beat expectations, increasing by two points to 49.1, the highest level since 2022. The increase was driven by new orders and production, which entered expansionary territory, and supported the idea of a turn higher in manufacturing after fifteen months in contractionary territory.
This week, attention turns to the ISM service PMI (Tuesday, February 6th at 2 am). It is expected to print at 51.7, rebounding from 50.4 in December, representing continued expansion in the services sector.
ISM Service PMI chart
 Source: TradingEconomics
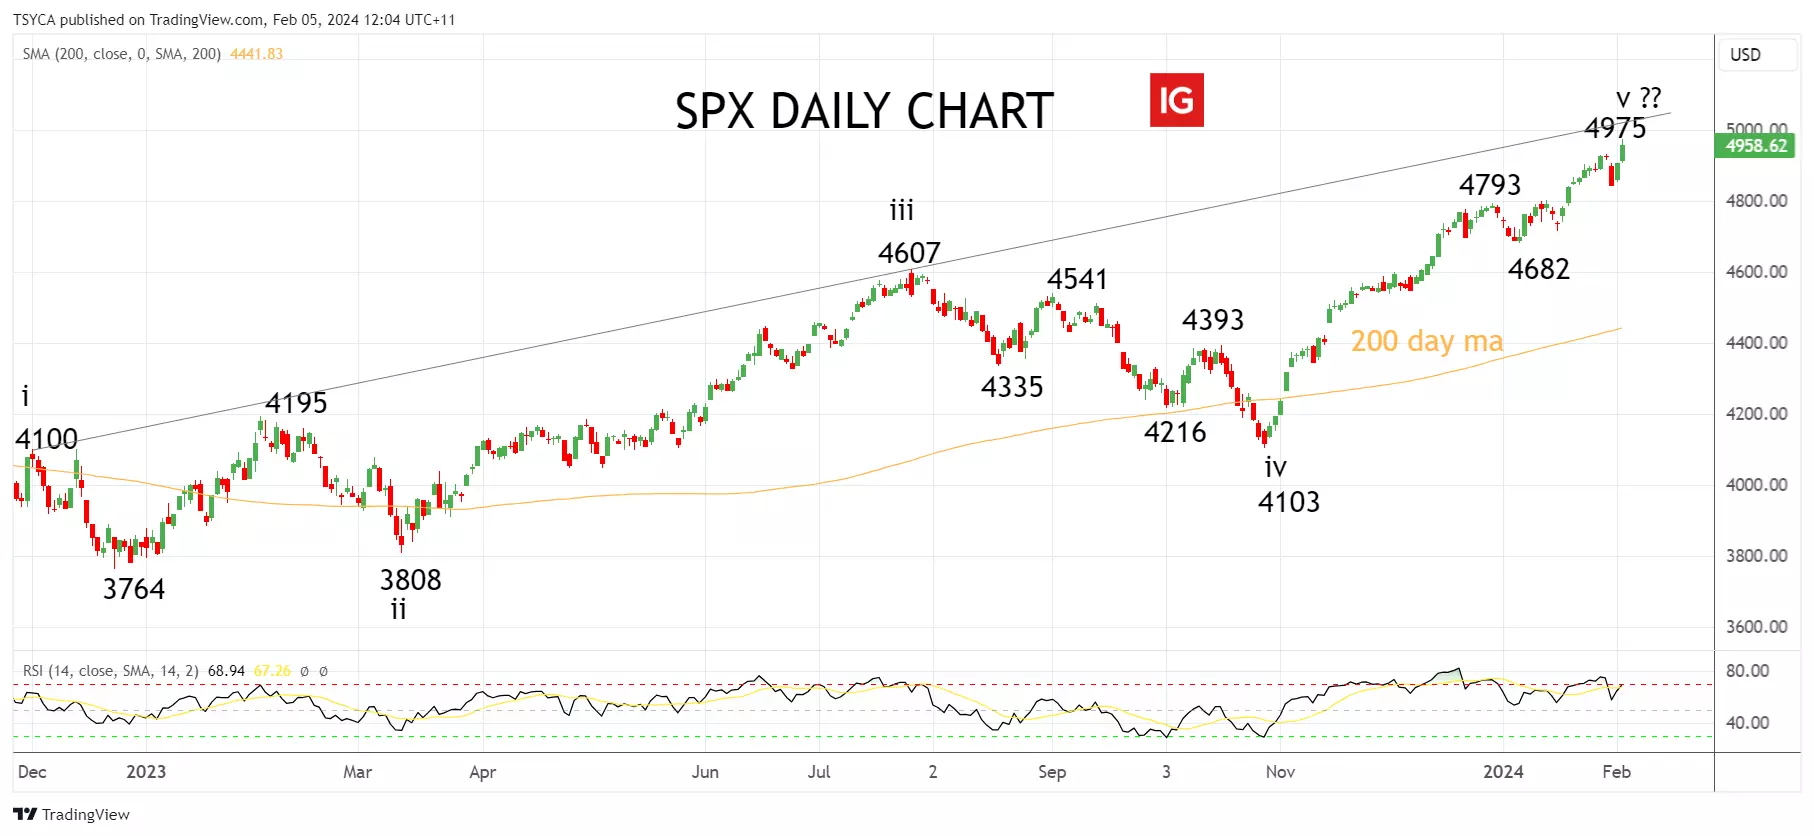
S&P 500 technical analysis
After a strong rally for the S&P 500 into the end of 2023, we started the new year in a more cautious/neutral frame of mind.
We remain of the view that the S&P 500 is in the final stages (Wave V) of its rally from the October 2023 low, and note again, the bearish RSI divergence on the daily chart. Bearish RSI divergence occurs when prices make new highs; but the RSI fails to make a new high.
Furthermore, the S&P 500 cash is closing in on the psychologically important 5000 resistance level, which is being reinforced by trendline resistance at 5020, drawn from the December 1st 4100 high, viewed on the chart below.
As such, we remain patient, waiting for a pullback to develop in the coming weeks in the order of 5-8%.
S&P 500 daily chart
 Source: TradingView
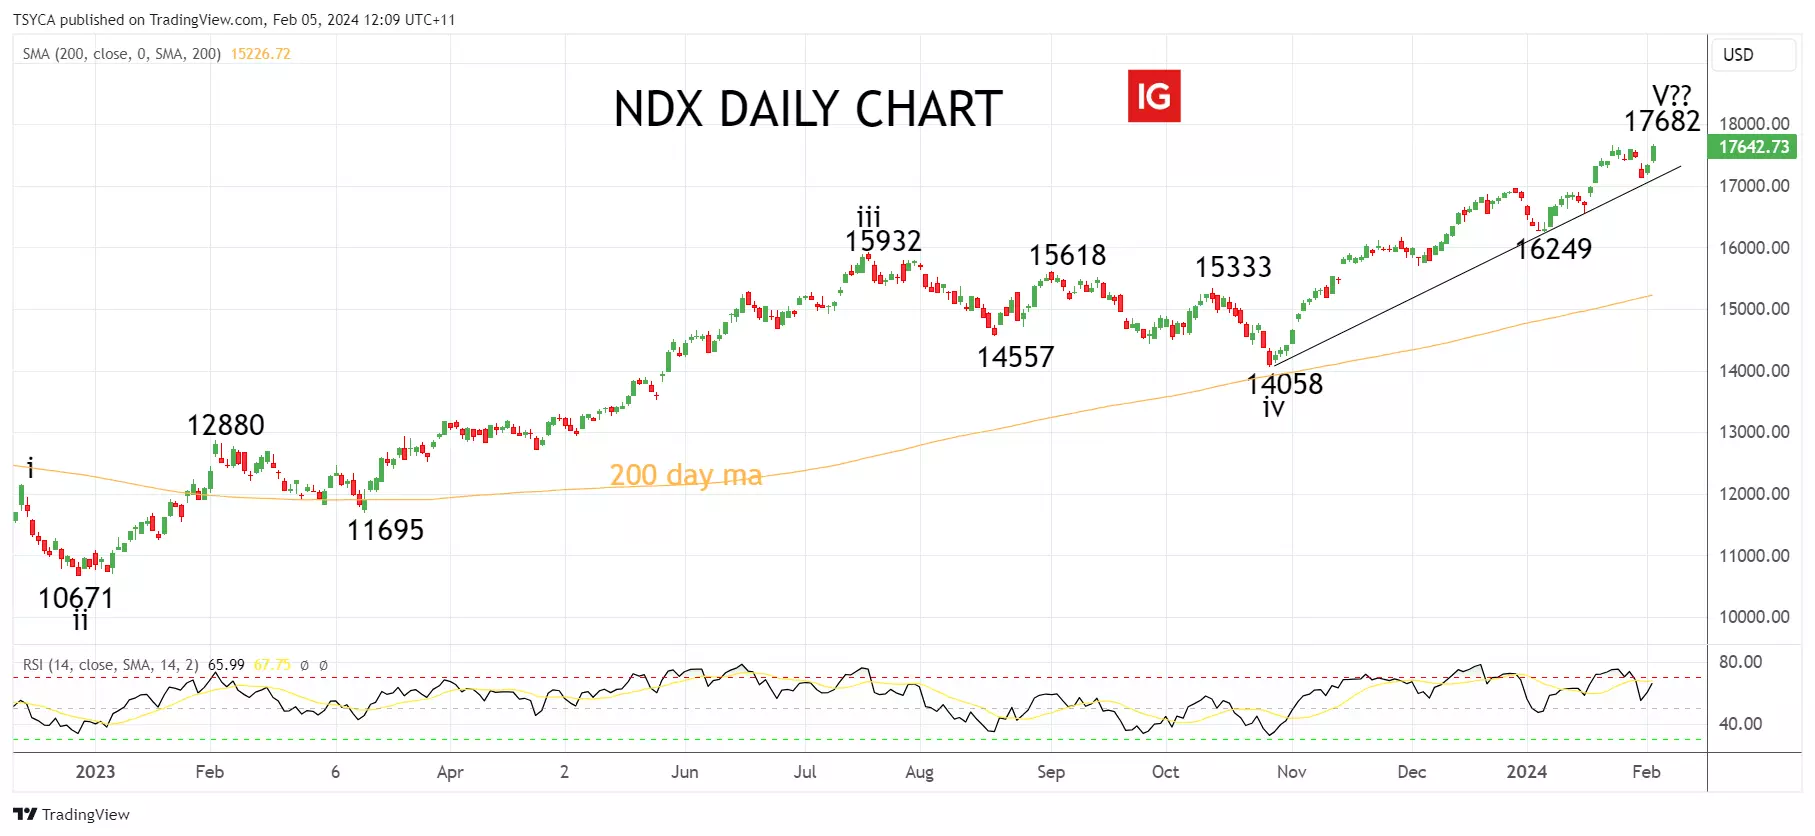
Nasdaq technical analysis
After a strong rally for the Nasdaq into the end of 2023, we started the new year in a more cautious/neutral frame of mind.
We remain of the view that the Nasdaq is in the final stages (Wave V) of its rally from the October 2023 low. However, a break/ daily close below uptrend support at 17,100, coming from the October lows, is needed to suggest that the Nasdaq has topped and that a deeper retracement towards support at 16,200/16,000 is underway. Until then, allow for the Nasdaq to extend its rally towards 18,000.
Nasdaq daily chart
 Source: TradingView
- Source: TradingView. The figures stated are as of 5 February 2024. Past performance is not a reliable indicator of future performance. This report does not contain and is not to be taken as containing any financial product advice or financial product recommendation.
This information has been prepared by IG, a trading name of IG Australia Pty Ltd. In addition to the disclaimer below, the material on this page does not contain a record of our trading prices, or an offer of, or solicitation for, a transaction in any financial instrument. IG accepts no responsibility for any use that may be made of these comments and for any consequences that result. No representation or warranty is given as to the accuracy or completeness of this information. Consequently any person acting on it does so entirely at their own risk. Any research provided does not have regard to the specific investment objectives, financial situation and needs of any specific person who may receive it. It has not been prepared in accordance with legal requirements designed to promote the independence of investment research and as such is considered to be a marketing communication. Although we are not specifically constrained from dealing ahead of our recommendations we do not seek to take advantage of them before they are provided to our clients.
-
The Australian dollar drops for a fifth week due to soft inflation data and a hawkish Fed, with the RBA Board meeting in focus for future policy clues.
 Source: Bloomberg
Last week we saw the AUD/USD lock in a fifth consecutive week of falls to finish at .6512 (-0.94%), as the pullback from late December .6871 high deepened.
The trigger to last week's sell-off was Wednesday's cooler-than-expected Q4 inflation data in Australia. However, telling blows also came for a more hawkish than expected FOMC meeting with the Fed chair all but ruling out the possibility of a rate cut in March, reinforced by a robust non-farm payrolls report on Friday evening.
This week's critical local economic event for the AUD/USD is tomorrow's RBA board meeting, previewed below.
What is expected from the RBA board meeting (Tuesday, February 6th at 2.30 pm)
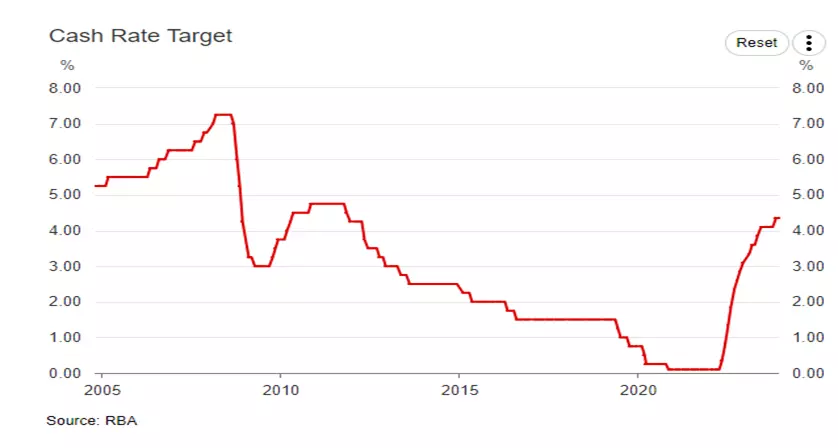
At its board meeting in December, the Reserve Bank of Australia kept the official cash rate on hold at 4.35%, as widely expected. The RBA retained a tightening bias, using the same wording used in the November statement, watered-down from previous months.
"Whether further tightening of monetary policy is required to ensure that inflation returns to target in a reasonable timeframe will depend upon the data and the evolving assessment of risks."
A run of cooler data since the December meeting (including last week's retail sales and Q4 inflation data) confirms the RBA's thirteen rate hikes between May 2022 and 23rd November are having the desired effect, and will see the RBA keep rates on hold tomorrow at 4.35%.
While it's too early for the RBA to perform a dovish pivot, it will likely replace its tightening bias with more balanced forward guidance. We expect the RBA to cut rates by 25 rate cuts in August before a second cut in November, which will see the cash rate end the year at 3.85%.
RBA official cash rate chart
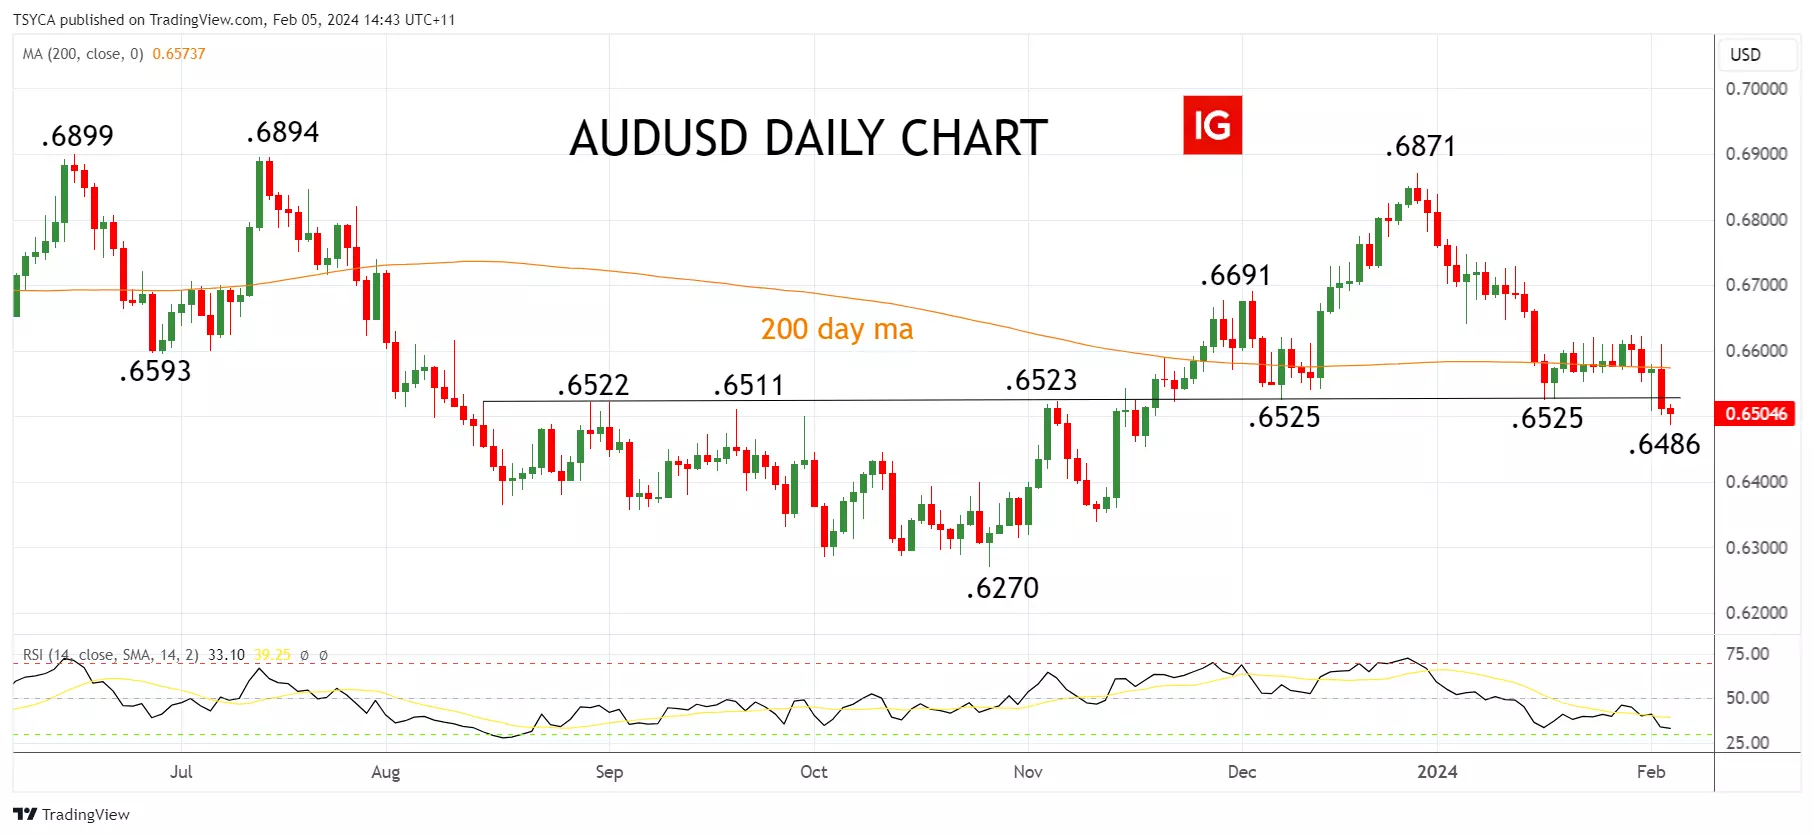
AUD/USD technical analysis
Recently, we have been looking for the AUD/USD to turn the corner and move higher based on the idea that the pullback from the December .6871 high is part of a correction, rather than a reversal lower.
However, today's break below a strong layer of horizontal support at .6520/00, which includes the 61.8% Fibonacci retracement of the October to December rally at .6500c, has cast some doubt over this interpretation.
If the AUD/USD does see a sustained break of .6520/00 after tomorrow's RBA board meeting, it would warn that a deeper decline is unfolding towards 6400c, with the scope to weekly trendline support at .6300c.
However, if the AUD/USD can regain altitude above .6520/00 over the next 24 hours, we will maintain the view that the decline from the December .6871 high has been a correction, and not part of a reversal lower.
AUD/USD daily chart
 Source: TradingView
- Source: TradingView. The figures stated are as of 5 February 2024. Past performance is not a reliable indicator of future performance. This report does not contain and is not to be taken as containing any financial product advice or financial product recommendation.
This information has been prepared by IG, a trading name of IG Australia Pty Ltd. In addition to the disclaimer below, the material on this page does not contain a record of our trading prices, or an offer of, or solicitation for, a transaction in any financial instrument. IG accepts no responsibility for any use that may be made of these comments and for any consequences that result. No representation or warranty is given as to the accuracy or completeness of this information. Consequently any person acting on it does so entirely at their own risk. Any research provided does not have regard to the specific investment objectives, financial situation and needs of any specific person who may receive it. It has not been prepared in accordance with legal requirements designed to promote the independence of investment research and as such is considered to be a marketing communication. Although we are not specifically constrained from dealing ahead of our recommendations we do not seek to take advantage of them before they are provided to our clients.
-
4 hours ago, CGE_Trading said:
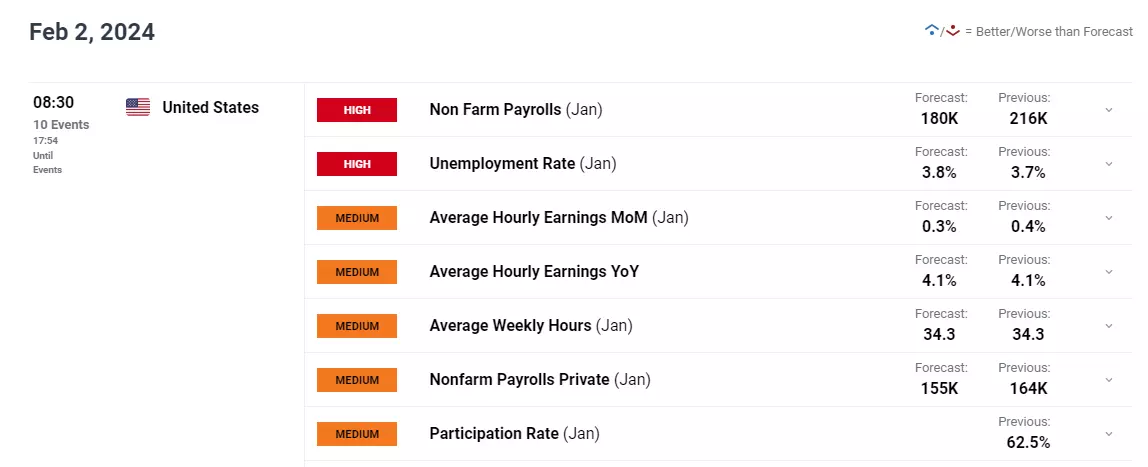
Today is NFP
Thanks for sharing @CGE_Trading
US Dollar Jumps After NFPs Smash Estimates, Gold Slumps
Feb 2, 2024 3:56 PM +02:00 | Nick Cawley, Senior Strategist
The latest US NFP release showed the US jobs market in rude health with 353k new jobs created in January compared to forecasts of 180k. Last month’s headline figure was also revised higher to 333k from 216k. The closely watched unemployment rate remained steady at 3.7%.
The US dollar was on the backfoot going into the Jobs Report as recent demand for US Treasuries sent their yields tumbling. Renewed US regional banking fears – shares in New York Community Bancorp slumped by around 40% on Wednesday – drove haven demand, leaving the greenback vulnerable to the downside.
NEW YORK COMMUNITY BANCORP DAILY PRICE
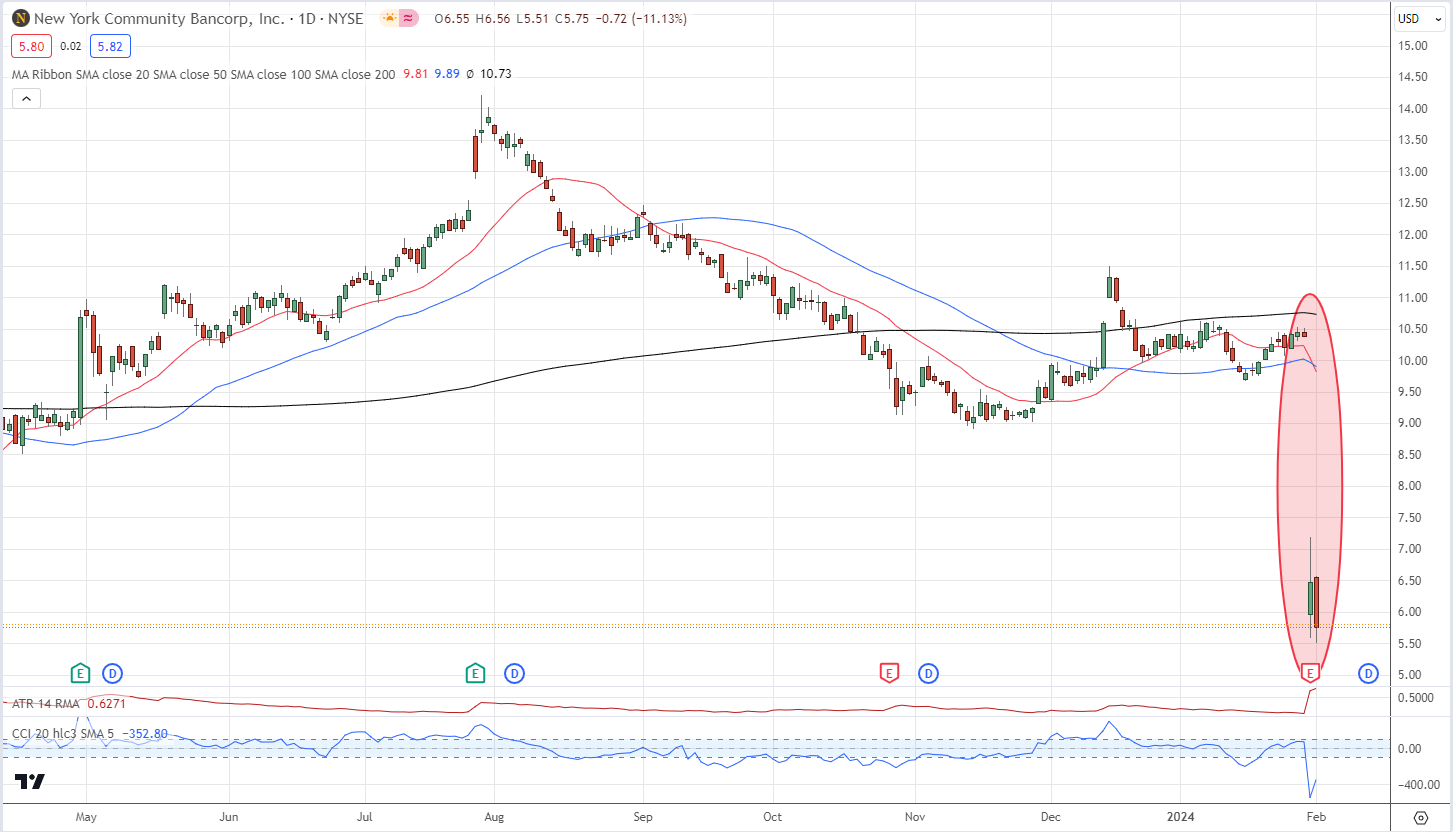
The US dollar index jumped around 50 ticks after the release hit the screens, reversing all of today’s earlier losses. The greenback remains rangebound, for now, but may soon test the 103.83/85 double highs seen over the last couple of weeks. US rate cut expectations pared post-release with less than a 20% chance now seen of a cut in March – from 35% before the release – while May expectations are now 77% compared to a high 80s earlier.
US DOLLAR INDEX DAILY CHART

Gold’s recent grind higher was quickly reversed after the 13:30 release. Gold tagged $2,065/oz. yesterday, before paring gains. Gold currently trades at $2,033/oz. and is sitting on a prior level of horizontal support and both the 20- and 5-day simple moving averages. A break below here bring $2,009/oz. back into play.
GOLD DAILY PRICE CHART

What is your view on Gold – bullish or bearish?
-
Analyzing key movements and levels in USD/CAD, AUD/USD, and NZD/USD post-FOMC, offering a snapshot of crucial technical patterns.
Source: Bloomberg
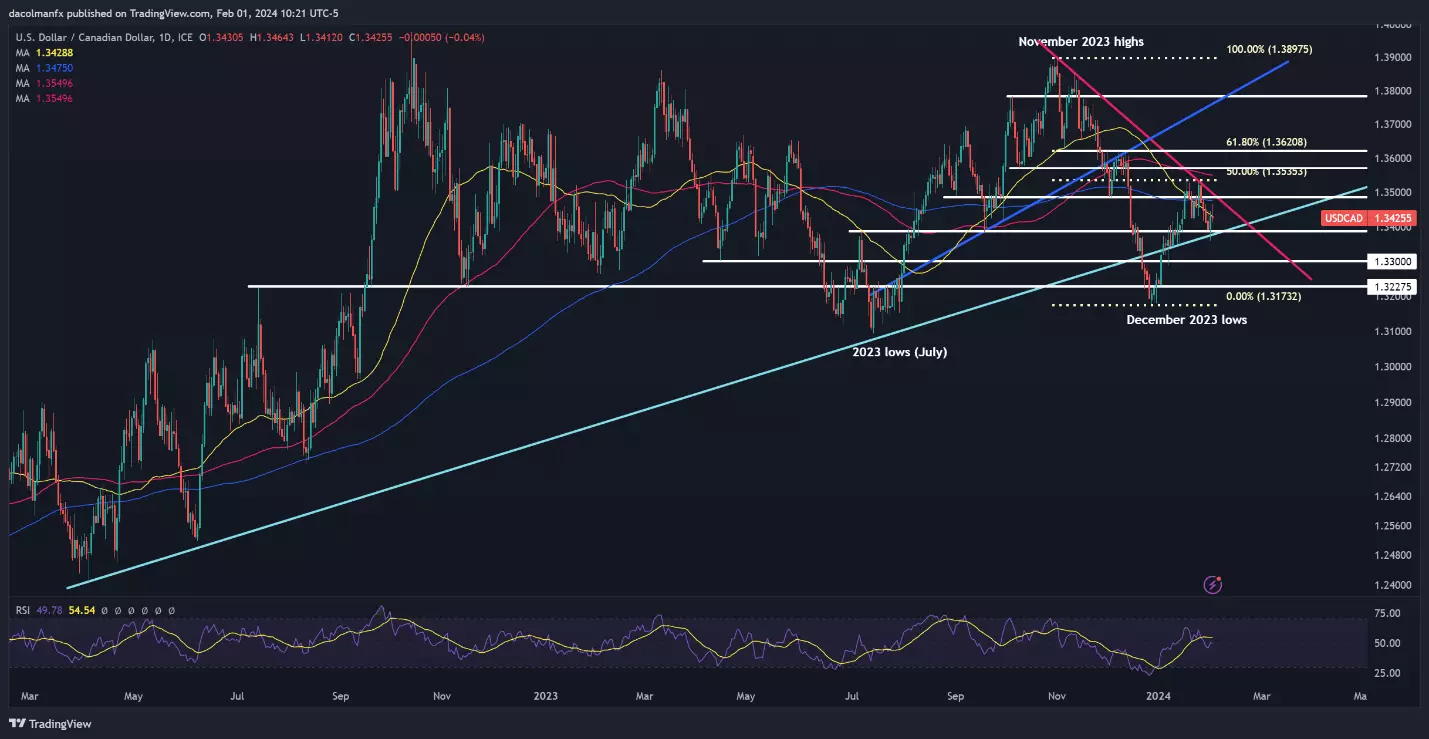
USD/CAD technical analysis
USD/CAD showed strength after the FOMC decision, but pivoted to the downside on Thursday, nudging lower towards cluster support resting at 1.3390. It is imperative for the bulls to fiercely safeguard this region; any failure to do so could potentially trigger a retracement towards the 1.3300 handle.
Conversely, if the pair regains its poise, its first challenge lies in surpassing the 50-day simple moving average. Beyond this point, the focus shifts to trendline resistance and the 200-day simple moving average, situated in the proximity of 1.3480.
USD/CAD daily chart
 Source: TradingView
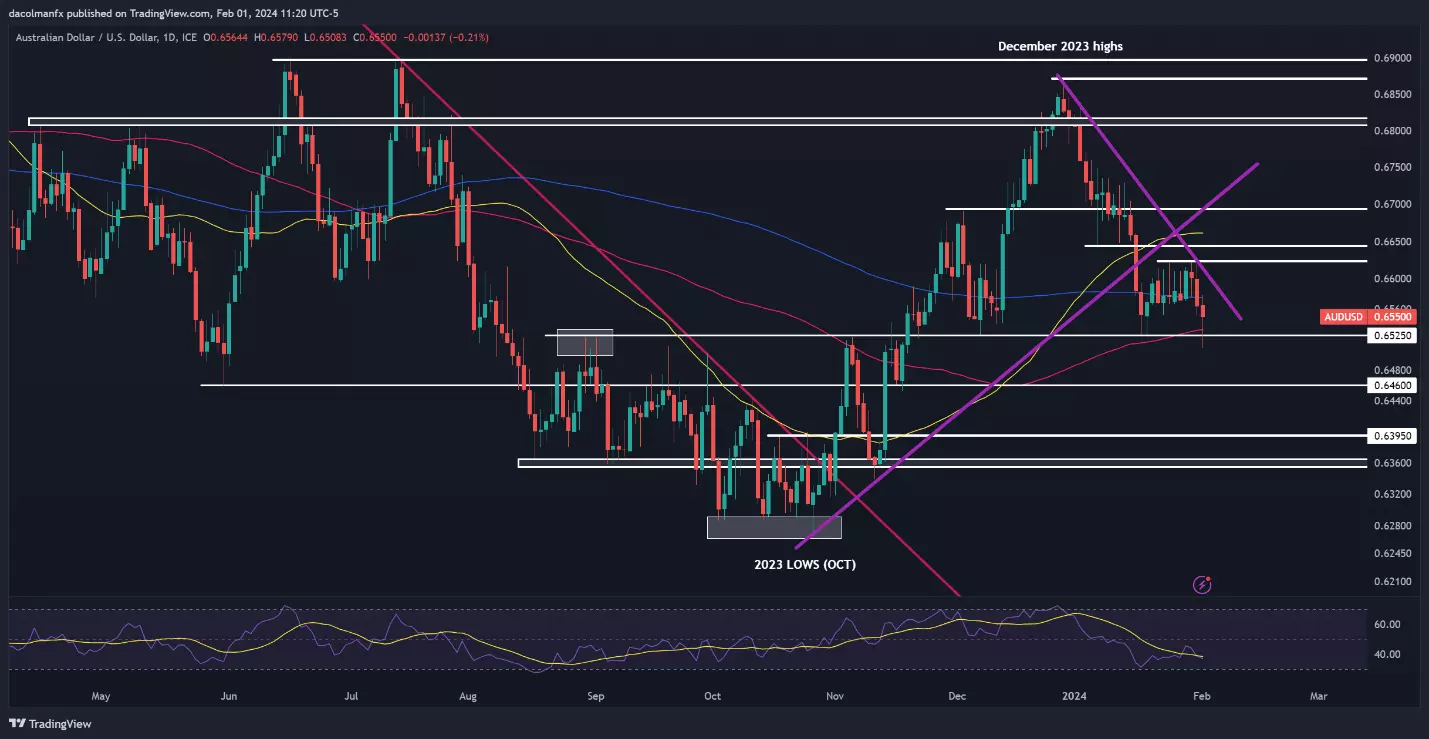
AUD/USD technical analysis
A shift towards a risk-off sentiment weighed on AUD/USD during Thursday's trading session, though the pair managed to maintain its position above technical support at 0.6525. For market conditions to be conducive to a bullish reversal, this floor must hold; any breach could trigger a move towards 0.6460.
On the flip side, if the mood brightens and the Aussie mounts a comeback, resistance awaits at 0.6600 and then 0.6625. If history is any guide, prices could be rejected from this region on a retest; however, a successful breakout could lead to a move towards 0.6645, followed by 0.6695.
AUD/USD daily chart
 Source: TradingView
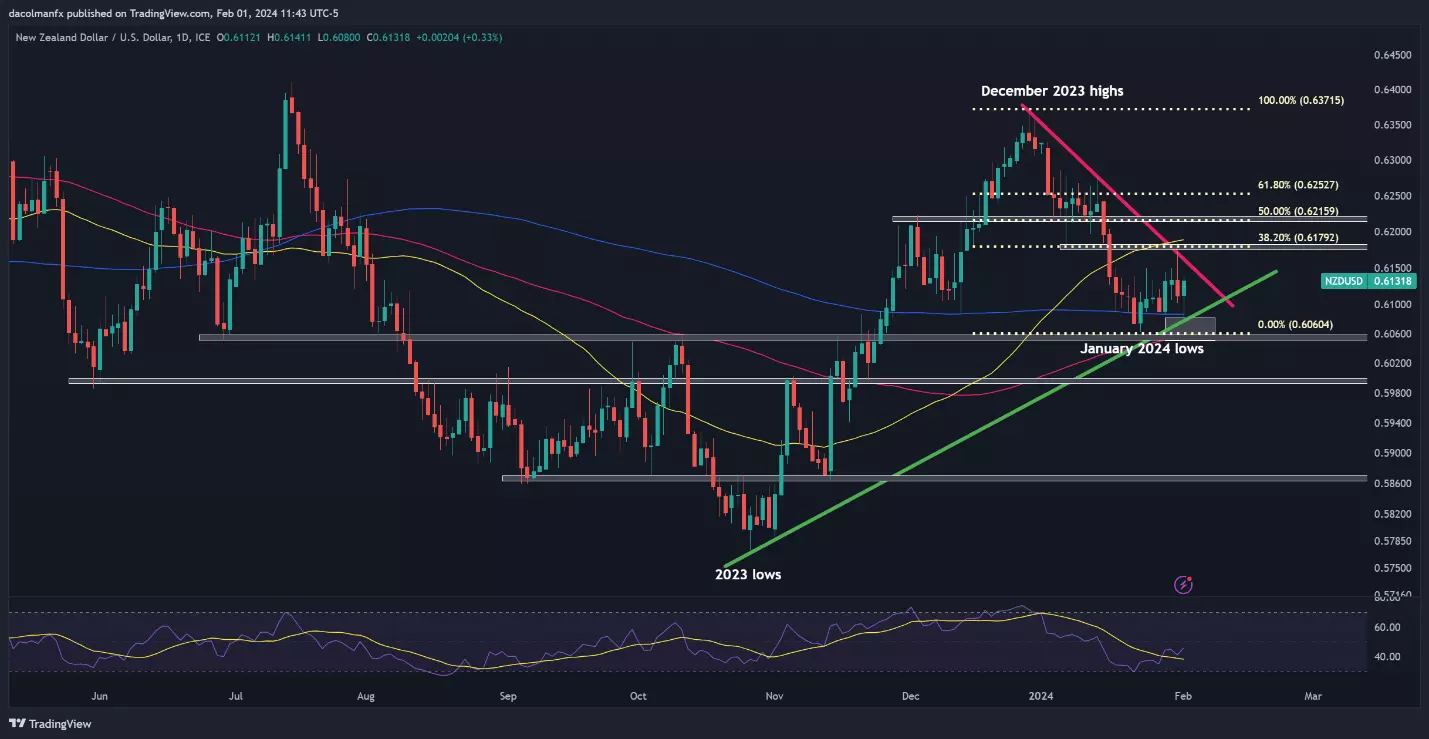
NZD/USD technical analysis
After a subdued performance after the Fed’s monetary policy announcement, NZD/USD rebounded on Thursday, making strides toward trendline resistance at 0.6155. While this technical ceiling is expected to act as a staunch barrier to further advances, a breakout could bring a key Fib level at 0.6180 into play.
In contrast, should sellers reemerge and trigger a market retracement, cluster support spanning from 0.6085 to 0.6050 will be the first line of defense against a bearish assault. The bears may struggle to push prices below this region, but if they succeed, a move towards 0.6000 could ensue.
NZD/USD daily chart
 Source: TradingView
This information has been prepared by IG, a trading name of IG Australia Pty Ltd. In addition to the disclaimer below, the material on this page does not contain a record of our trading prices, or an offer of, or solicitation for, a transaction in any financial instrument. IG accepts no responsibility for any use that may be made of these comments and for any consequences that result. No representation or warranty is given as to the accuracy or completeness of this information. Consequently any person acting on it does so entirely at their own risk. Any research provided does not have regard to the specific investment objectives, financial situation and needs of any specific person who may receive it. It has not been prepared in accordance with legal requirements designed to promote the independence of investment research and as such is considered to be a marketing communication. Although we are not specifically constrained from dealing ahead of our recommendations we do not seek to take advantage of them before they are provided to our clients.
-
Friday's US nonfarm payrolls report could sway gold prices, with weak job data potentially boosting and strong data dampening them. This article explores gold's short-term technical outlook.
Source: Bloomberg
The Federal Reserve concluded earlier this week its first meeting of 2024, voting to maintain its policy settings unchanged. The FOMC also abandoned its tightening bias, but indicated it will not rush to cut borrowing costs. Chairman Powell went a step further by acknowledging that officials may not yet be confident enough to remove restriction at their next gathering.
Although the possibility of a rate cut in March has diminished, the situation could change again if incoming information shows that activity is starting to roll over. In the grand scheme of things, a weaker economy could prompt policymakers to reconsider their stance; after all, data dependency has been the guiding principle for the central bank recently.
Given the present state of events, the January US employment report will assume greater importance and carry added weight. That said, Wall Street projections suggest US employers added 180,000 workers last month, though a softer outcome should come as no surprise following a subdued ADP reading and rising jobless claims for the period in question.
Upcoming us jobs report
 Source: DailyFX
If nonfarm payrolls figures prove lackluster and fall well short of expectations, a March rate cut might be back on the table. Under these circumstances, we could observe a sharp retracement in US treasury yields and the US dollar. This scenario is likely to foster a constructive environment for gold in the near term.
On the other hand, if NFP numbers beat consensus estimates by a wide margin, there’s potential for further reduction of dovish wagers on the Federal Reserve’s monetary policy outlook. In this scenario, bond yields and the greenback could accelerate to the upside, weighing on the precious metals complex. In this context, bullion could find itself in a precarious position in February.
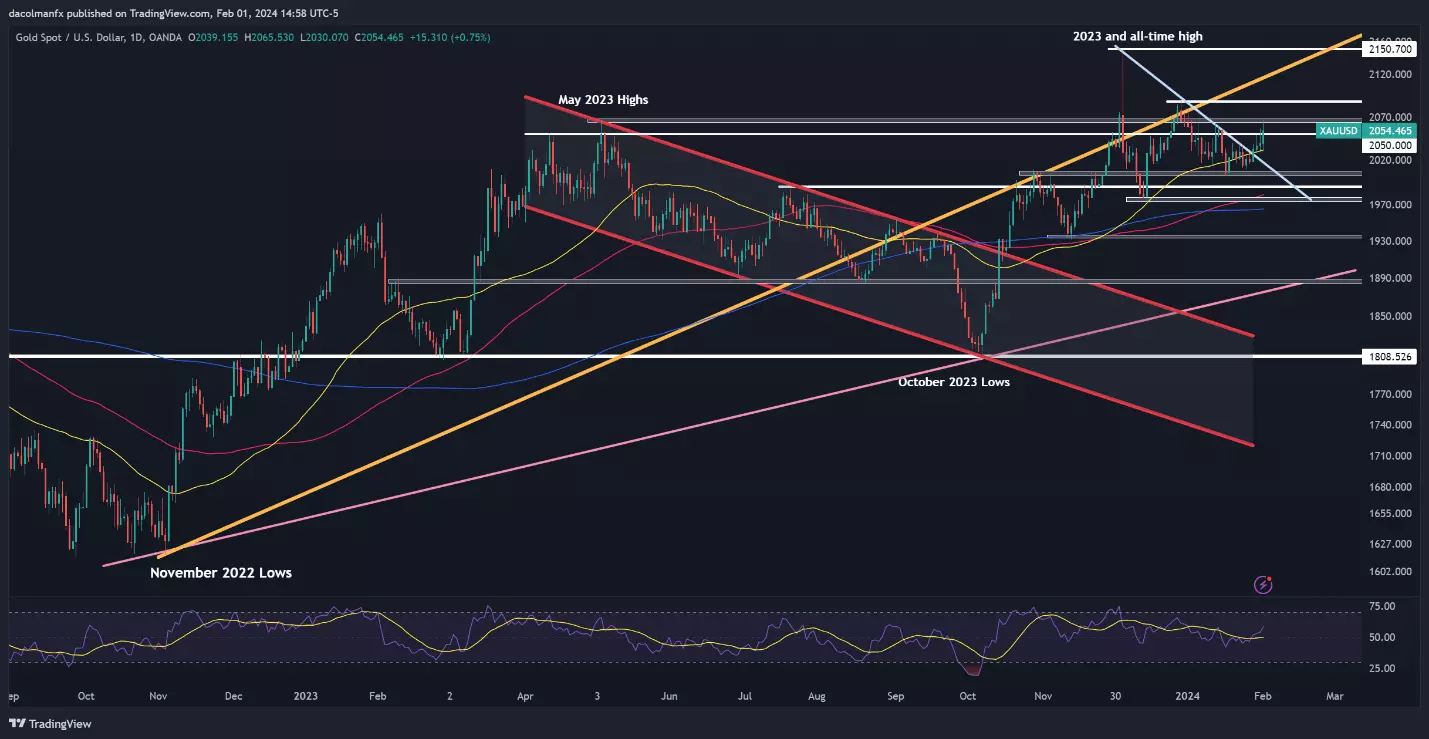
Gold price technical analysis
Gold climbed on Thursday, pushing past the $2,050 barrier and coming within a hair's breadth of breaking $2,065, a key ceiling. With the bulls reasserting control, this resistance could soon be overcome. If that scenario plays out, a rally toward $2,085 is possible. On further strength, the focus will turn to $2,150.
Conversely, if buying interest fades and XAU/USD pivots lower, it's vital for traders to watch the $2,050 level for bearish activity. If this area fails to offer support, a drop toward the 50-day simple moving average may unfold, followed by a possible retest of $2,005. Below this floor, all eyes will be on $1,990.
Gold price daily chart
 Source: TradingView
This information has been prepared by IG, a trading name of IG Australia Pty Ltd. In addition to the disclaimer below, the material on this page does not contain a record of our trading prices, or an offer of, or solicitation for, a transaction in any financial instrument. IG accepts no responsibility for any use that may be made of these comments and for any consequences that result. No representation or warranty is given as to the accuracy or completeness of this information. Consequently any person acting on it does so entirely at their own risk. Any research provided does not have regard to the specific investment objectives, financial situation and needs of any specific person who may receive it. It has not been prepared in accordance with legal requirements designed to promote the independence of investment research and as such is considered to be a marketing communication. Although we are not specifically constrained from dealing ahead of our recommendations we do not seek to take advantage of them before they are provided to our clients.
-
Meta's announcement of its first dividend, and a $50 billion share buyback programme, provided a tonic for markets that had been wobbling after the Fed decision. Strong figures from Amazon helped too, helping to offset Apple, which dropped 3% on news of weak China revenue. The ASX 200 and Kospi both rose sharply overnight, with the Nikkei 225 seeing more muted gains. While the Hang Seng was flat, indices in mainland China dropped sharply again. Today's payrolls reading is expected to see job growth slow again, and the unemployment rate to rise. Given the Fed is on watch for any signs of weakening data, today's figures will prove crucial for near-term direction in indices and the US dollar.

-
Market update: Japanese yen provides reversal hints: USD/JPY, EUR/JPY, GBP/JPY setups
Explore the recent bullish surge in the Japanese yen post-hawkish Bank of Japan meeting. Analyse key charts, including USD/JPY. Gain insights into technical dynamics in this concise overview.
 Source: Bloomberg
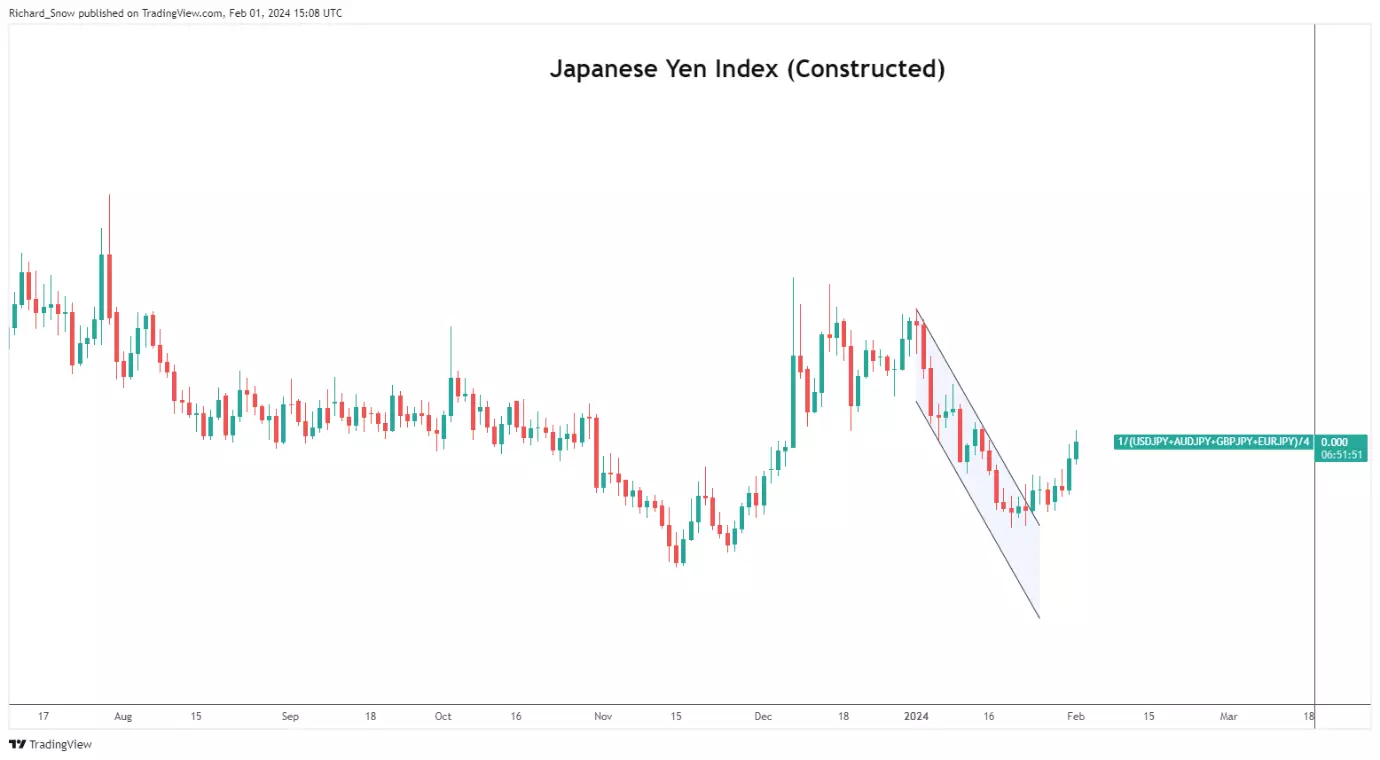
Japanese yen adds to bullish lift
The Japanese yen appears to be building on some early upward momentum, in the aftermath of a moderately hawkish Bank of Japan (BoJ) meeting in January. While there was no change to negative interest rate or alterations to the ongoing yield curve control, BoJ governor Kazuo Ueda sees the likelihood of reaching the 2% target as “gradually increasing”. A simple, constructed Japanese yen index below shows a steady rise in the value of the yen yesterday, and today thus far.
Constructed Japanese yen index- equal weighted average of USD/JPY, GBP/JPY, EUR/JPY, AUD/JPY
 Source: TradingView
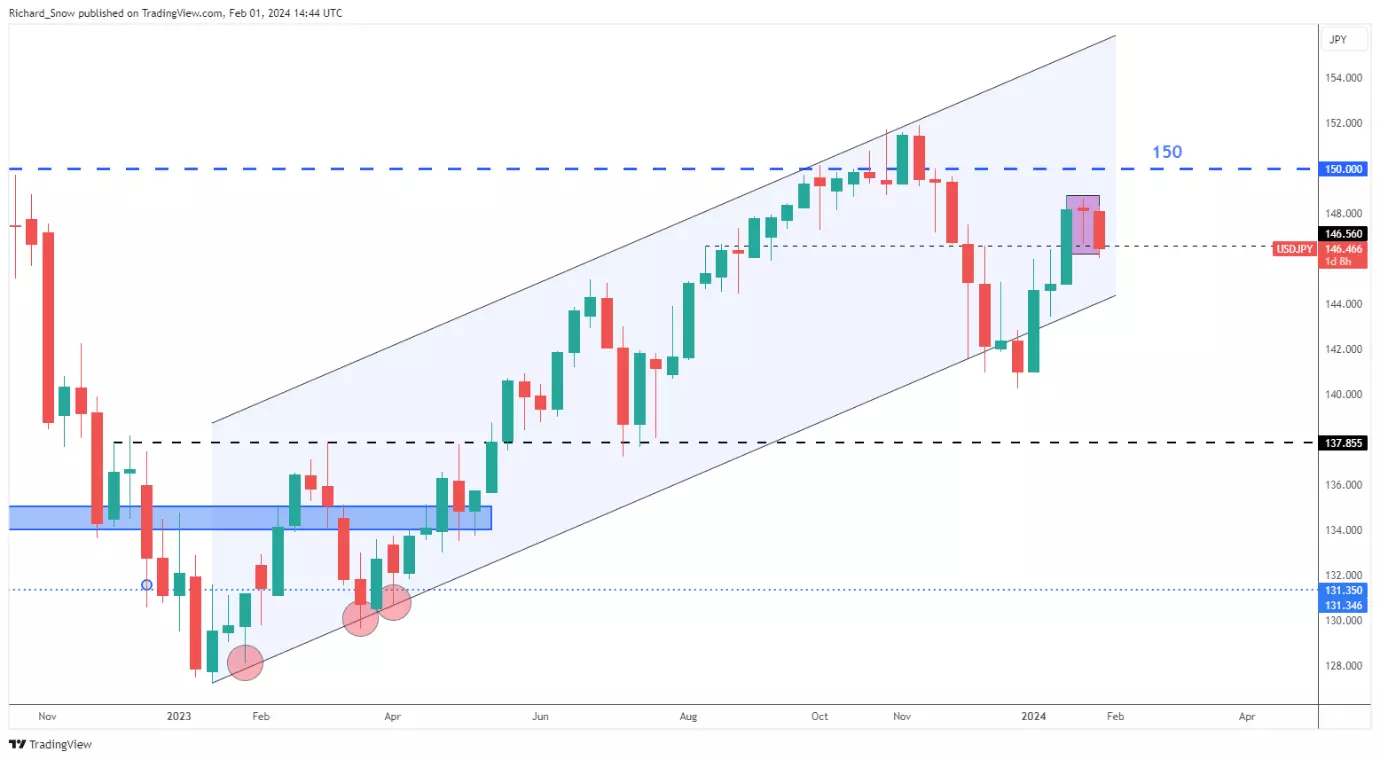
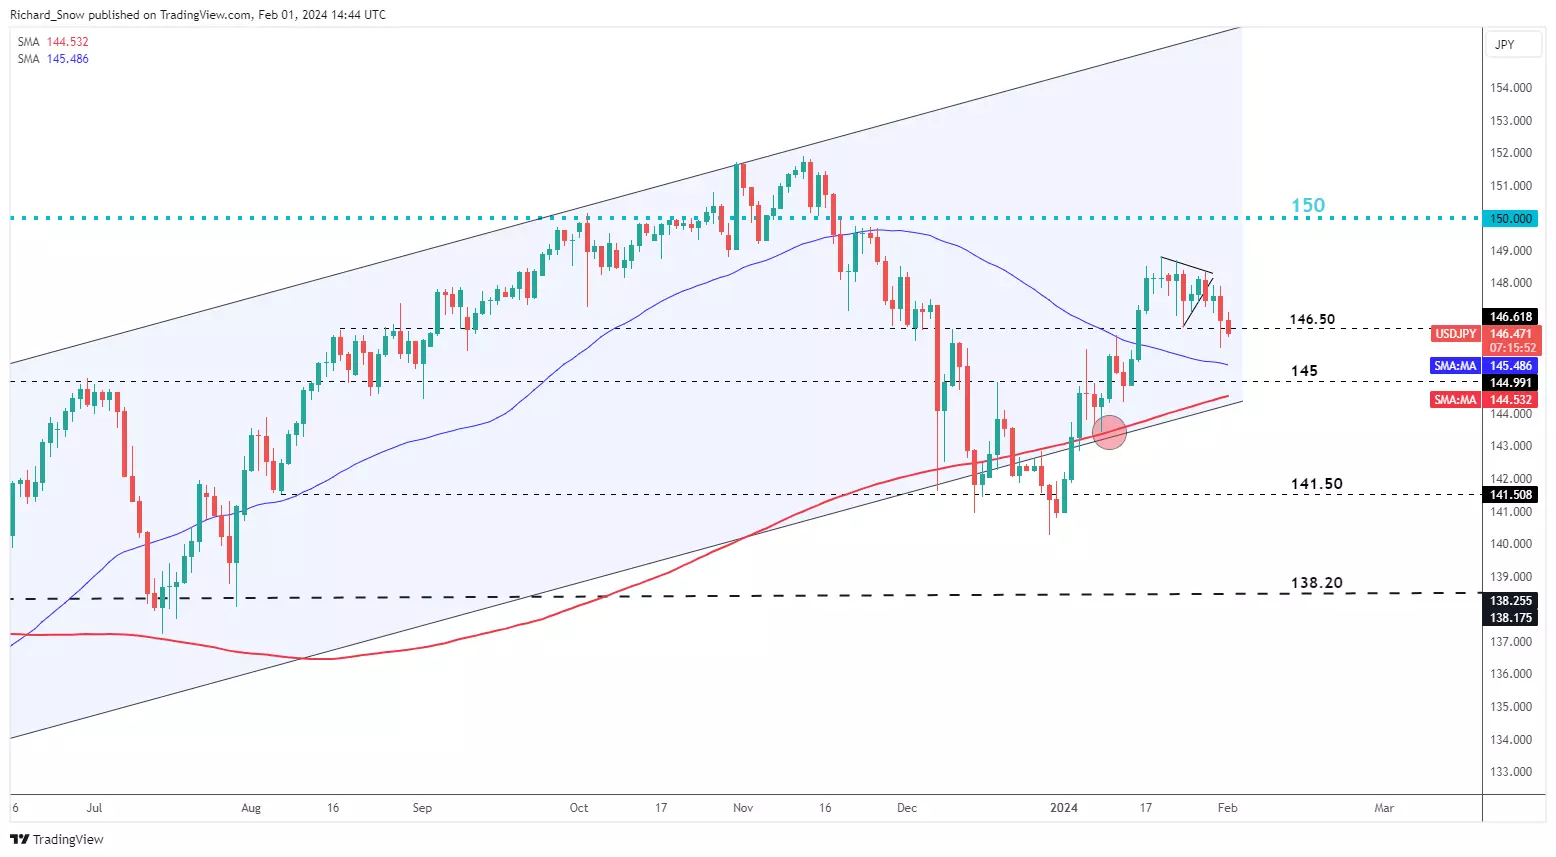
The weekly hanging man candle was identified in the weekly US dollar forecast, and it signalled a possible move lower in USD/JPY ahead of this week. Since then, the subsequent red candle (this week thus far) heads lower, testing the 146.56 mark.
USD/JPY weekly chart
 Source: TradingView
The daily chart shows the invalidation of a developing bullish pennant as price action heads lower. This presented an example where the longer timeframe view clashed with shorter-term, daily developments highlighting the importance of multi-timeframe analysis and recognition of the longer-term dynamics.
The pair currently tests the 146.50 level with 145 not far away. It is then that the 200-day simple moving average appears at long-term channel support. The zone of support may be difficult to breach should price action drop enough to test the area.
USD/JPY daily chart
 Source: TradingView
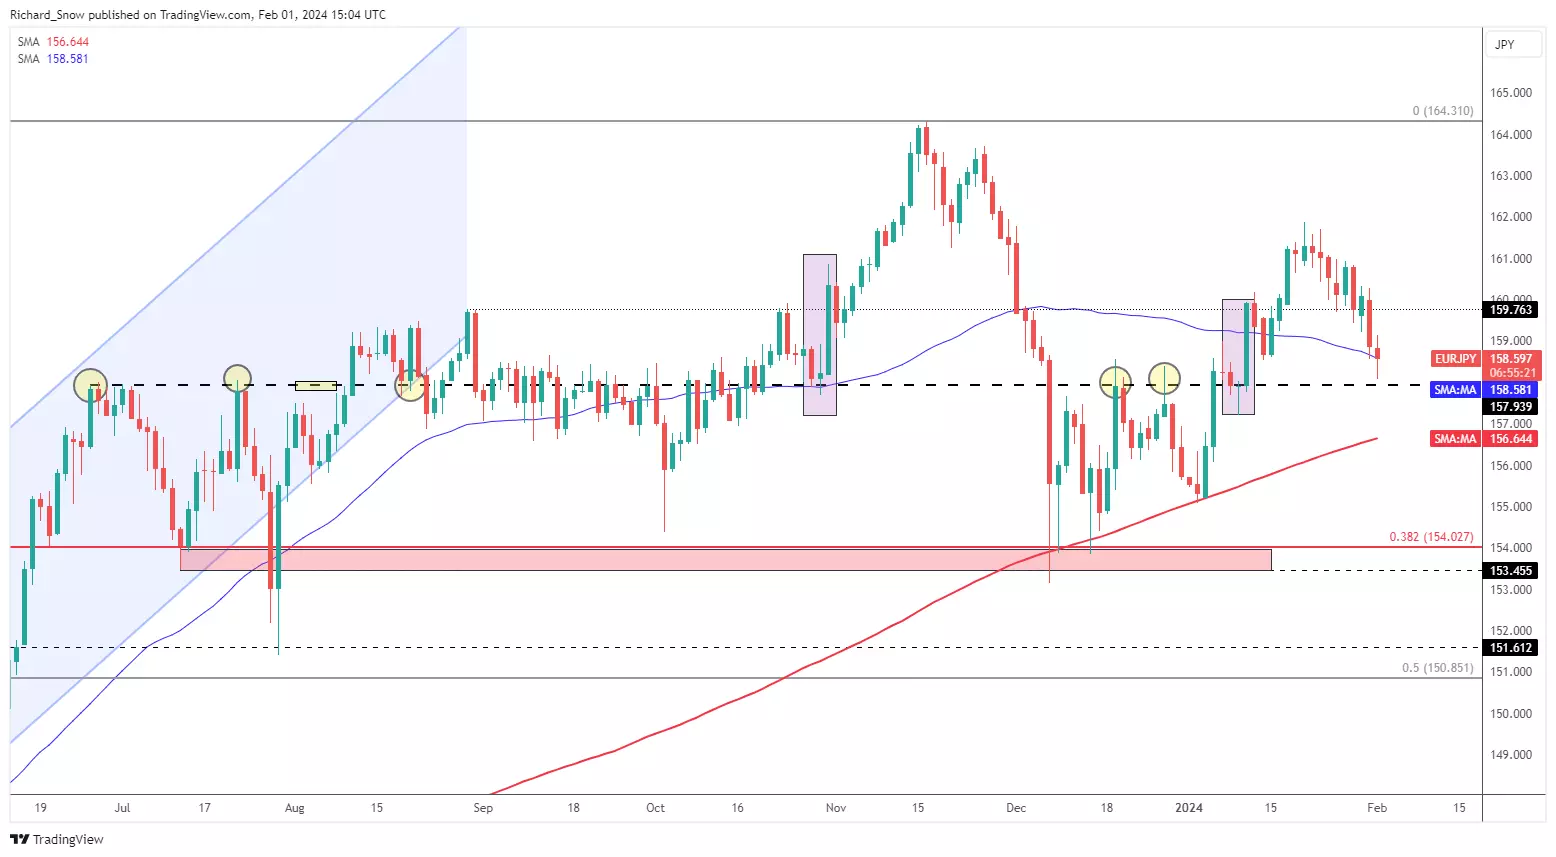
EUR/JPY approaches key pivot point
EUR/JPY signalled a slowdown in bullish momentum (evidenced by longer upper wicks) before stalling and heading lower. The pair now tests the 50-day simple moving average but more importantly, heads towards a key pivot point in 157.94. The level has come into play as resistance in June, July and December of last year and provided a zone of resistance throughout September (on a closing basis).
The recent selloff has been characterised by two bearish engulfing candles, helping to spur on sellers. The 200 SMA is the next level of support at 156.64 if the pair has enough momentum to breach 157.94. In the event Support process too much to handle once again, 159.76.
EUR/JPY daily chart
 Source: TradingView
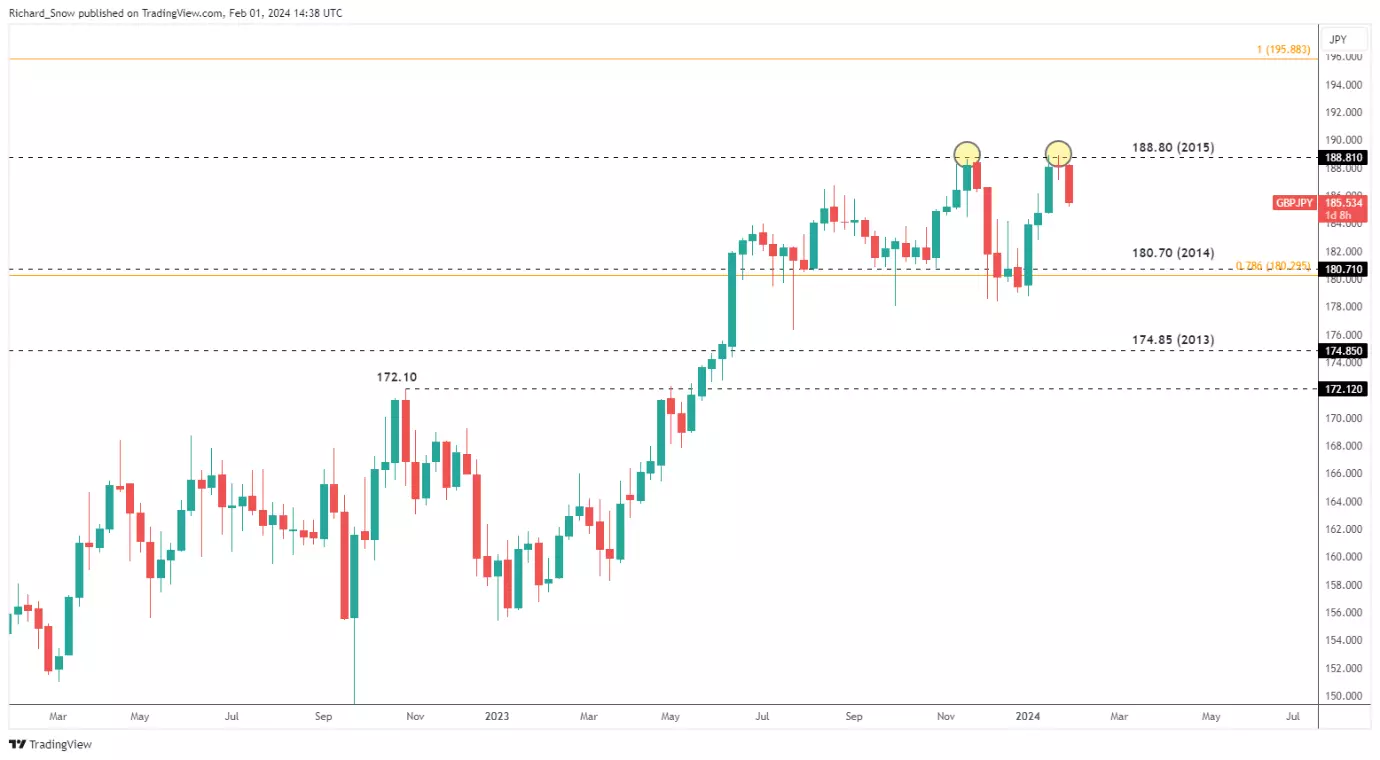
GBP/JPY ‘double top’ limits further upside potential
On the weekly GBP/USD chart, a notable double top appears to be limiting a bullish continuation over the long-term. At 188.80 has proven to be too tough to crack with prices easing before potentially attempting another go.
GBP/USD weekly chart
 Source: TradingView
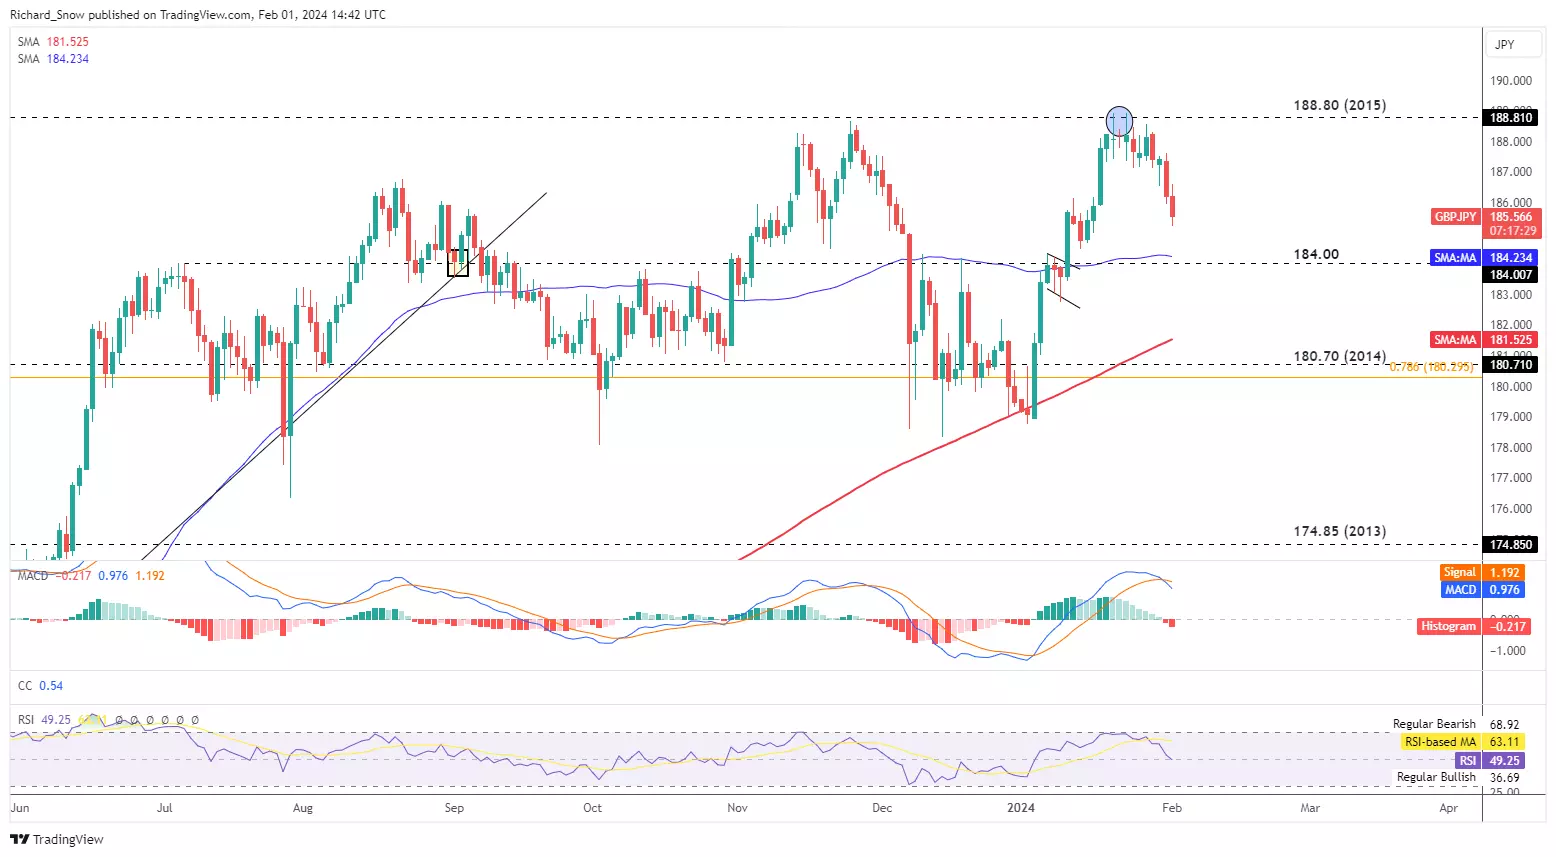
GBP/USD exhibited very little movement considering we heard from the Bank of England, providing its monetary policy update alongside the release of its updated forecasts. At 188.80 it appears a long way away now that the pair had headed lower in recent sessions.
At 184.00 flat is the next level of support to keep in mind as it also coincides with the 50-day simple moving average. The MACD supports the continuation of bearish momentum after exhibiting a bearish crossover, and the RSI currently sits in the neutral zone – suggesting that any attempt to arrest this decline would have to be substantial.
GBP/USD daily chart
 Source: TradingView
This information has been prepared by IG, a trading name of IG Australia Pty Ltd. In addition to the disclaimer below, the material on this page does not contain a record of our trading prices, or an offer of, or solicitation for, a transaction in any financial instrument. IG accepts no responsibility for any use that may be made of these comments and for any consequences that result. No representation or warranty is given as to the accuracy or completeness of this information. Consequently any person acting on it does so entirely at their own risk. Any research provided does not have regard to the specific investment objectives, financial situation and needs of any specific person who may receive it. It has not been prepared in accordance with legal requirements designed to promote the independence of investment research and as such is considered to be a marketing communication. Although we are not specifically constrained from dealing ahead of our recommendations we do not seek to take advantage of them before they are provided to our clients.


Qantas Airways 1H24 earnings preview: recovery in the air?
in Shares and ETFs
Posted
With a history marked by robust FY23 results and recent controversies, all eyes are on the new CEO, Vanessa Hudson, and her team's ability to navigate challenges, enhance customer service, and capitalise on strong travel demand.
When will Qantas report its latest earnings?
Qantas Airways Limited (QAN) is Australia's flag carrier and the third oldest airline in the world. It reports its half-year figures on Thursday, 22 February 2024.
Key financials
Soaring high: Qantas' record-breaking FY2023 performance
Qantas reported bumper FY2023 earnings in late August, benefiting from strong demand for travel, a slimmed-down cost base, and high ticket prices. The report showcased the following highlights:
Qantas revenue chart
Turbulence ahead: controversies cloud Qantas
However, the first half of 2024 was one of turmoil for Qantas. Beset by several controversies, including accusations of greed, misuse of power, and arrogance, the once much-loved company lost the trust of the public, acknowledged by outgoing Chairman Richard Goyder in the Qantas 2023 Annual Report: "As we move through our recovery, management and the Board are acutely aware of the need to rebuild your confidence in Qantas. We're also conscious of the loss of trust that has occurred because our service has often fallen short of expectations, compounded by a number of other issues relating to the pandemic period.
Despite the apology, the company's annual general meeting in November turned heated as shareholders rejected the executive pay deal and criticised management for issues ranging from ghost flights, poor customer service, and preferential treatment to Prime Minister Anthony Albanese's son.
Hopes that 2024 would provide a fresh start have been dashed following a report by former ACCC chairman Alan Fels, who accused the company of price gouging and recommended airport prices be formally regulated and restrictions on domestic and international aviation removed.
Flight path to recovery: Qantas's operational overhaul
After former CEO Alan Joyce's early departure, this will be the first set of results for the new CEO, Vanessa Hudson. Ms Hudson has made changes to the executive team and appointed consultant McKinsey for a major overhaul of its operations, focusing on improving its on-time performance.
In its last trading update in September, the company noted that travel demand remains robust for the Qantas Group and that the first quarter of FY24 mirrors the strong trading conditions witnessed in the final quarter of FY23. While analysts expect to see higher spending on customer service to repair its tarnished image and higher fuel costs, Qantas is expected to unveil another set of robust earnings numbers.
Qantas technical analysis
The Qantas share price and the company's reputation took a substantial hit in 2023, falling over 30% from a high of $6.94 in April to a low of $4.67 in October.
Since that point, the share price has reclaimed about half of those losses to be trading at $5.72, just below resistance at $5.80, which is the 50% Fibonacci retracement of the decline from the $6.94 high to the $4.67 low. Above $5.80, there is a formidable layer of horizontal resistance at $6.00/$6.20 before the March 2023 $6.94 high.
On the downside, near-term support is viewed at $5.50 before weekly uptrend support at around $5.00, coming from the March 2020 $2.03 low. Be aware that a sustained break of uptrend support would open the way for the price to test the October $4.67 low before a band of horizontal support at $4.20.
Qantas weekly chart
This information has been prepared by IG, a trading name of IG Markets Limited. In addition to the disclaimer below, the material on this page does not contain a record of our trading prices, or an offer of, or solicitation for, a transaction in any financial instrument. IG accepts no responsibility for any use that may be made of these comments and for any consequences that result. No representation or warranty is given as to the accuracy or completeness of this information. Consequently any person acting on it does so entirely at their own risk. Any research provided does not have regard to the specific investment objectives, financial situation and needs of any specific person who may receive it. It has not been prepared in accordance with legal requirements designed to promote the independence of investment research and as such is considered to be a marketing communication. Although we are not specifically constrained from dealing ahead of our recommendations we do not seek to take advantage of them before they are provided to our clients. See full non-independent research disclaimer and quarterly summary.