

Caseynotes
-
Posts
13,207 -
Joined
-
Last visited
-
Days Won
556
Content Type
Profiles
Forums
Blogs
Events
Community Tutorials
Store
Posts posted by Caseynotes
-
-
Another push down in the Dax having broken down through 11396 (orange) then double tapped the underside as retest.

-
 1
1
-
-
As expected yesterday the indices went looking for resistance and finding it at the short term highs when price fell back to settle near the starting point. Looking at the charts last night it seemed obvious that the next move would be to retest the lows so was a little annoyed to find this morning that they had already done it with Dax dropping 90 tick in the early hours. The down side may not be over yet though as Dow is still reaching and Nikkei has pushed through it's orange daily support level. >>

-
1
-
-
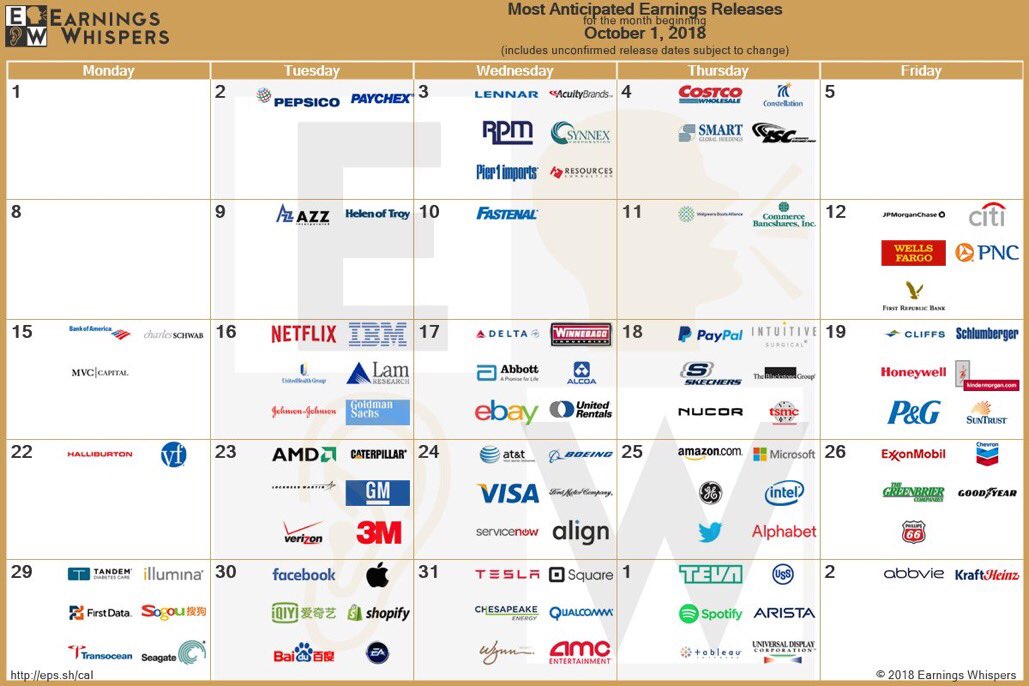
Worth remembering that the earnings releases of these huge companies this week affects not only their own stock price but can have a sudden impact on index they are listed on as well, especially the Dax and Dow with only 30 constituents.
https://www.dividendmax.com/market-index-constituents/dow-jones-30
-
1
-
-
Ohhh, spooky. Comparison S&P charts, October 1987 (the week before 'Black Monday') and the current chart.
https://www.ccmmarketmodel.com/short-takes/2018/10/21/1987-crash-vs-2018-setup
Also has a 50 min vid but I didn't watch (too scared).

-
1
-
-
Worth repeating this calendar (above), as was mentioned in the APAC brief some big names going through this week and next.
-
 1
1
-
-
Early signs indicating a day for testing resistance following the Nikkei lead upward. FTSE has the least distance to travel with the recent short term high at 7095 while Dax has the 11690 to get through before 11851.

-
1
-
-
Hi @SS16, the demo setup is automatic so first check you have the live and demo feeds once you have downloaded MT4 by going to Tools > Options > Server.
Then go to File > Open an account, both the IG live and IG demo feeds should come up so press next and then select new demo account and follow the prompts.
-
Week end and a look back over the daily charts the Dow looks corrective rather than bearish after the recent refusal to go through the highs while the trade dispute is unresolved.
They have all gone into consolidation with strong support while waiting for new news to determine next direction.
The recently announced new up coming trade talks were put on hold during the week with China refusing to consider making any concessions. Meanwhile reports continue out of China of retail sales being badly hit in large markets such as new car sales and property sales with some new build apartments seeing a 30% price drop. Bloomberg reported during the week on the devastation to retail traders in China's stock market quoting an average loss per trader of 100,000 Yuan (around $15,000). China has run out of ammunition for tariff retaliation and Trump looks happy to continue playing the waiting game.

-
1
-
-
The morning session saw a trip down for Dax to retest 11487 while Dow went sideways, Dax now returning to 11623 as Dow attempts to break up through 25500 which was a support level on Wednesday. So the US session again looks poised to go higher but the story this week has been for the US open to push lower.

-
1
-
-
Another big sell off inspired by the US session again yesterday with patient recovery during the APAC session. FTSE least affected and nearing the top of range.
Difficult to call whether this 3 bar rally is just a short term retracement before a move to test the lows or a reversal back towards Wednesday's highs. The Euro open at 7:00 may give a hint but the London open at 8:00 should decide it.

-
1
-
-
So after a promising 8:00 am London open 1 hour bull bar a slow steady drift back down for Dow, Dax and FTSE. Wondering if FTSE might respond to a trendline of rather dubious quality.
I hour charts >


-
1
-
-
All 4 moving sideways in a short term range (yellows), Dax retesting the bottom with at the 7:00 am Euro opening, looks to be holding.

-
1
-
-
Dax taking a second look at 11690 and gets another bounce. Can't go up because of Dow but reluctant to fall through this level, will have to if Dow keeps dropping.

-
1
-
-
Dax closing the 1 hour bar with a pin bar bounce off a retest of 11690. >...

-
1
-
-
Dow has worked it's way back up to pause at it's previous weekly support level around 25748 and Dax has done the same resting at it's previous weekly support level around 11862 having broken up through it's previous monthly support level 11700 yesterday (dark red). Nikkei and FTSE showing the same chart pattern as Dax and Dow.
From these red levels maybe looking at a short retracement but could equally see a solid push through, the London open should decide it either way.

-
1
-
-
Seeing Dax making a play on the 11700 now >...

-
1
-
-
The Dow giving an example of price just dribbling out of a triangle pattern sideways rather than exploding out up or down but is building on successive short term support levels to keep retesting resistance. Currently looking for downside below 25172 or a test up of 25484.
Dax is positioned well for a test of the old monthly support turned resistance at 11700 while FTSE looks to resistance at 7078. These two are following the recent Nikkei move up.
The Dow daily is an interesting bear pennant made up of dojis, obviously bearish but these recent moves have been more sentiment based than technical.
1 hour charts (note I have changed round the positions).
Daily Dow.


-
1
-
-
Dow puts in a doji 1 hour bar at the triangle upper line so not decisive either way. FTSE and Dax have bounced off support and hovering mid range. Looks like it's up to the US open (20 min) to make a move.

-
1
-
-
Start the week so a recap of the weekly chart and the big question is will Dow seek to retest the low at 24895 or look above for resistance? The 1 Hour shows Dow trapped in the same triangle pattern as S&P through there is a short term support level at 25200 and that level is key for the morning session.
Dax on the 7 am Euro open is looking to push lower but lacks conviction and is waiting for the London open to decide direction.


-
1
-
-
All 4 putting in something resembling an inverted head and shoulders on the 1 hour charts, with failed attempts to push lower on the last 3 candles could make for an interesting Friday afternoon.

-
1
-
-
Ah I see, no, the data is packaged by IG, it's the same on the charts on the platform, you can only scroll back so far on the 5 min chart, same for all the other time frames so if you wanted to keep seeing further back you need to keep stepping up time frames.
I believe this is done to keep control of the resources needed. They need to provide data stretching back so far and it would be a problem to provide all that for every time frame. I suspect all brokers do this, the only other prospect is to download using the IG API
This video explains how;
-
Hi @skibum84, 2 things to check.
Firstly make sure in options > chart that the Max data levels are as per pic 4 which are the same as my own settings. Both numbers.
Second, try deleting all data first then restart MT4 and then go through the download sequence again stating with the 1 min.
In pic1 I had just deleted all data and was left with just 10 days worth, then in pic2 I had re-loaded and have data back to 1997. I got the disclaimer notice each time plus a message to say there was no new data but it loaded new data all the same.


-
Dax taking off on the now, funny start on The Euro open Dax and FTSE took off in opposite directions and Dax had to shame faced turn around.
-
1
-
-
It was most disconcerting yesterday morning to find on the Dow chart that my auto fractal support/resistance drawing app had been completely overwhelmed and I was forced to draw my own **** horizontal lines. This morning the same has happened on the Dax! When will this madness end?
The FTSE has seen twice as much action out of hours of late than during a typical day with a continued drop then recovery to return to yesterday's close and similar story with the Dax which has just backed away from yesterday's high.
Not too much on the calendar today though maybe something out of the G20 meeting. China and US to start trade talks again announced overnight may provide a boost.

-
1
-


Indices
in Indices and Macro Events
Posted
Yeah, the dax is just following the dow which has it's own big support level to retest at 24895.
Dow on right.