Jump to content

Australia’s inflation rate beats expectation, ASX dips further to break long-term trendline


MongiIG

923 views

Australia's annual inflation rate rose to 3.5% in Q3, above market estimates of 3.2%.

BG_australia_aus_6169651651919191.pngSource: Bloomberg
Hebe Chen | Market Analyst, Australia | Publication date: Tuesday 25 January 2022 

The Australian Bureau of Statistics reported the nation's yearly inflation rate today.

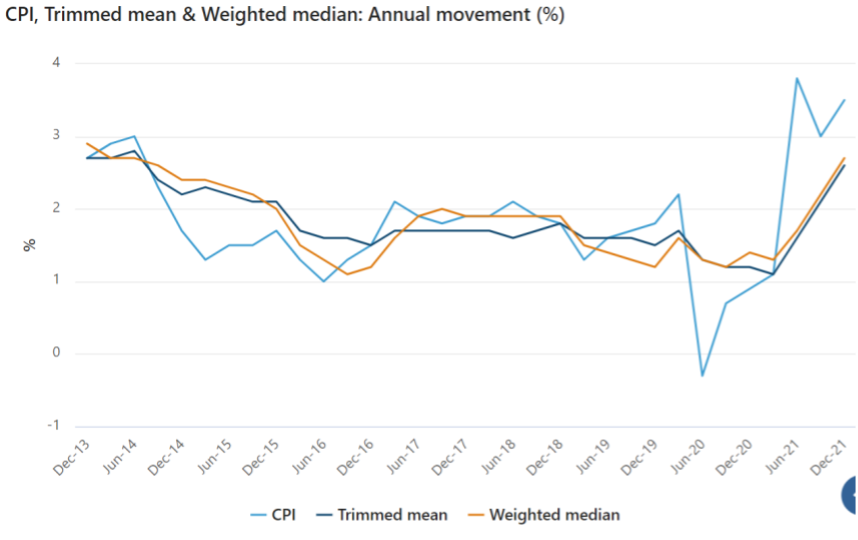
The annual inflation rate, ending December 2021, rose to 3.5% from a 3.0% in the third quarter (Q3), above market estimates of 3.2%. The reading is likely to be viewed as powerful evidence for a rate hike sooner rather than later.

Underlying inflation hit 2.6 %, ahead of the Reserve Bank of Australia's (RBA) official forecasts of 2.25% until mid-2023. The strong December reading is expected to force the RBA to rethink its monetary policy roadmap, including ending its $350 billion bond-buying programs in February and raising the current historic low cash rate two years ahead of the previous schedule.

ABS%202501.pngSource: Australian Bureau of Statistics


ASX

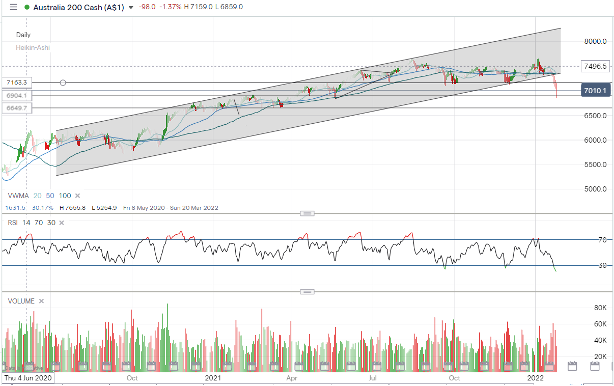
After ten consecutive days of dropping, the ASX has now broken through the trendline support from mid-2020, and the weekly RSI is at its lowest level since the pandemic started, suggesting the momentum has shifted to bearish.

Technical support can be found next at 6885, the high back to one year ago. Technical resistance can be found at 7150.

ASX%202501.pngSource: ProRealTime


AUD/USD

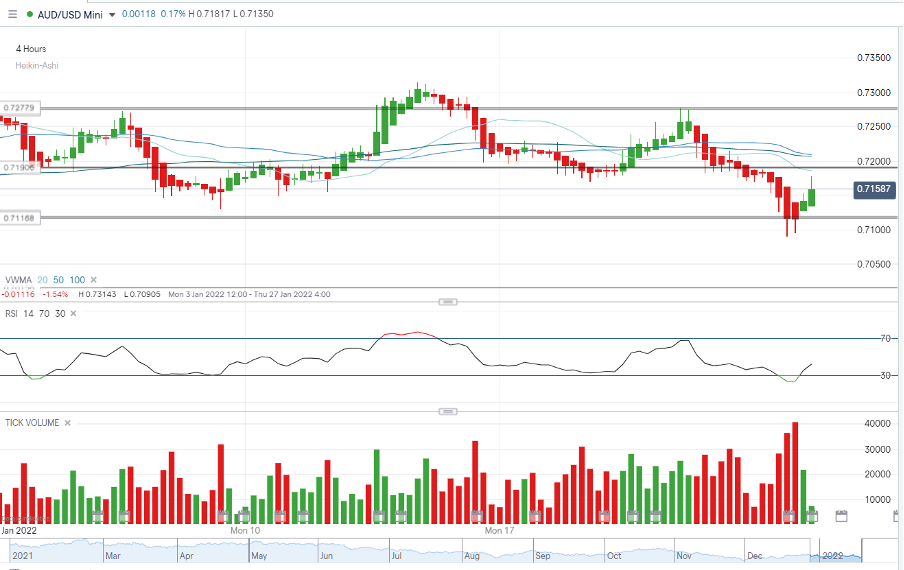
The AUD/USD pair rebounded from a four-week low following a stronger-than-expect inflation reading (referring to the 4-hour chart).

From a short-term perspective, the pair will eye the next resistance level at 0.719, coinciding with the 20 day moving average, should the trend persist.

AUDUSD%202501.pngSource: ProRealTime


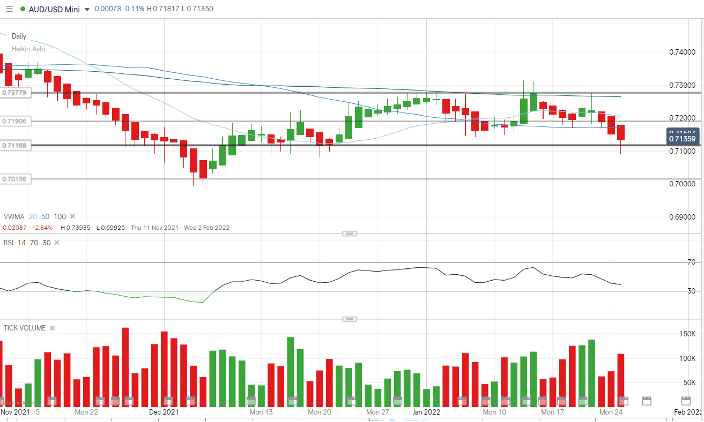
However, from a longer-term perspective, the slide from the past two weeks has brought the pair under all the major moving averages fuelled by the market’s prospect of a Federal Reserve lift-off as early as March. The concern will continue to weigh on the Aussie dollar as the greenback is anticipated to gain more support.

Based on the daily chart, the level of 0.711 is currently providing strong support, while if broken could send the pair to its yearly low at 0.7015. On the other hand, the next challenge will sit on 0.7190 for the currency pair.

AUDUSD%20daily%202501.pngSource: ProRealTime

0 Comments


Recommended Comments

There are no comments to display.

Create an account or sign in to comment

You need to be a member in order to leave a comment

Create an account

Sign up for a new account in our community. It's easy!

Register a new account

Sign in

Already have an account? Sign in here.

Sign In Now
  • Blog Statistics

    • Total Blogs
      3
    • Total Entries
      2,822
  • Latest Forum Topics

  • Our picks

    • International Workers' Day & Early May Trading Hours
      Please be advised that our opening hours will be adjusted on 1 May 2024 for International Workers’ Day and 6 May 2024 for the UK Early May Bank Holiday. Where appropriate, the times listed are in GMT.
        • Like
    • Are these the best AI stocks to watch in May 2024?
      Microsoft, Apple, Nvidia, Amazon and Meta could be the best AI stocks to watch next month. These stocks are the largest AI stocks in the US based on market capitalisation.
    • Natural Gas Commodity Elliottwave Technical Analysis
      Natural Gas


      Mode - Impulsive 


      Structure - Impulse Wave 


      Position - Wave (iii) of 5


      Direction - Wave (iii) of 5 still in play


      Details:  Price now in wave iii as it attempts to breach 1.65 wave i low. Wave (iii) is still expected to extend lower in an impulse.


      Natural Gas is currently breaching the previous April low, marking a decisive move as the impulse initiated on 5th March continues its downward trajectory, further extending the overarching impulse wave sequence that commenced back in August 2022. This decline is anticipated to persist as long as the price remains below the critical resistance level of 2.012.


      Zooming in on the daily chart, we observe the medium-term impulse wave originating from August 2022, which is persisting in its downward trend after completing its 4th wave - delineated as primary wave 4 in blue (circled) - at 3.666 in October 2023. Presently, the 5th wave, identified as primary blue wave 5, is underway, manifesting as an impulse at the intermediate degree in red. It is envisaged that the price will breach the February 2024 low of 1.533 as wave 5 of (3) seeks culmination before an anticipated rebound in wave (4). This confluence of price movements underscores the bearish sentiment prevailing over Natural Gas in the medium term.


      Analyzing the H4 chart, we initiated the impulse wave count for wave (3) from the level of 2.012, which marks the termination point of wave 4. Notably, price action formed a 1-2-1-2 structure, with confirmation established at 1.65 and invalidation set at 2.012. The confirmation of our anticipated direction materialized as price breached the 1.65 mark, signifying a resumption of bearish momentum. Presently, there appears to be minimal resistance hindering the bears, thereby reinstating their dominance in the market. It is projected that wave iii of (iii) of 5 will manifest around 1.43, indicative of the potential for the wave 5 low to extend to 1.3 or even lower. This comprehensive analysis underscores the prevailing bearish outlook for Natural Gas in the immediate future.


      Technical Analyst : Sanmi Adeagbo
       
        • Like
×
×
  • Create New...
us