Investor spotlight: Lithium major players, what’s driving demand and is now the time to invest?
We dig into the ASX-listed lithium miners to find out what’s driving demand and whether now’s the right time to invest.
Australia is the world’s largest exporter of lithium - and miners of the mineral have popped up more and more on the ASX in the past decade as global demand has surged. In this week's Investor Spotlight, we charge into the lithium space to discuss what's driving demand for the mineral, which stocks to look at to get exposed to it, and whether it's a good time to invest.
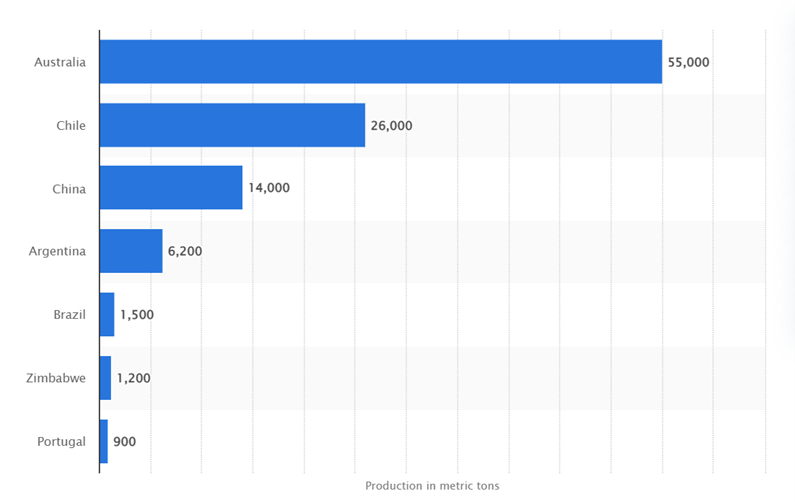
Source: IG
What's driving lithium demand?
In short: Lithium is the mineral of the future. Lithium is a core component in batteries, which as the move towards green energy gathers pace, has seen an almost exponential increase in demand. There’s scarcely a part of our modern lives that does not include lithium. Phones, laptops, watches, and medical devices all rely on batteries that contain lithium. Most important of all as the green revolution takes shape is electric vehicles.
As business and government make strides in decarbonizing global energy sources, so too has the push toward electric vehicles and more complex batteries to power them. According to studies conducted by the US government, each electric vehicle contains 8 kilograms of lithium. Multiply that by the tens of millions of electric vehicles that will likely occupy the roads in the future, and the scale of demand is astronomical.
Four ASX lithium stocks to watch
-
Pilbara Minerals

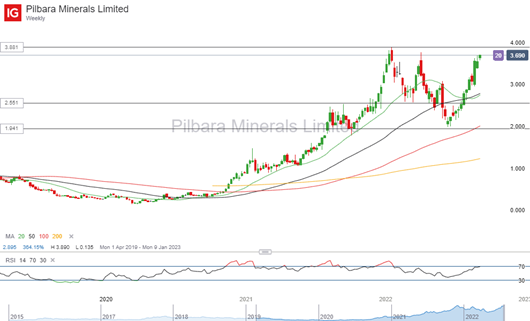
Pilbara Minerals is synonymous (for many) with Australian lithium, with the company boasting the world’s largest hard-rock lithium operation. It’s the largest lithium company on the ASX, with its $10.7B market capitalisation making it the sole large-cap play on the sector. Pilbara is the only lithium company to generate consistent profits; and has relatively extensive analyst coverage, with a consensus by rating and price target of $3.50.
When looking at the charts, price action for Pilbara Minerals looks very constructive. The stock is in a long-term uptrend, with a recent rally pushing it towards fresh record highs. A break of resistance at $3.80 would be a very bullish signal. Demand appears strong around $2.50 and just below $2.00. Drops below the 20- and 50-week moving averages have proven strong buying opportunities.
Pilbara Minerals weekly chart
Source: IG
-
Lake Resources

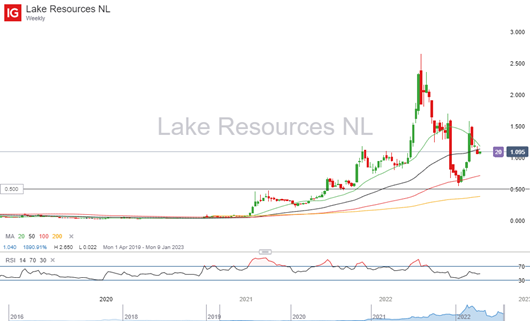
Lake Resources explores and develops lithium brine projects - accumulations of saline groundwater that are enriched in dissolved lithium - with its operations based in Argentina, one of the world’s largest sources of lithium. Lake Resources is in the middle of lithium companies as far as size but has grown considerably in recent years, with a five-year return above 2000%. There’s less analyst coverage of the company; however, of the four that do, all recommend a buy, with a price target currently of $2.56.
Although the long-term trend can be said to be to the upside, price momentum is pointing lower for Lake Resources shares. The weekly RSI is pointing lower, while the price is trading below the 20- and 50-week moving averages. Buying opportunities have emerged around the 100-week moving average, while support/resistance is around 0.50 per share.
Lake Resources weekly chart
Source: IG
-
Core Lithium

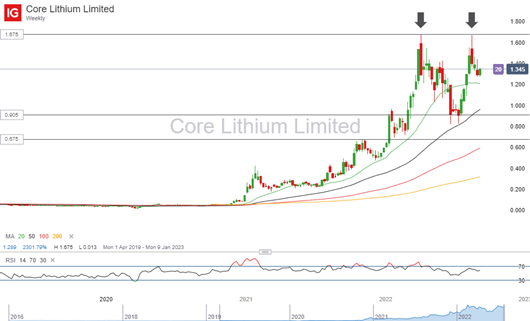
Core Lithium is a lithium exploration company, with the business positioning itself as one of Australia’s next largest lithium producers. It mines spodumene lithium - an ore in which lithium is extracted - and its main facility is located near Darwin Port. Core Lithium is one of ASX’s fastest growing Lithium plays, delivering a five-year return of 3130% to investors. The company is not yet profitable; and has limited analyst coverage, with only two brokers covering the stock. Both have a ‘buy’ rating, however, with a price target of $1.65.
A look at the technicals shows a primary uptrend for Core Lithium; however, upside momentum has moderated, with the weekly RSI trending lower. Price has carved out a double top, with significant resistance just shy of $1.70 per share. Buying support has emerged in the past around the 20-week moving average and the 50-week moving average during deeper sell-offs. Technical support also appears at around $0.90.
Core Lithium weekly chart
Source: IG
-
Sayona Mining

Sayona Mining describes itself as an emerging lithium producer with operations in Quebec and Western Australia. Although it possesses a market cap of a mid-size company at over $2 billion, the company sits at the more speculative end of the market when it comes to lithium plays on the ASX. Sayona has delivered ample returns to shareholders, with the company increasing its value by more than 2520% in the past five-years. It’s not yet profitable, however, even despite strong revenue growth, and has no analyst coverage presently.
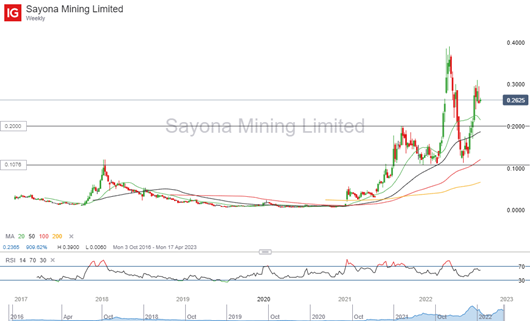
Sayona shares are in a primary uptrend, but a failure to make new all-time highs points to slowing upside momentum for the stock. Price remains above all major moving averages. However, the weekly RSI is pointing lower, though is still above the 50-mark. Technical support could be around $0.20 while a major level of support and resistance is around $0.10.
Sayona Mining weekly chart
Source: IG
Is now the time to buy lithium stocks?
Getting exposure to lithium on the ASX is a play on a megatrend. As economies move to greener forms of energy and more advanced forms of energy storage - not to mention the shift to electric vehicles - the demand for lithium can only rise. Australia is arguably the best market to invest in lithium stocks, and there’s a spread of companies that an investor can choose to add lithium to their portfolio or create a wider portfolio of lithium investments.
In the short-run, like any commodity exposed sector, lithium stocks are proving to be cyclical - and highly volatile due to the general immaturity of the market. Short-term plays on the lithium sector carry significant risk as a result, with a recent run-up in prices suggestive of unattractive entry points for a trade. The long-run trend is to the upside, and the decarbonization thematic is a powerful one. As long as the move towards greener energy continues, the outlook for lithium producers is bright.
Kyle Rodda | Market Analyst, Australia
06 September 2022


.jpeg.98f0cfe51803b4af23bc6b06b29ba6ff.jpeg)
0 Comments
Recommended Comments
There are no comments to display.
Create an account or sign in to comment
You need to be a member in order to leave a comment
Create an account
Sign up for a new account in our community. It's easy!
Register a new accountSign in
Already have an account? Sign in here.
Sign In Now