

MongiIG
-
Posts
9,899 -
Joined
-
Last visited
-
Days Won
41
Content Type
Profiles
Forums
Blogs
Events
Community Tutorials
Store
Posts posted by MongiIG
-
-
-
Dive into DAX's record-breaking run, fuelled by Eurozone inflation easing. Explore market dynamics, technical analysis, and potential risks.
 Source: Bloomberg
Last week marked a historic fifth consecutive gain for the DAX, echoing patterns not seen since October 2022.
The DAX’s gains last week were supported by a Eurozone inflation report, which showed inflation eased to 2.4% in November, its lowest level since July 2021. Core inflation fell to 3.6% in November from 4.2% in October. With disinflation in Europe playing out much like in the US, it's no surprise that the European interest rate curve is pricing in five 25bp ECB rate cuts by the end of 2024.
The UK rates market isn’t quite as excited about BoE rate cuts. Although headline inflation has fallen from 10.7% to 4.6% last month, core inflation at 5.7% is still too high. This explains why the UK rates market is pricing in just two and a half BoE rate cuts in 2024.
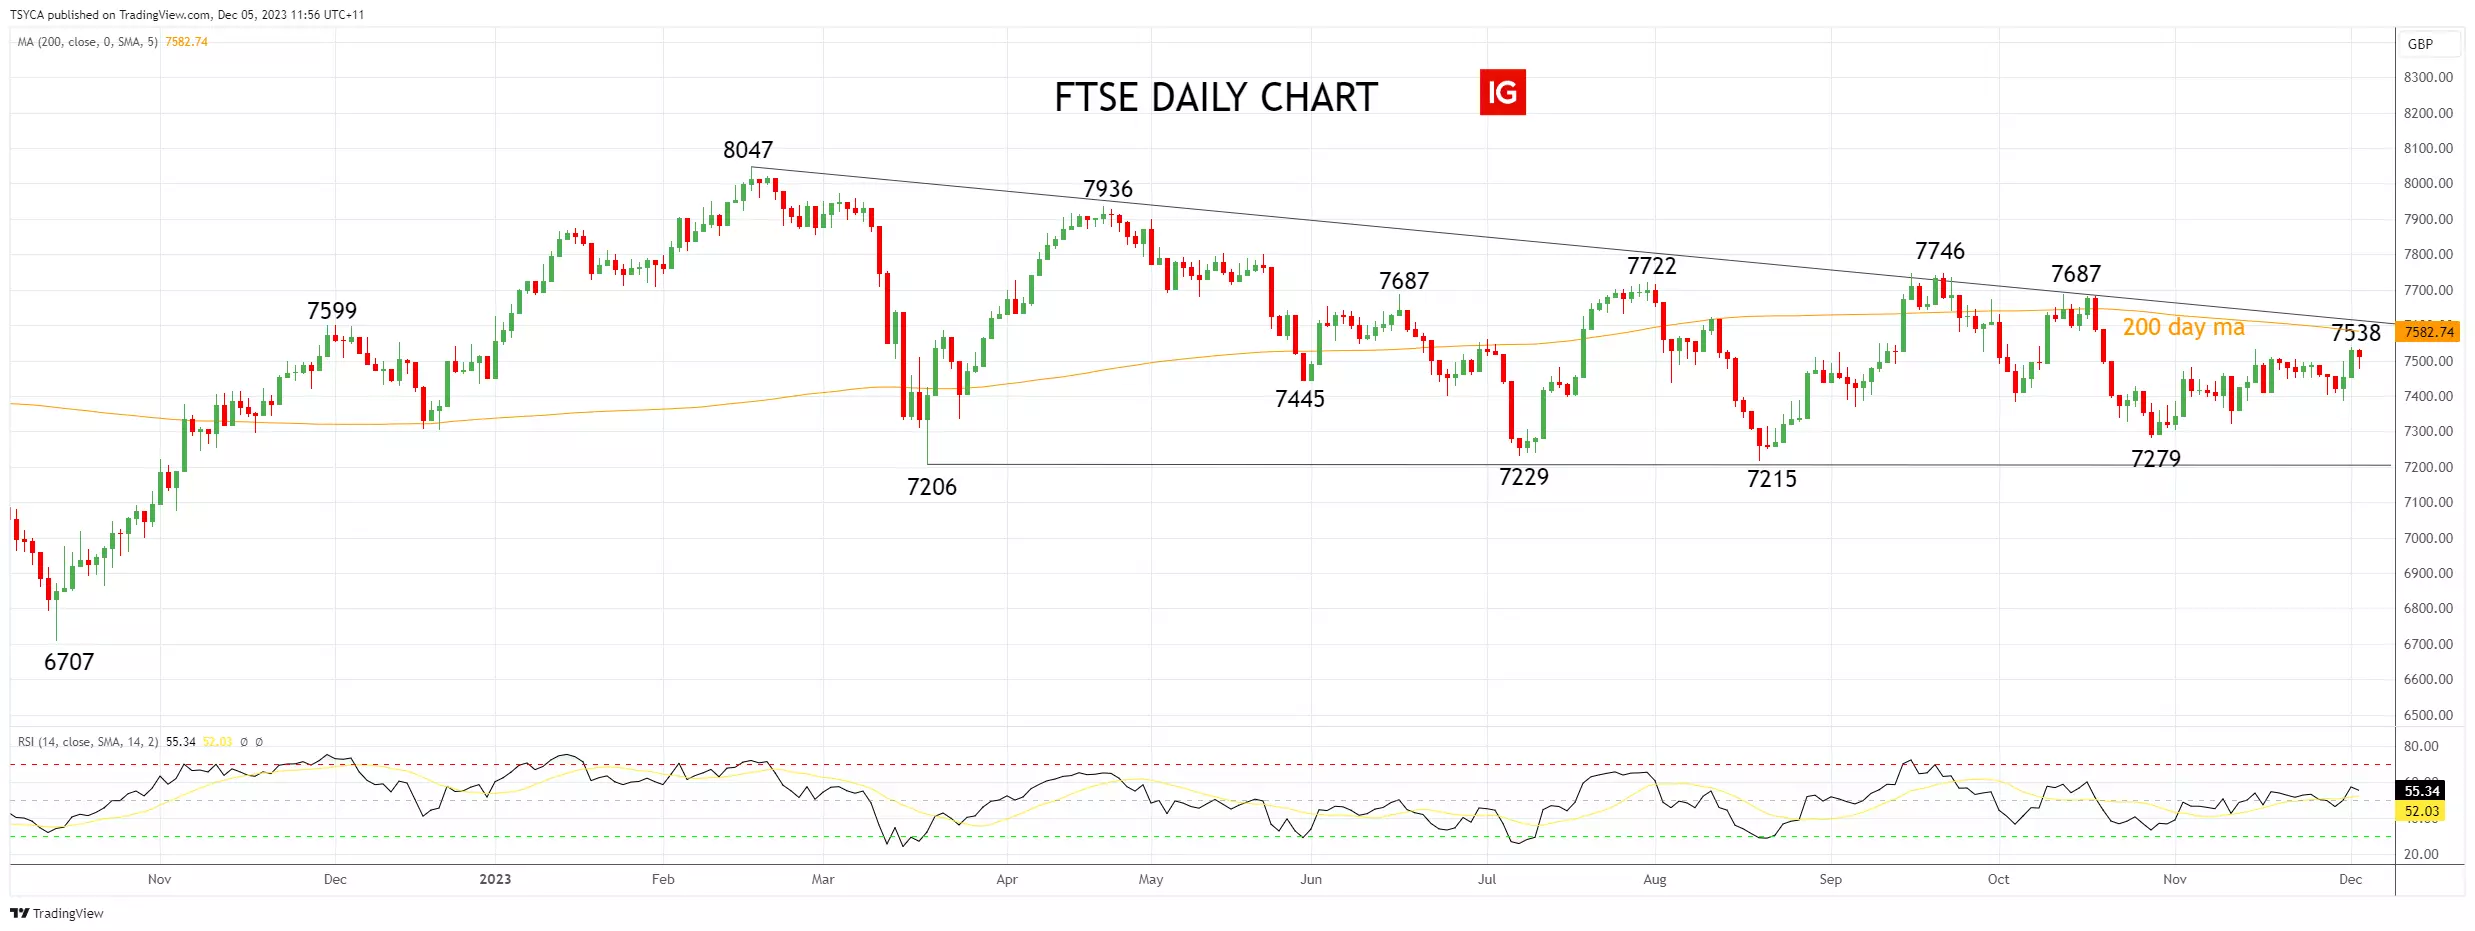
The contrasting inflation and interest rate outlook between the Eurozone and the UK helps to explain why the DAX gained 9.41% in November while the FTSE gained only 1.8% during the same time.
FTSE daily chart
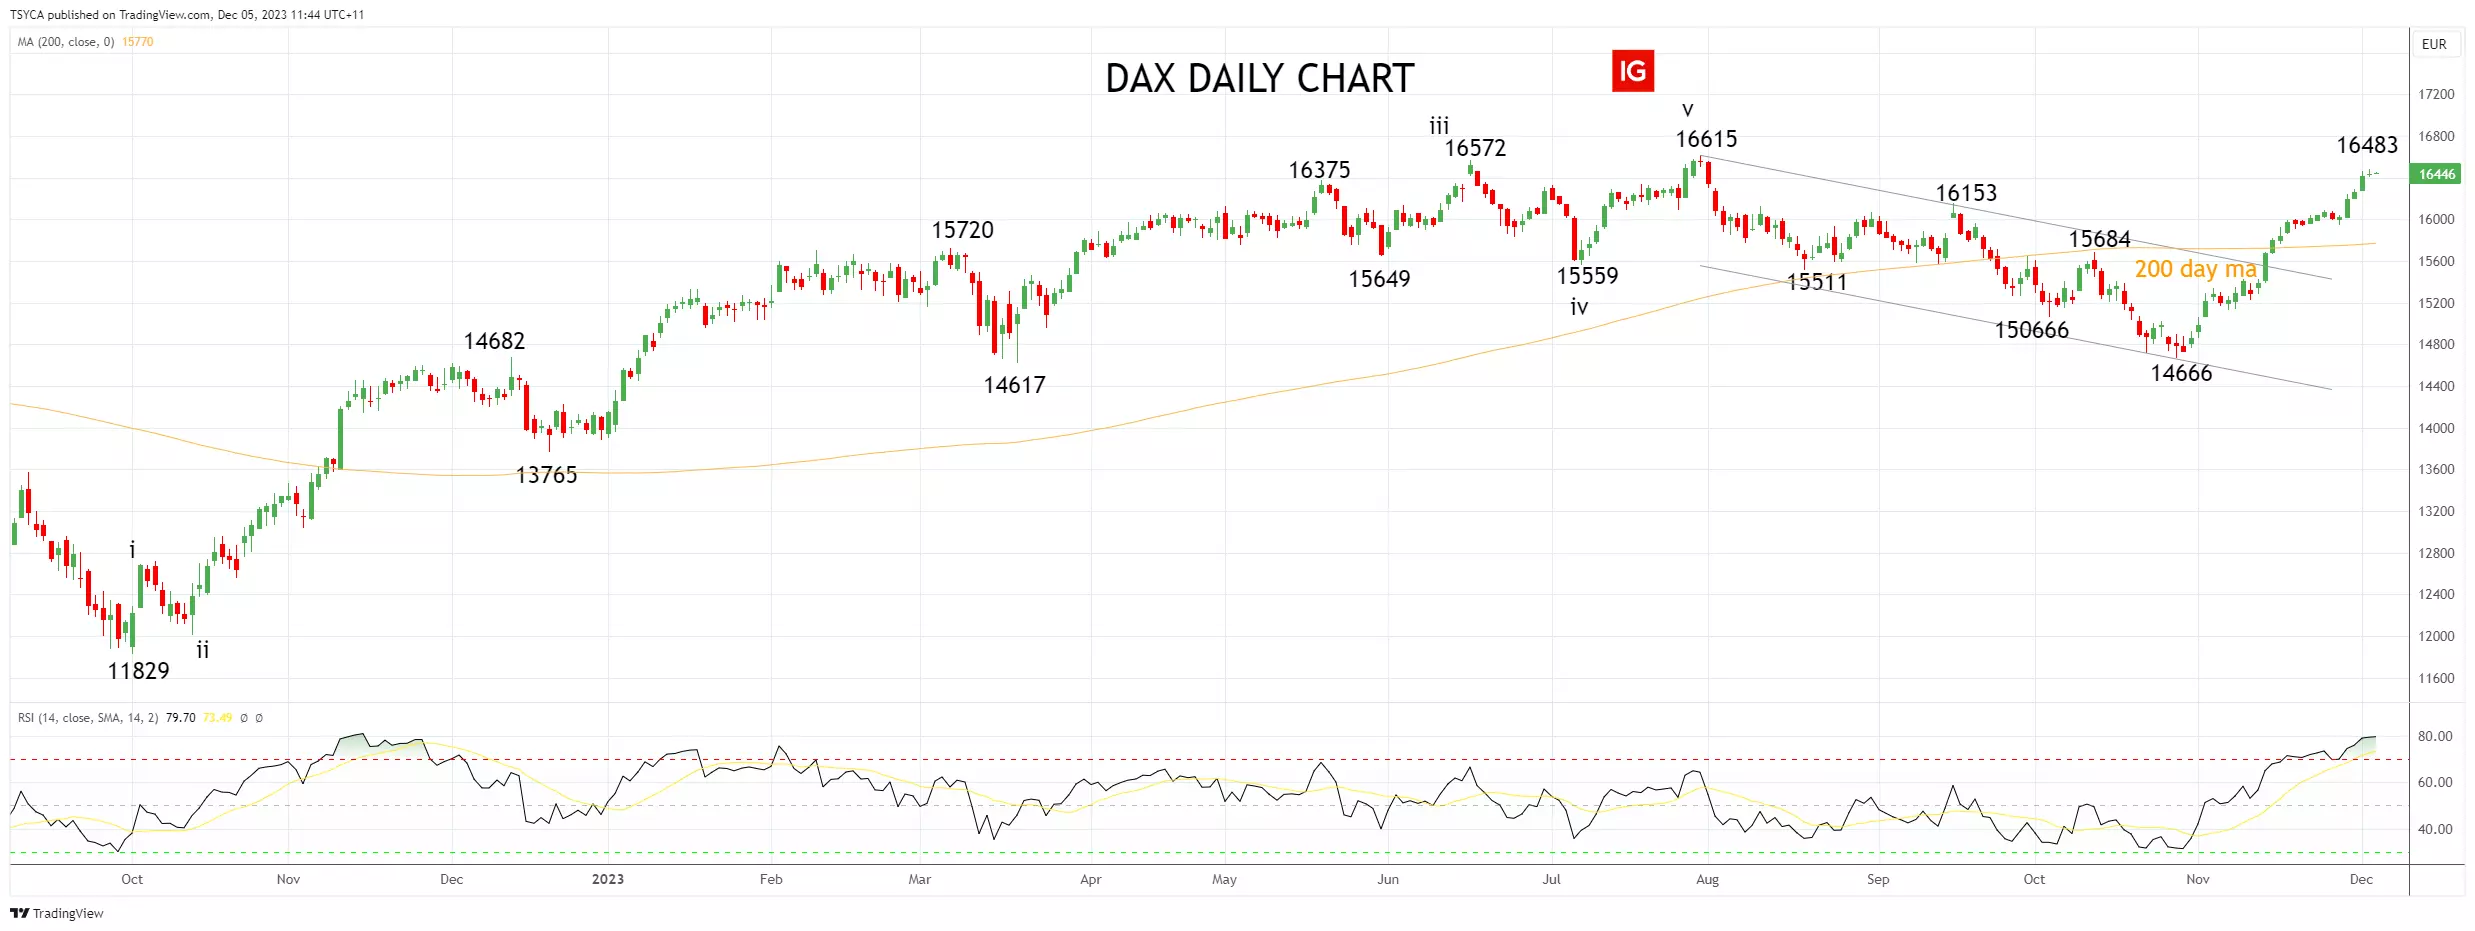
DAX technical analysis
Like its US counterpart, the S&P 500, the DAX has gotten very close, but thus far, failed to break above its year-to-date highs.
As viewed on the RSI, the DAX is at extremely overbought levels, and while we remain bullish into year-end, we would not contemplate opening fresh longs at these levels. Instead, we would prefer to use dips back towards support at 16,100/16,000, looking for the DAX to retest and break above the 16,615 July high in the weeks ahead.
Aware that a sustained break below the support of the 200-day moving average at 15782 would warn that the rally has run its course and that a deeper pullback is underway.
DAX daily chart
 Source: TradingView
- Source Tradingview. The figures stated are as of 5 December 2023. Past performance is not a reliable indicator of future performance. This report does not contain and is not to be taken as containing any financial product advice or financial product recommendation.
This information has been prepared by IG, a trading name of IG Markets Limited. In addition to the disclaimer below, the material on this page does not contain a record of our trading prices, or an offer of, or solicitation for, a transaction in any financial instrument. IG accepts no responsibility for any use that may be made of these comments and for any consequences that result. No representation or warranty is given as to the accuracy or completeness of this information. Consequently any person acting on it does so entirely at their own risk. Any research provided does not have regard to the specific investment objectives, financial situation and needs of any specific person who may receive it. It has not been prepared in accordance with legal requirements designed to promote the independence of investment research and as such is considered to be a marketing communication. Although we are not specifically constrained from dealing ahead of our recommendations we do not seek to take advantage of them before they are provided to our clients. See full non-independent research disclaimer and quarterly summary.
-
Stocks continue to trim the gains made in November. Following a lower session on Wall Street, Asian indices came under pressure. The Nikkei hit a three-week low, while the Hang Seng index touched a fresh one-year low as funds continued to flow out of Chinese indices. The RBA left rates unchanged, and the dovish tone of the statement caught some by surprise. It said that future rate changes would depend on data. In China the Caixin services PMI hit a three-month high of 51.5, but this did little to boost sentiment towards Chinese stocks. European and US markets are expected to open lower, ahead of the US ISM services PMI, and as the focus turns to the monthly US job reports this week.

-
5 minutes ago, Herb1e43 said:
Do you offer face to face training for new members?
Hi @Herb1e43
What kind of training are you referring to ?
All the best - MongiIG
-
Gold price hits new peak, and silver price makes headway, but Brent crude oil falls again
Precious metals are on the up once more following Jerome Powell’s speech on Friday, but the fallout from the OPEC meeting continues to weigh on oil prices.
 Source:Bloomberg
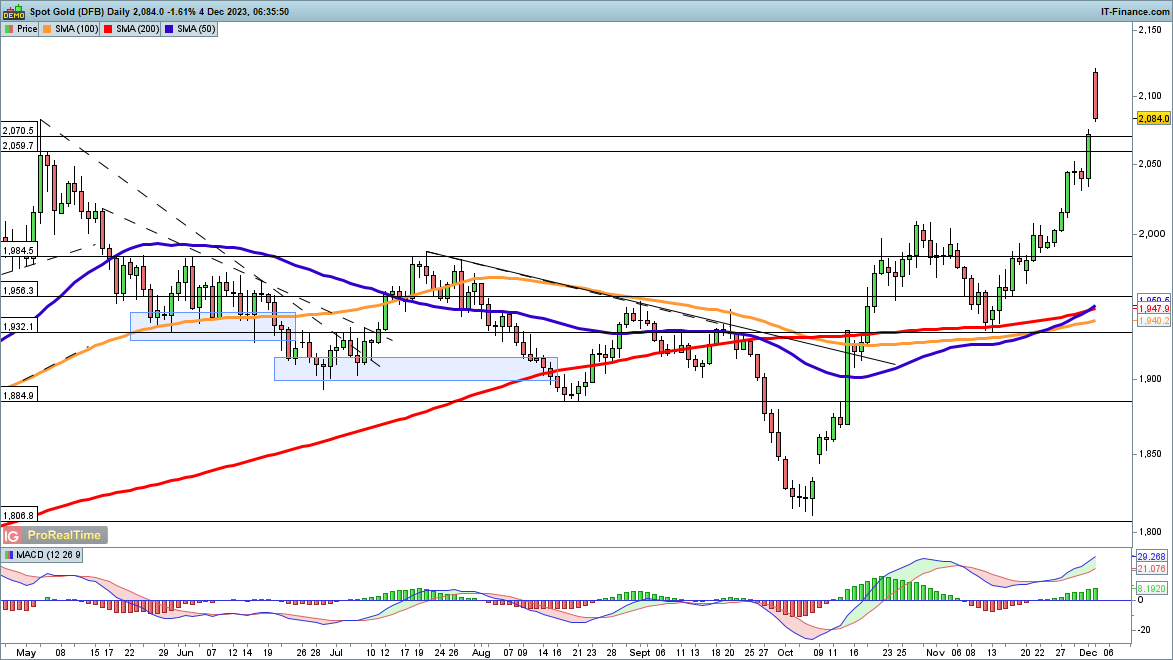
Gold surges to new peak
Gold prices shot to a new record high overnight, continuing the surge from Friday’s session. Chairman Jerome Powell’s speech on Friday left markets continuing to expect that no more Fed rate hikes are on their way. This sent gold flying and pushed the dollar lower. The move puts the price firmly above the highs seen in 2022 and 2023, but the price does look overextended in the short-term. Some consolidation around current levels, or even a short-term drop back towards $2050 might not be entirely surprising.
 Source: ProRealTime
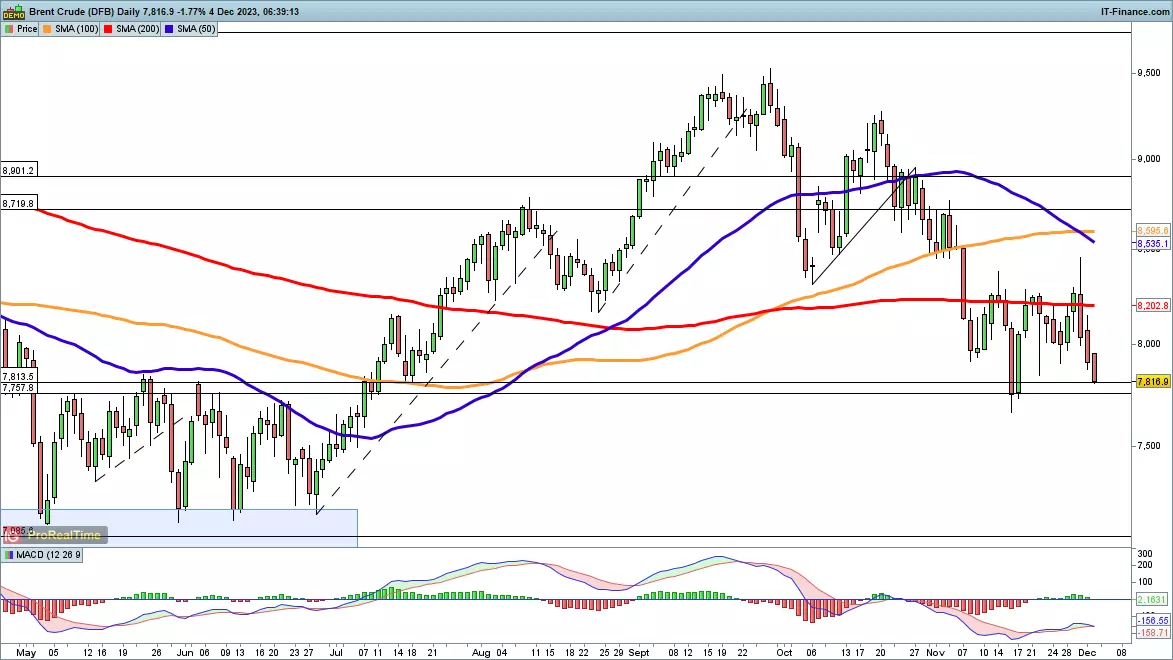
Brent falls further
OPEC’s decision to go for voluntary cuts to production last week failed to support oil prices, and now the next move appears to be a test of the November low. The past month has seen the price try and fail to hold above the 200-day SMA, and now the November low around $77.30 comes into view. Below this would see the price head back in the direction of the late Spring/early Summer lows around $72. Buyers will need a close back above $80 to suggest another attempt to challenge the 200-day SMA could develop.
 Source: ProRealTime
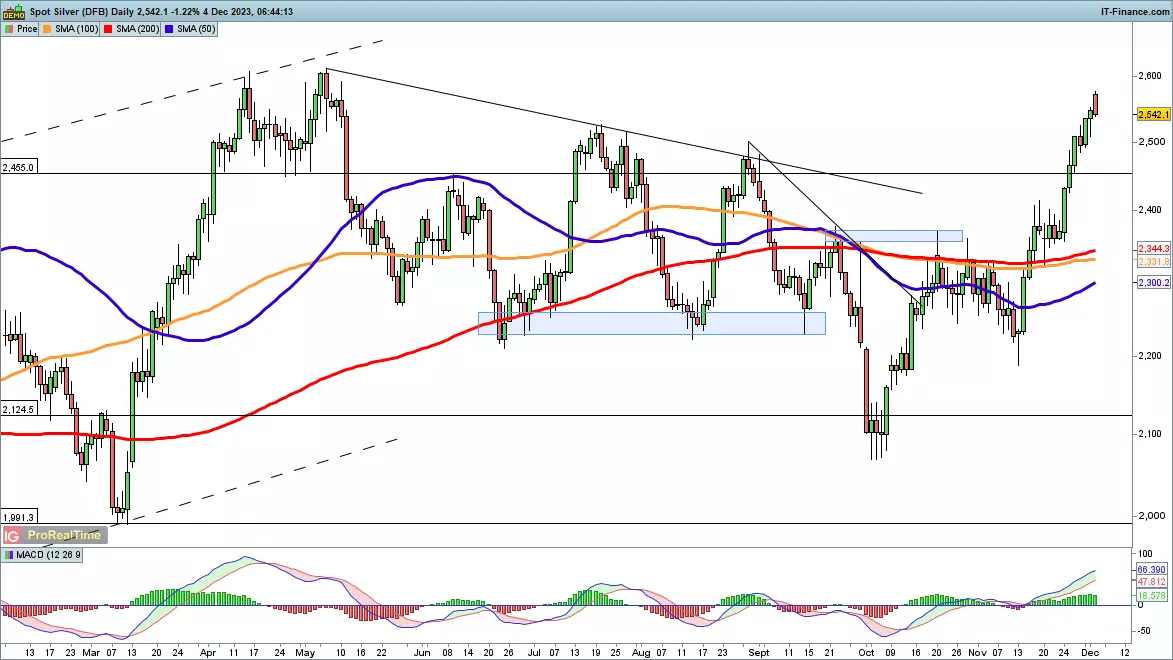
Silver hits six-month plus high
Silver’s move on Friday was not quite as exuberant as gold’s, but it still managed to hit its highest level in over six months. The rally of the past three weeks has barely halted. From a higher low in early November, when the price lagged behind its more expensive cousin, silver then surged through the 50- and 200-day SMAs. It has now cleared the August and July highs, and now the May peak around $26.20 comes into view. A move back below $25 would be needed to signal that some short-term consolidation had begun.
 Source: ProRealTime
-
On 24/11/2023 at 21:20, BashJasper said:
That's a nice analysis of the recent happenings. Only that the market sentiment doesn't seems affected and that has made people think CZ resignation might be a ploy for the platform to open up to embracing crypto regulation in US and other clime to better compete and maintain their top status in the space especially in the wake of the increased possibility of BTC spot ETF approval.
Coinbase shares rise as Bitcoin gains momentum
Coinbase shares rose 9% on Monday morning on the IG Platform as Bitcoin also gained momentum in the cryptocurrency world.
November marked a second straight month of gains for Bitcoin, which benefited from rising prospects of the US Federal Reserve cutting interest rates next year. Also, traders are anticipating the imminent approval of a US Bitcoin exchange traded fund.
Coinbase
Coinbase, a popular trading platform, has seen almost a 9% rise in the value of its shares on the IG platform. This increase can be directly linked to the growing value of Bitcoin, a well-known cryptocurrency. Bitcoin has been on the rise throughout November, and this upward trend is the second month in a row that it has seen gains.
The US Federal Reserve
One of the main reasons for Bitcoin's rise in value is the increasing likelihood of rate cuts by the US Federal Reserve in the coming year. These rate cuts are meant to stimulate economic growth and prevent a potential recession. As a result, many investors are turning to Bitcoin as an investment option. They see it as an appealing alternative to traditional assets like stocks and bonds.
Bitcoin-based exchange-traded funds
Additionally, traders are eagerly waiting for the approval of Bitcoin-based exchange-traded funds (ETFs) in the US stock market. ETFs would provide a regulated and convenient way for investors to gain exposure to Bitcoin. This approval would also attract a wider range of market participants, further legitimizing Bitcoin as a mainstream investment.
Coinbase shares
Overall, the surge in Coinbase shares is a reflection of the positive market sentiment towards Bitcoin and the excitement surrounding its future prospects. These factors have not only attracted new investors to the cryptocurrency market but have also reinforced the long-term viability of Bitcoin as an investment asset. In conclusion, Coinbase has seen a significant increase in its shares due to the rise in Bitcoin's value, driven by the prospects of rate cuts and the expected approval of Bitcoin ETFs. These events have generated positive market sentiment and brought new investors into the cryptocurrency world.
This information has been prepared by IG, a trading name of IG Markets Limited. In addition to the disclaimer below, the material on this page does not contain a record of our trading prices, or an offer of, or solicitation for, a transaction in any financial instrument. IG accepts no responsibility for any use that may be made of these comments and for any consequences that result. No representation or warranty is given as to the accuracy or completeness of this information. Consequently any person acting on it does so entirely at their own risk. Any research provided does not have regard to the specific investment objectives, financial situation and needs of any specific person who may receive it. It has not been prepared in accordance with legal requirements designed to promote the independence of investment research and as such is considered to be a marketing communication. Although we are not specifically constrained from dealing ahead of our recommendations we do not seek to take advantage of them before they are provided to our clients. See full non-independent research disclaimer and quarterly summary.
-
What is your view on Bitcoin – bullish or bearish?
-

Dec 4, 2023 12:02 PM +02:00
Nick Cawley, DailyFX Senior Strategist
BITCOIN (BTC) PRICES, CHARTS, AND ANALYSIS:- Bitcoin (BTC) eyes resistance at $43k.
- Spot ETF narrative continues to drive Bitcoin and Ethereum
Bitcoin and Ethereum both took a significant leg higher over the weekend, breaking through prior resistance and testing levels last seen in May last year. The cryptocurrency space has been positive for the past few weeks as investors wait for news on the dozen spot Bitcoin ETF applications sitting on the SEC’s desk. A CNBC report last week that SEC representatives met with BlackRock and Grayscale further boosted the bullish market sentiment. BlackRock has filed for both a Bitcoin and an Ethereum spot ETF and their involvement in the space is seen as important. BlackRock has had 575 out of 576 of its ETF applications approved.Bitcoin (BTC) Continues to Rally as Spot ETF Chatter Gets Louder
The technical outlook for Bitcoin has been positive since mid-October when BTC/USD produced a bullish pennant pattern. This coincided with a bullish 50-day/200-day moving average crossover – Golden Cross - and was subsequently followed by a series of higher lows. Prior highs at $38k and $40k have both been broken with ease in the last four sessions. The next level of horizontal resistance comes in just under $43k.
BITCOIN (BTC/USD) DAILY PRICE CHART – DECEMBER 4

Charts via TradingView
Ethereum has underperformed Bitcoin this year but has still rallied from around $1,200 to $2,260 since the start of the year. The ETH/USD charts also remains positive with a Golden Cross produced on November 21st and a clear series of higher lows seen since late October. Last Friday’s clean break of resistance at $2,140 opens the way for ETH to rally further with $2,500 and then $3,000 the next logical stopping points.ETHEREUM (ETH/USD) DAILY PRICE CHART – DECEMBER 4

Charts via TradingViewWhat is your view on Bitcoin – bullish or bearish?
-
FTSE 100 stalls while DAX 40, S&P 500 near July highs
Outlook on FTSE 100, DAX 40 and S&P 500 ahead of this week’s US unemployment data.
 Source: Bloomberg
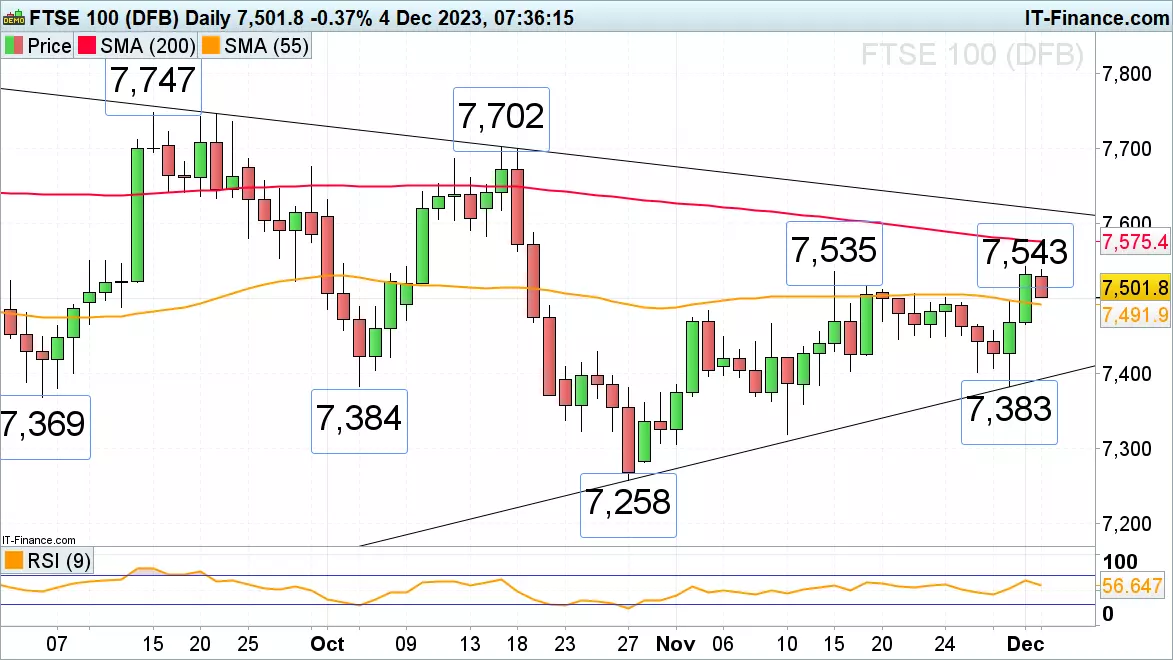
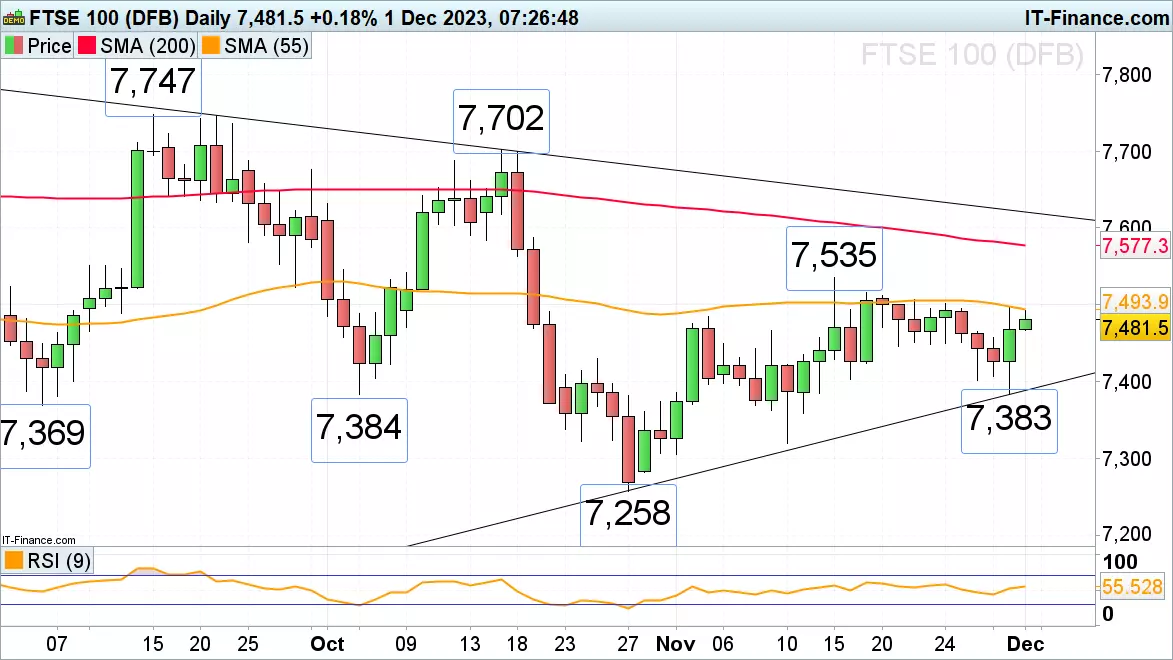
FTSE 100 comes off six-week high
The FTSE 100 is seen coming off last week’s six-week high at 7,543 as investors await more data this week to guide the economic and monetary policy outlook. The 55-day simple moving average (SMA) at 7,492 may be revisited, together with the early November high at 7,484. While Friday’s low at 7,466 underpins, the recent overall upside pressure should remain intact. Failure there would put the major 7,384 to 7,369 September, early October and late November lows back on the cards. Key resistance remains to be seen at the November and current December highs at 7,535 to 7,543. Above it meanders the 200-day simple moving average (SMA) at 7,575.
 Source: ProRealTime
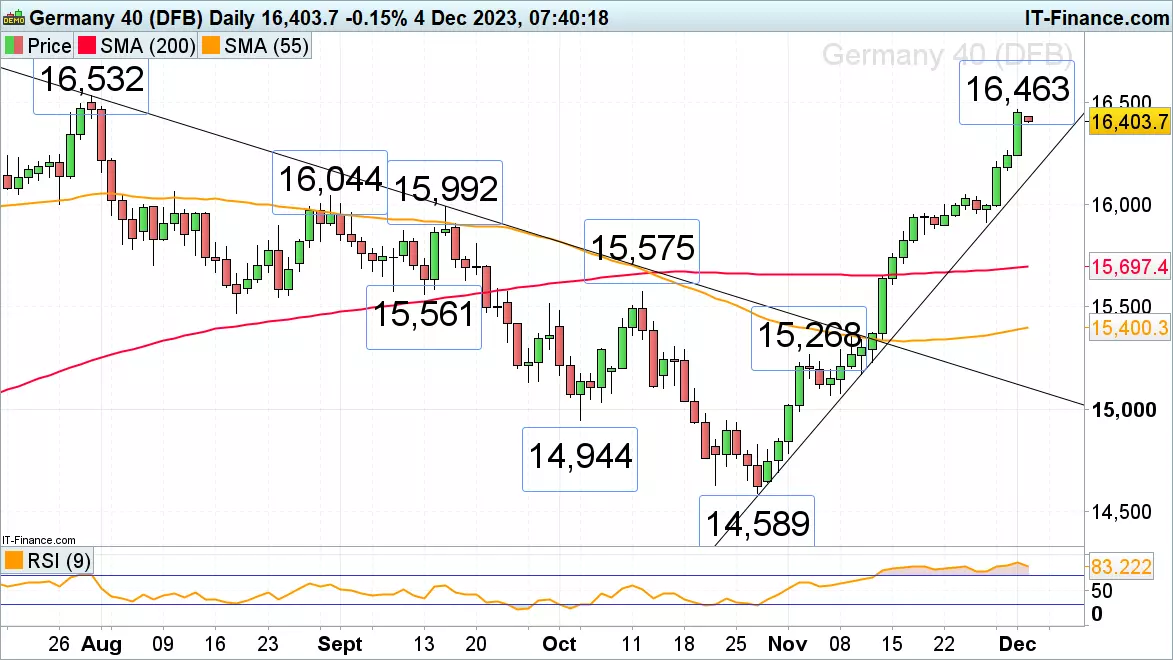
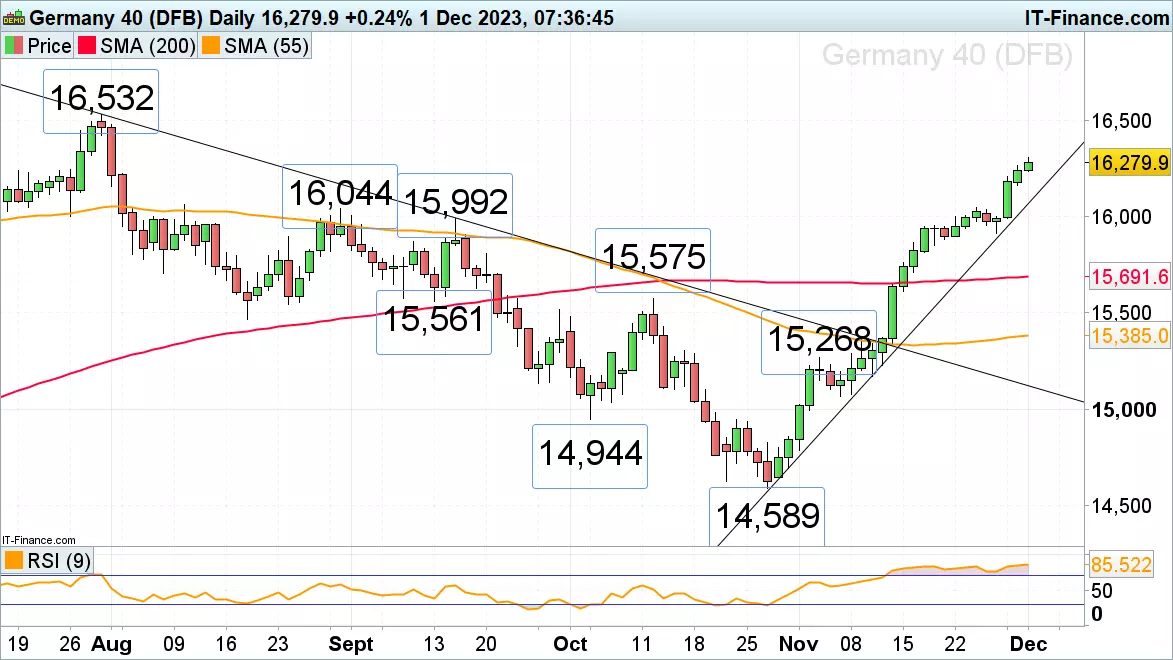
DAX 40 nears July peak
The DAX 40 continues to rally following softer German and eurozone inflation data last week. The index is getting ever closer to its 16,532 July peak around which it is likely to at least short-term stall. If not, a new all-time record high will be made. Immediate upside pressure will be maintained while no slip through Friday’s low at 16,237 is seen. Below it lies last Thursday’s 16,165 low. More significant support can be seen between the August and September highs at 16,044 to 15,992.
 Source: ProRealTime
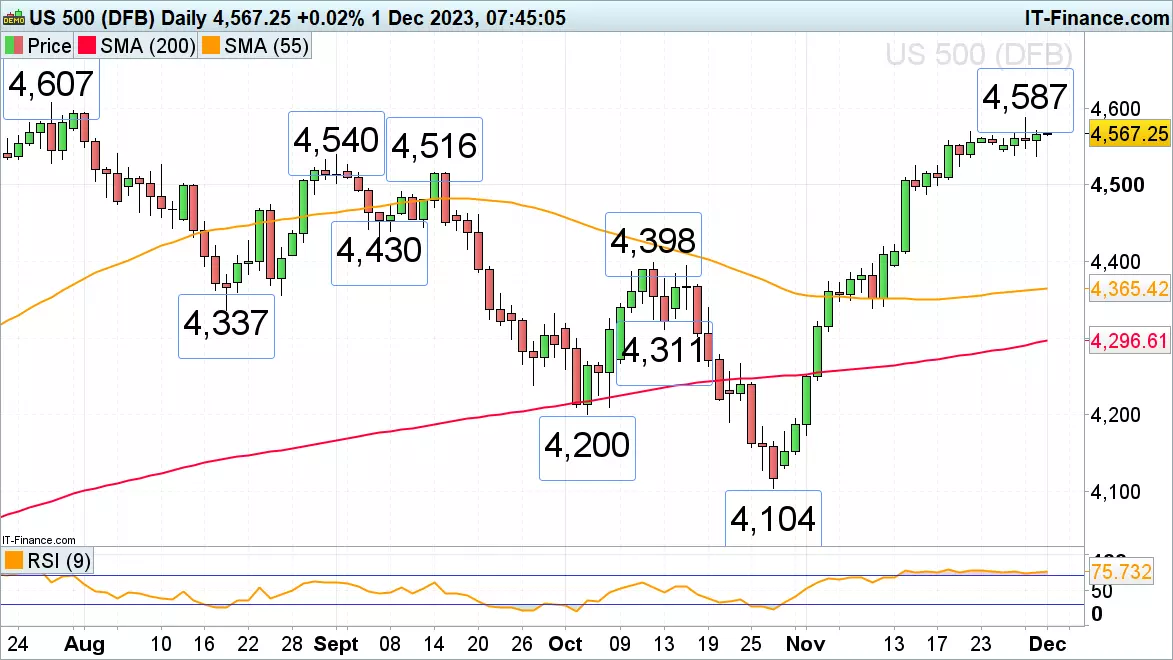
S&P 500 approaches July high
The November advance in the S&P 500 is ongoing with the July peak at 4,607 being within reach despite US Treasury yields regaining some of their recently lost ground. Around this high, the index may short-term consolidate. Once overcome, though, the March 2022 peak at 4,637 will be in focus. Minor support can be seen at the 22 November high at 4,569 and more important support between last week’s lows at 4,539 to 4,537. Slightly further down sits support at the 4,516 mid-September high.
 Source: ProRealTime
-
10 hours ago, Carl-Gustav said:
Here we go!!! Gold making record highs 🚀🚀🚀
-
 1
1
-
-
Gold continues to push above the $2000 per ounce level, reaching $2,147 on Monday. The surge has been thanks to the downtrend in the US dollar and geopolitical uncertainty.
With investors turning to the widely considered safe-haven asset. Gold is also being fuelled by expectations that the US Federal Reserve will not raise interest rates further and the markets have priced in a potential interest rate cut as early as March. Meanwhile silver is following a similar trajectory, also continuing to climb higher, back at a level also not seen since May this year, above $2000 again.
The price of gold
The price of gold has gone beyond the $2,000 mark, reaching an impressive $2,147 per ounce. Currently, it hovers at around $2,075, showing a small increase of 0.16% for the day. This is the first time since May that gold has reached this level. The rise in gold prices can be attributed to a couple of factors: the weakening of the US dollar and geopolitical uncertainty. These factors have made investors turn to gold as a safe-haven asset. Moreover, there are expectations that the Federal Reserve will not raise interest rates any further, and there is even the possibility of an interest rate cut as early as March. These expectations have further fueled the increase in gold prices.
The US dollar
Similarly, silver has been following a similar price trend as gold and has reached levels not seen since May. However, it has not yet beat its previous record of $2,613 per ounce. At the moment, silver is down 0.75%. Overall, both gold and silver are experiencing a rise in their prices. Gold has managed to exceed the $2,000 mark and reach new heights. This surge is due to various reasons, including the weakened USD, uncertainties in geopolitical situations, and expectations of interest rate cuts. Although silver has not surpassed its previous record, it is also on the rise.
The Federal Reserve
To put it in simpler terms, the price of gold has broken a significant milestone, surpassing $2,000 for the first time in several months. This surge is driven by factors like the weakening US dollar and general uncertainty in world affairs. Investors find solace in gold during times of trouble, making it a popular choice. Additionally, expectations of the Federal Reserve reducing interest rates further have also contributed to the rise in gold prices. Similarly, silver is following a similar trajectory and has reached impressive levels, although it has not yet beaten its previous record. Both gold and silver are undergoing a price increase, making them hot commodities in the market.
This information has been prepared by IG, a trading name of IG Markets Limited. In addition to the disclaimer below, the material on this page does not contain a record of our trading prices, or an offer of, or solicitation for, a transaction in any financial instrument. IG accepts no responsibility for any use that may be made of these comments and for any consequences that result. No representation or warranty is given as to the accuracy or completeness of this information. Consequently any person acting on it does so entirely at their own risk. Any research provided does not have regard to the specific investment objectives, financial situation and needs of any specific person who may receive it. It has not been prepared in accordance with legal requirements designed to promote the independence of investment research and as such is considered to be a marketing communication. Although we are not specifically constrained from dealing ahead of our recommendations we do not seek to take advantage of them before they are provided to our clients. See full non-independent research disclaimer and quarterly summary.
-
1
-
-
US employment data will be in focus this week with a set of indicators that could give us more clues on what the US Federal Reserve will do next with interest rates.
On Tuesday, JOLTs job openings are forecast to fall to 9.35 million in October. On Wednesday, the ADP survey should show that 128,000 jobs have been created in the private sector in November – and on Friday, its non-farm payrolls (NFPs). Economists anticipate 180,000 job creations in November. That is 30,000 more than in October, but 30,000 is also the number of workers that have returned to work from the UAW strikes. A soft job report would reinforce the message that the Fed's work is done.
The US employment data
This week, we’re focusing on the US employment data, which will give us a better idea of what the Federal Reserve might do next. Experts think that this data will show more problems in the job market. On Tuesday, we'll get the jolts job openings report, which is expected to show a drop to 9.35 million job openings in October. Then on Wednesday, the Automatic Data Processing (ADP) survey will probably tell us that about 128,000 new private sector jobs were created in November. This is better than the previous month, but still one of the weakest months of the year. Finally, on Friday, the non-farm payrolls report is likely to say that about 180,000 new jobs were added in November, which is 30,000 more than in October. However, this number includes 30,000 workers who went back to work after going on strike. If the job report is weak, it would mean that the Federal Reserve has done all they can to fix things.
The US dollar
On the other hand, if the numbers are better than expected, it could make the USD stronger. Looking at the US dollar price chart, it's showing slight improvements right now, even though it had three weeks of losses recently. Currently, it's up by 0.23% compared to other major currencies today. To sum it up, the upcoming US employment data will give us more information about the job market and will affect what the Federal Reserve does next. Economists think this data will show more problems in employment. If the job report is not good, it would support the idea that the Federal Reserve has done what they can. But if the numbers are better than expected, it could make the US dollar stronger.
This information has been prepared by IG, a trading name of IG Markets Limited. In addition to the disclaimer below, the material on this page does not contain a record of our trading prices, or an offer of, or solicitation for, a transaction in any financial instrument. IG accepts no responsibility for any use that may be made of these comments and for any consequences that result. No representation or warranty is given as to the accuracy or completeness of this information. Consequently any person acting on it does so entirely at their own risk. Any research provided does not have regard to the specific investment objectives, financial situation and needs of any specific person who may receive it. It has not been prepared in accordance with legal requirements designed to promote the independence of investment research and as such is considered to be a marketing communication. Although we are not specifically constrained from dealing ahead of our recommendations we do not seek to take advantage of them before they are provided to our clients. See full non-independent research disclaimer and quarterly summary.
-
US markets surged in November, fueled by falling rates. As December unfolds, can the momentum persist amid economic data uncertainties?
 Source: Bloomberg
US stock markets kicked off a new month in style, as fixed income and equity markets reacted to the more dovish elements within Fed chair Jerome Powell's speech, including rates being "well into restrictive territory."
Before we look at what the year's final month might bring, it's worth revisiting some of November's key highlights.
- US two-year note yields fell 41 bp from 5.09% to 4.68%
- US 10-year note yields fell 60bp from 4.93% to 4.33%
- US rates markets are now pricing 125bp of Fed rate cuts in 2024
- The Nasdaq gained 10.67%
- The S&P500 gained 8.92%
- The Dow Jones gained 2898 points or 8.77%
Can the November rally extend into December?
The correlation is clear. US equity markets ripped higher in November, driven by falling rates. Behind the fall in rates was a dovish pivot by the Federal Reserve and a patch of cooler data. Rarely, if ever, has a central bank executed such an exquisitely timed pivot.
With November's astonishing moves as the starting point for December, the risk-reward of expecting more of the same has reached a more extreme point. While inflation data has been cooler in recent weeks, the market will want to see labour market data this week to support the cooling narrative and another leg higher in equities into year-end.
What is expected from Jolts and Non-Farm Payrolls data?
JOLTS Job Openings – The market expects job openings to decrease in October to 9.3 million from 9.55 million in September. NB While considered an accurate gauge of the labour market, JOLTS runs one month behind NFP.
Non-Farm Payrolls - The market expects a gain of 180,000 jobs in November, up from 150,000 in October. The unemployment rate is expected to hold steady at 3.9%, and average hourly earnings to ease to 4% YoY from 4.1% in October.
If either of these job numbers is much hotter than expected, it will likely cause the rates market to have second thoughts around the timing of Fed rate cuts, with the first cut currently fully priced for May.
US unemployment rate chart
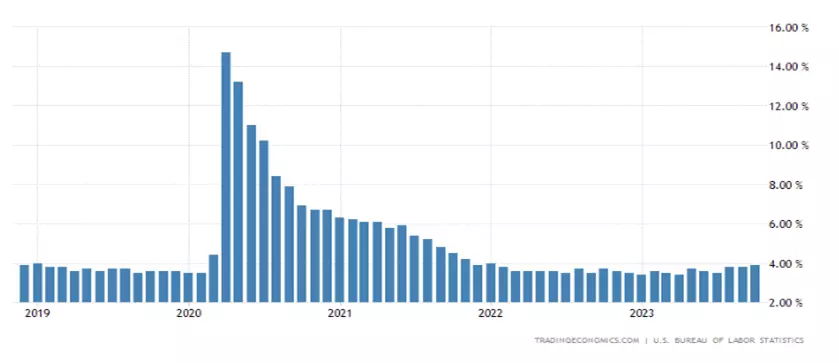 Source: TradingEconomics
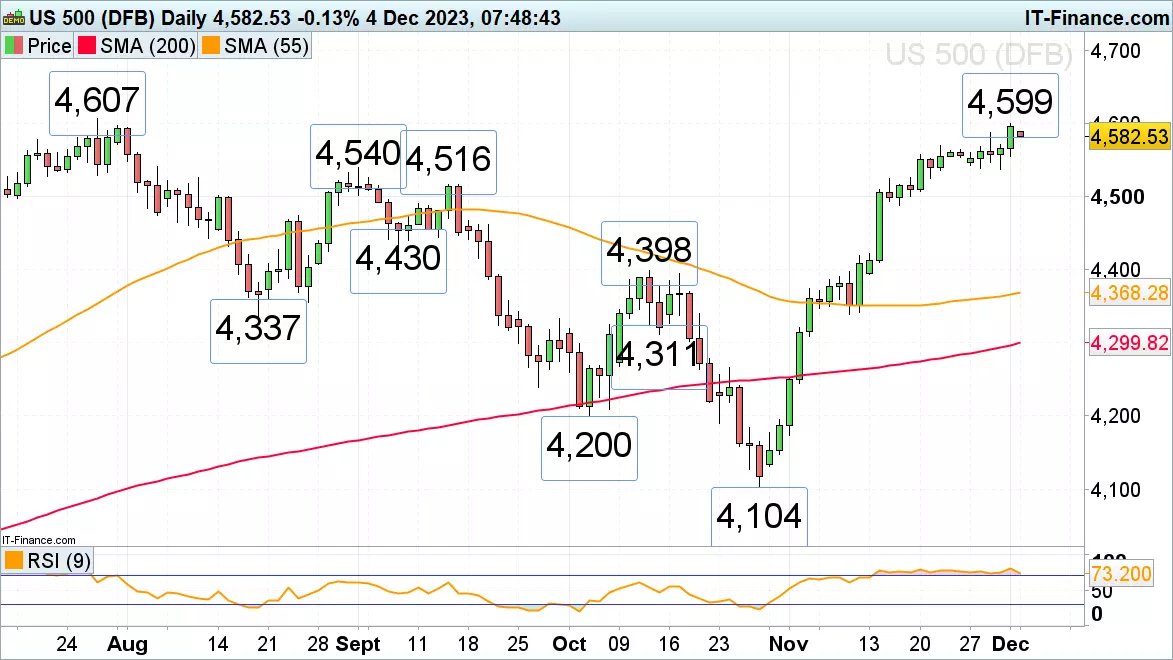
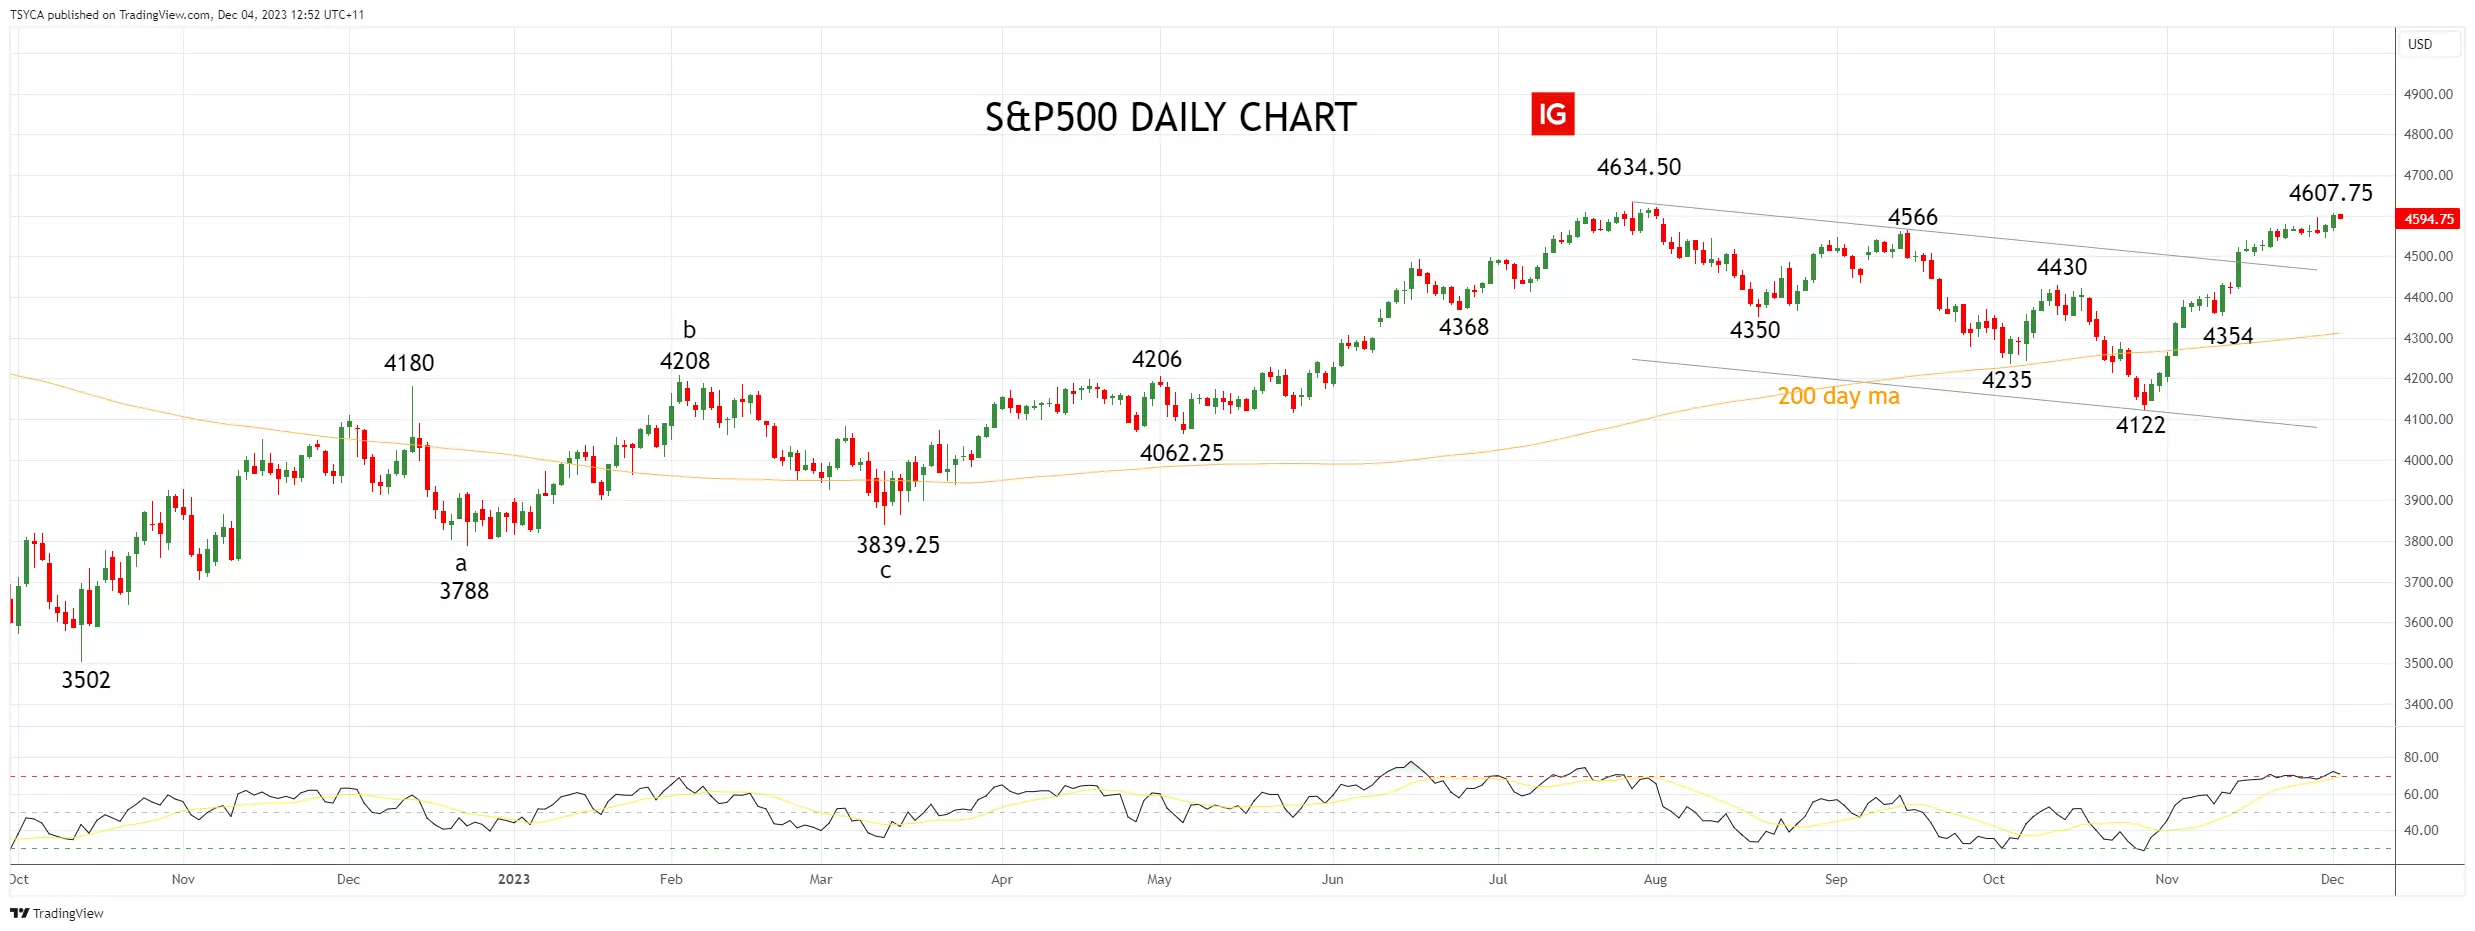
S&P 500 technical analysis
The S&P 500 remains the only one of the three key indices yet to break above its year-to-date highs.
While we remain bullish into year-end, we would not contemplate opening fresh longs at these levels. Instead, we would prefer to use dips back towards support at 4450/30, in anticipation of a retest and break of the July 4634.50 high. Above the 4634.50 high there is blue sky towards the November 2021, 4740.50 high, followed by the January 2022, 4808 high.
Aware that a sustained break below the support of the 200-day moving average at 4312 would warn that the rally has run its course, and that a deeper pullback is underway.
S&P 500 daily chart
 Source: TradingView
Nasdaq technical analysis
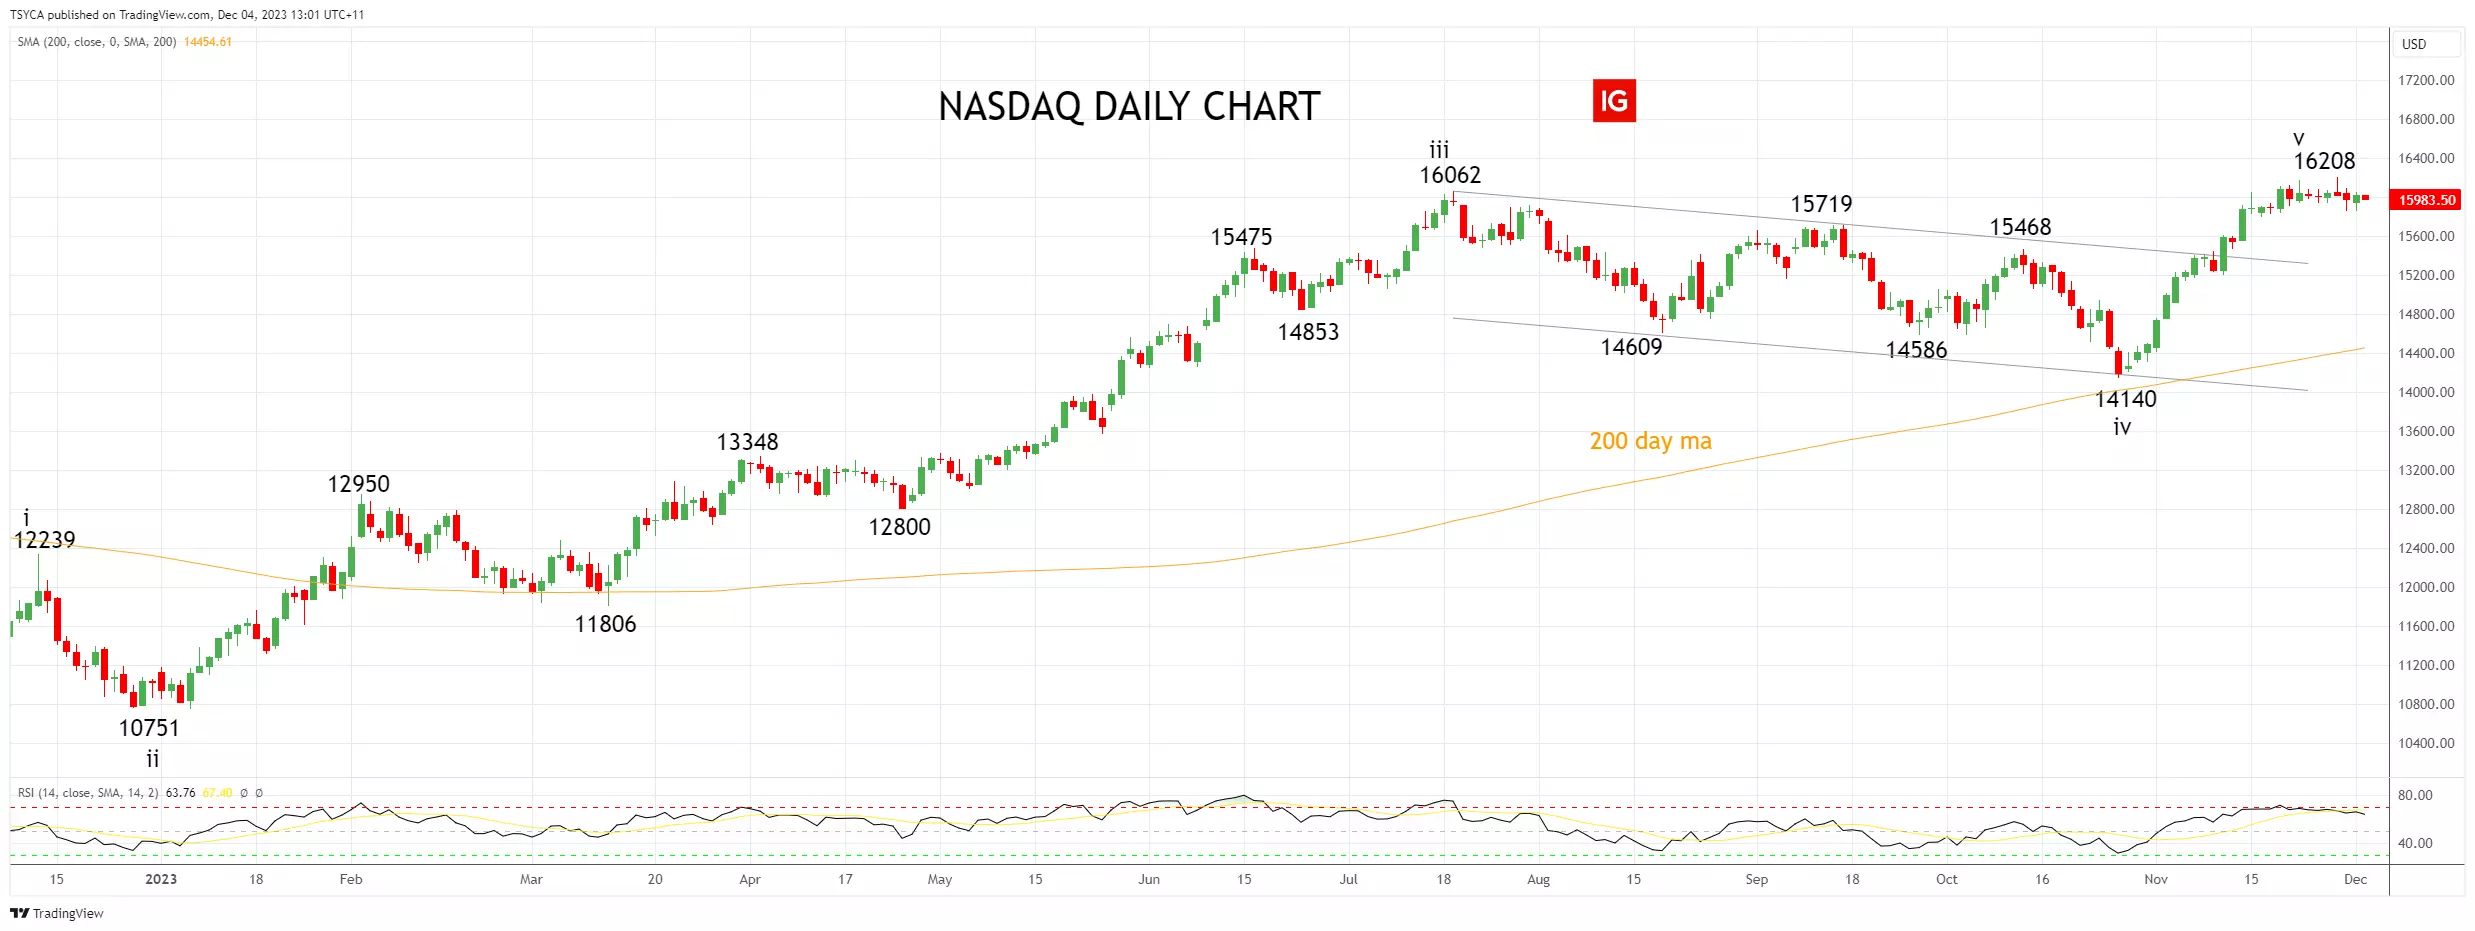
The Nasdaq has followed the road map to perfection in recent months, bottoming as expected in the 14,200/14,000 support zone, before a stunning recovery to new highs.
Although we remain bullish into year-end, we would not contemplate opening fresh longs at these levels. Instead, we would prefer to use dips back towards support in the 15,700/450 area in anticipation of a push towards 16,400/500.
Aware that should the Nasdaq see a sustained break of support at 15,450, it would warn that the rally has run its course and that a deeper pullback is underway towards the 200-day moving average at 14,450.
Nasdaq daily chart
 Source: TradingView
- Source Tradingview. The figures stated are as of 4 December 2023. Past performance is not a reliable indicator of future performance. This report does not contain and is not to be taken as containing any financial product advice or financial product recommendation.
This information has been prepared by IG, a trading name of IG Markets Limited. In addition to the disclaimer below, the material on this page does not contain a record of our trading prices, or an offer of, or solicitation for, a transaction in any financial instrument. IG accepts no responsibility for any use that may be made of these comments and for any consequences that result. No representation or warranty is given as to the accuracy or completeness of this information. Consequently any person acting on it does so entirely at their own risk. Any research provided does not have regard to the specific investment objectives, financial situation and needs of any specific person who may receive it. It has not been prepared in accordance with legal requirements designed to promote the independence of investment research and as such is considered to be a marketing communication. Although we are not specifically constrained from dealing ahead of our recommendations we do not seek to take advantage of them before they are provided to our clients. See full non-independent research disclaimer and quarterly summary.
-
20 hours ago, Richierich said:
Hi, any thoughts on if now is good time to buy / likely return?
Hi @Richierich
Nationwide says UK house prices up again.
House prices recorded a second month of growth, across the UK, in November, according to the Nationwide Building Society. -
US stocks had a strong end to last week, rallying in the wake of a speech by Jerome Powell. While the Fed chair was keen to stress that rate cuts were not on the table and that more hikes could come if needed, markets continue to take their cue from inflation data that shows price growth continuing to cool. Gold rallied to a new record high following the speech and the dollar fell. Asian indices were unable to maintain the bullish move, coming in generally weaker save for the ASX 200. Oil prices attempted to bounce on news of a drone attack on ships in the Red Sea, but then resumed their post-OPEC falls. A quiet day for economic figures lies ahead, though ECB president Christine Lagarde speaks at 2pm.

-
On 28/11/2023 at 23:38, ModestInvestor said:
The Santa Rally – Christmas Growth in the Stock Market.
Thoughts?
-
8 minutes ago, ChadGregory said:
It's interesting to see the UK government extending the Mortgage Guarantee Scheme, especially given the current challenges in the housing market. With falling house prices and rising mortgage interest rates, it's a mixed bag for both buyers and lenders.
Nationwide says UK house prices up again
House prices recorded a second month of growth, across the UK, in November, according to the Nationwide Building Society.
At that earlier point it said that the reason for the rise was that there were fewer and fewer houses coming onto the market and with that restricted supply it was keeping up pricing across the price curve. Despite a monthly gain, prices are down 2% down on an annual basis – but this is still outperforming the expectations of economists in a poll for the Reuters news agency which had forecast a 2.5% decline. This latest report comes just days after Bank of England data showed a leap in mortgage approvals in October.
UK house prices
UK house prices have unexpectedly risen for the second month in a row, according to the Nationwide Building Society. In November, prices increased by 0.2%, following a 0.9% rise in October. This surprising growth can be attributed to a limited supply of homes entering the market, including both new builds and resales. Although prices are still 2% lower than last year, this is better than the anticipated drop of 2.3% that economists predicted. This news comes after the Bank of England reported a surge in mortgage approvals in October. Consequently, major housebuilding companies like Persimmon and Barrett Developments have seen significant increases in their share prices.
The FTSE 350 Household Goods and Home Construction Index
The positive impact on the housebuilding sector is evident in the FTSE 350 Household Goods and Home Construction Index, which includes Persimmon and Barrett Homes among other prominent builders. The index has reached levels not seen since May this year. Barclay, which will release its half-year figures next week, has also experienced substantial gains, reaching its highest price since January 2022. Redrow, another house builder, has also seen similar increases, although it is slightly below its recent peak. Taylor Wimpey, on the other hand, has reached levels not seen since May this year. Overall, the Nationwide Building Society's positive figures have had a beneficial impact on the housebuilding sector, leading to significant gains for various companies.
The Bank of England's data
This unexpected rise in UK house prices has defied economists' predictions, who had expected a decline. The limited supply of housing stock entering the market has contributed to the price growth. Furthermore, the Bank of England's data showing a surge in mortgage approvals during October suggests increased demand for housing. As a result, the housebuilding sector has received a boost, as seen in the significant gains in share prices for companies like Persimmon, Barrett Developments, and Barclay Homes. This positive trend has spread to other builders, including Redrow and Taylor Wimpey, which have reached levels not seen in several months. Although prices are still down compared to the previous year, the smaller decline compared to economists' predictions is seen as a positive outcome
This information has been prepared by IG, a trading name of IG Markets Limited. In addition to the disclaimer below, the material on this page does not contain a record of our trading prices, or an offer of, or solicitation for, a transaction in any financial instrument. IG accepts no responsibility for any use that may be made of these comments and for any consequences that result. No representation or warranty is given as to the accuracy or completeness of this information. Consequently any person acting on it does so entirely at their own risk. Any research provided does not have regard to the specific investment objectives, financial situation and needs of any specific person who may receive it. It has not been prepared in accordance with legal requirements designed to promote the independence of investment research and as such is considered to be a marketing communication. Although we are not specifically constrained from dealing ahead of our recommendations we do not seek to take advantage of them before they are provided to our clients. See full non-independent research disclaimer and quarterly summary.
-
With many benchmark indices scoring their best month, in November, in several quarters, can we still expect a Santa Claus rally in December? IGTV caught up with Ron William from RW Advisory, unerthing what a Santa Claus rally is.
(Partial Video Transcript)
Finding the magic in a Santa Claus rally
As we start out on the month of December, a lot of the anecdotal commentary about where we go in the month is all about the much-lauded Santa Claus rally. Is it fact or is it fiction?
Let's catch up now with a technical view of what we could expect this year in 2023. As we go into the meat of December, Ron William from RW Advisory joins us now.
JN: Ron, welcome. I want to take a look at what a Santa Claus rally is in just a minute. But let's just quickly ask you, first of all, to give us the set-up, the backdrop, where we are, what's happened. And as we go into December, what should we be looking for?
Rally may be muted this year by Black Friday
RW: Well, season's greetings, Jeremy, good to be back, engaging with eachother on markets in the UK. The Santa Claus rally is fact, just to give the headline answer first. And statistically, we'll take a look at how advantageous it can be to trade this from a tactical perspective.
However, this year, market backdrop and behavioral and cycle indicators suggest that the Santa Claus rally will likely be muted because Santa is likely visited earlier this year in terms of the discounted Black Friday weekend that we just enjoyed. And so the best is likely already done.
JN: OK, well, let's take a look at your first chart and we can get a better idea about what it is you're looking at. You've got here the global ranking model. As I say, this gives a little bit of a backdrop to what's happening in the short term, medium term and the longer term, a strategic view of the markets.
Just talk us through what this is telling us and how we should interpret it.
US enjoying a post interest-rate unwind
RW: Yes, well, this is looking at the global cross asset ranking model. And as you just mentioned, from left to right, we have the strategic long term, tactical medium-term and active short-term trend filters. And what it shows is that there's been a broad tactical surge in risk proxies, notably world equities, Bitcoin and gold.
And just to preface the last two, that's a little bit of risk on, but also risk off in terms of some of the geopolitical headwind that has taken place in recent weeks. Now, US equities has been led by growth stocks, but also year to date laggards.
From an American perspective, this is post interest-rate unwind from that 5% historical level and the so-called Federal Reserve (Fed) silent pivot where it became less hawkish than the last year or so.
-
1
-
-
2 hours ago, THT said:
Have a Great Christmas and New Year
Hi @THT
Thanks for sharing great content.

Have a Great Christmas and New Year
All the best
MongiIG
-
1
-
-
FTSE 100, DAX 40 and S&P 500 remain bid as inflation slows
Outlook on FTSE 100, DAX 40 and S&P 500 following a strong November.
Source: Bloomberg
FTSE 100 ends month in positive territory
The FTSE 100 slid to 7,383 on Thursday before reversing to the upside as inflation continues to weaken in the eurozone. The 55-day simple moving average (SMA) at 7,494 capped and is doing so once more on Friday morning. Once overcome, the 17 November high at 7,516 will be in focus, together with the 7,535 November high. Minor support is found at the 21 November low at 7,446.
 Source: ProRealTime
DAX 40 continues to surge ahead as eurozone inflations weakens
The DAX 40 continues to surge ahead as eurozone inflation came in weaker-than-expected on Thursday with the July peak at 16,532 being in sight. Minor resistance on the way up can be spotted at the 16,421 31 July low. Support below Friday’s intraday low at 16,236 is seen at Thursday’s 16,165 low. More significant support can be found between the August and September highs at 16,044 to 15,992.
 Source: ProRealTime
S&P 500 sees best November since 1980
The sharp November rally in the S&P 500 has lost upside momentum but the index nonetheless continues to trade in four-month highs as the Fed’s preferred PCE inflation gauge came in as expected at 3% year-on-year in October. November was not only the best performing month for the S&P 500 this year but also the strongest November since 1980. Resistance is found at the November peak at 4,587, followed by the July peak at 4,607. While this week’s lows at 4,539 to 4,537 underpin, the short-term uptrend remains intact. Slightly further down sits potential support at the 4,516 mid-September high.
 Source: ProRealTime
-
Gold price and natural gas price consolidate, but WTI comes under fresh pressure
It is a mixed start to the month for commodity prices; gold and natural gas are relatively quiet, while oil prices have fallen after an OPEC production cut failed to meet expectations.
 Source: Bloomberg
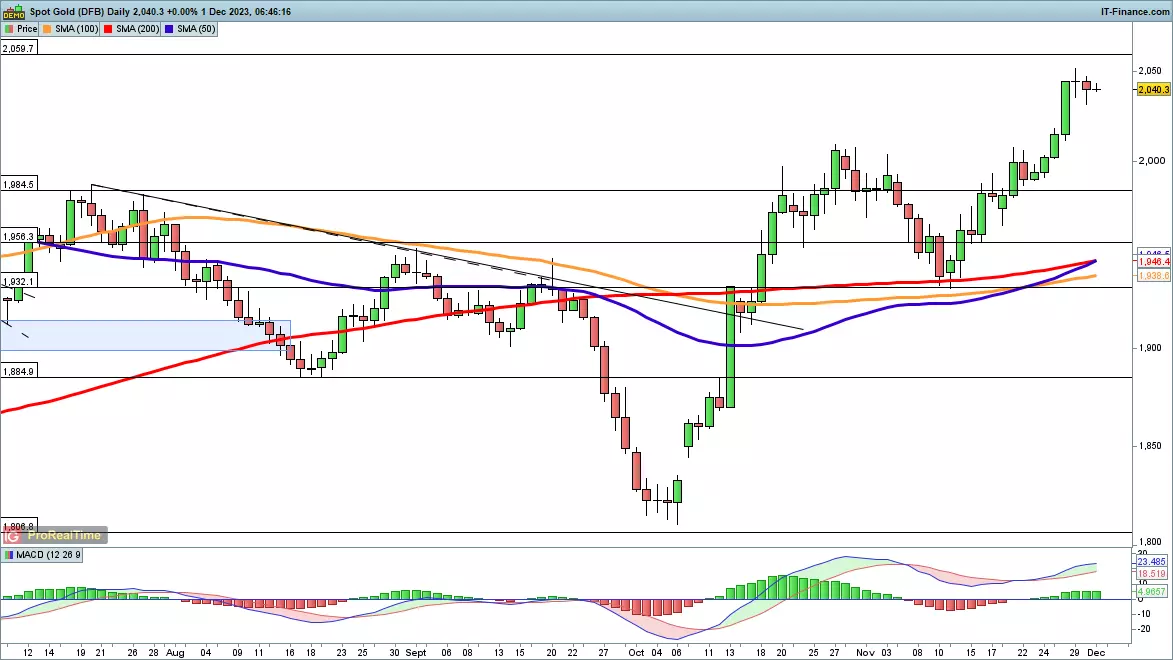
Gold price rally stalls
The price seems to have topped out for now, though a short-term bearish view would likely need a close back below $2000 to suggest another test of rising support. On the upside, the $2060 level remains as the key area to watch in the short-term, along with the $2075/$2080 area that has marked gold’s highs since 2020.
 Source: ProRealTime
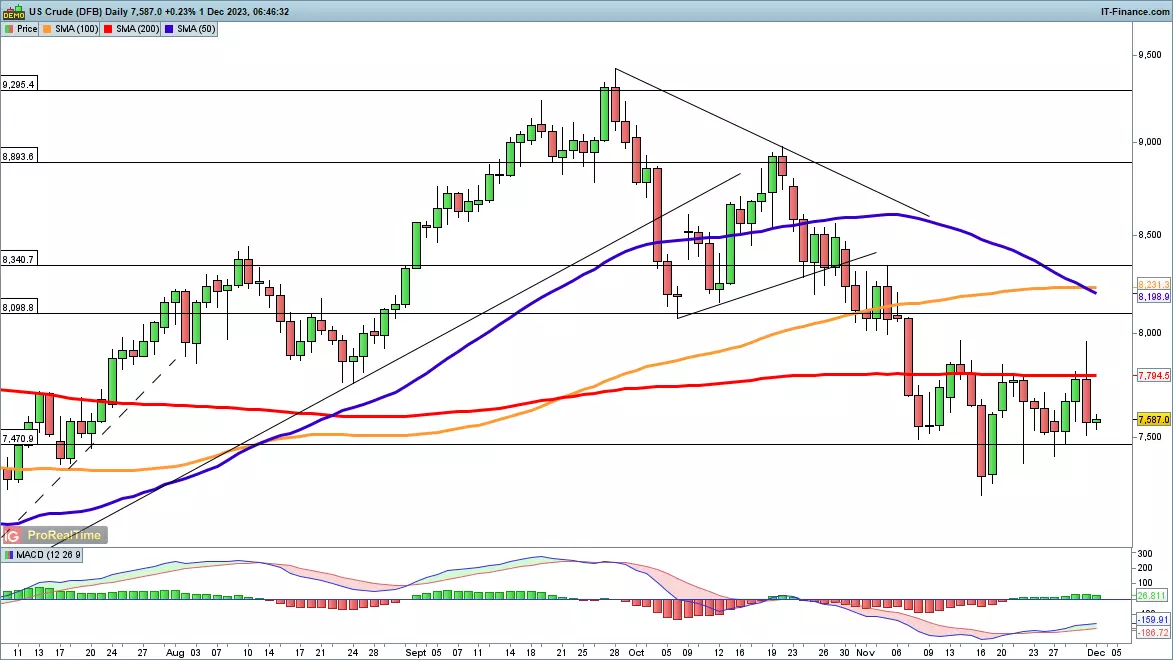
WTI falls after OPEC news
OPEC’s production cuts were not enough, it seems to deliver a sustained bounce in oil prices. Instead, Thursday saw the price push briefly above the 200-day simple moving average (SMA), before dropping back again. This now means we wait to see if recent support around $72 could be tested, with a move below this creating a lower low.
 Source: ProRealTime
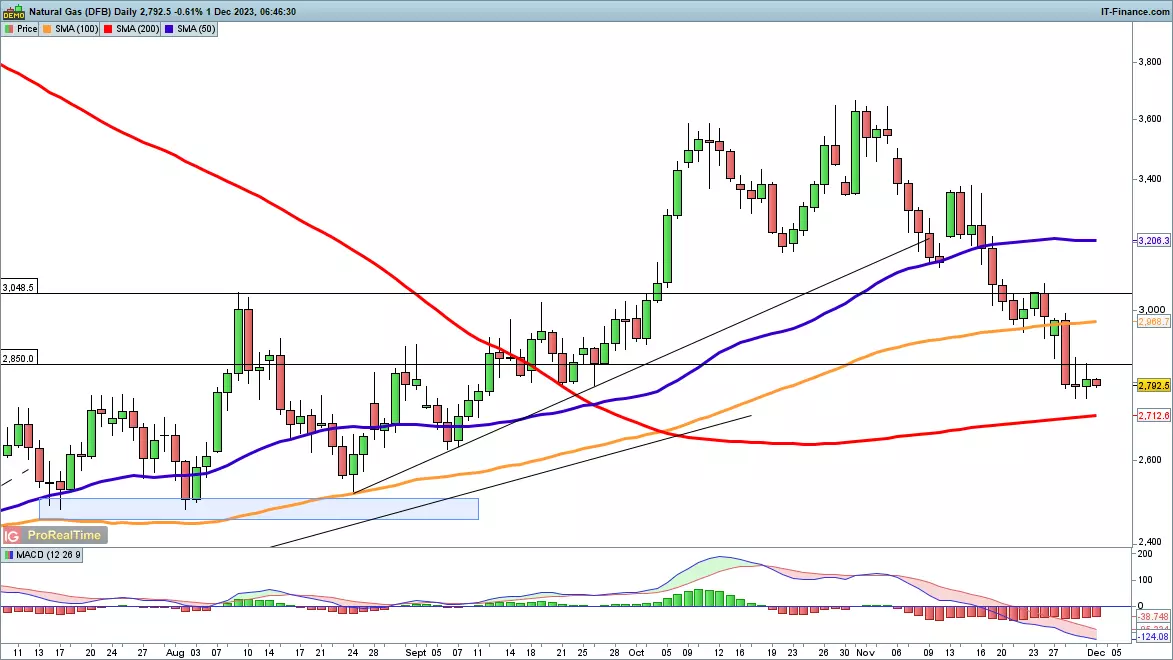
Natural Gas holds above 200-day MA
Here the price has managed to stabilise around the 200-day SMA, and a close back above 2900 might suggest a test of recent trendline resistance. If the price can claw its way back above 3000, buyers might emerge once again. Alternately, 2640 and 2540 become the next short-term targets to the downside.
 Source: ProRealTime
-
Bitcoin (BTC/USD) Holds the High Ground as Binance Deals with Client Exodus
Nov 28, 2023 7:46 PM +02:00Zain Vawda, DailyFX Analyst

BITCOIN, CRYPTO KEY POINTS:- Bitcoin Trades Just Above the $38k Mark. Are We Finally Going to Print a Daily Close Above the Resistance Level with an Eye on the $40k Handle?
- Binance Users Pull $1 Billion Following the Exit of CEO Changpeng Zhao.
-
BNB Token Struggles and Hovers Near Recent Lows. Can the Exchange Survive Moving Forward?
Bitcoin continues to threaten the $38k mark but remains unable to find acceptance above the key level. The reason the world’s largest cryptocurrency has held onto its gains may have to do with an increase in capital inflow from institutional investors over the past week, per a report by CoinShares.There has also been a notable surge in demand for digital assets of late with the past week being the 9th consecutive week of positive inflows to the market. A lot of this could still be down to anticipation of the spot Bitcoin ETF and the halving event next year. Bitcoin in particular saw inflows of around $312 million over the past week with the yearly total now at around the $1.5 billion mark as investor confidence appears to be on the rise. There has also been a notable shift over the last 18 months with the number of Hodlers growing exponentially as well.

Source: TradingViewBINANCE FACES CLIENT EXODUS FOLLOWING ZHAO’S EXIT
It’s been a topsy turvy couple of days for Binance as it continues to grapple with the fallout from exit of former CEO Changpeng Zhao. This has left the world of crypto exchanges reeling even if Cryptocurrencies themselves have enjoyed a renaissance in Q4.Binance faced questions last week about its ability to continue given the size of the fines imposed on the exchange which totaled $4.3 billion. As news filtered through the exchange saw outflows of around the $1 billion mark in the 24 hours post Zhao’s departure being announced. If this continues it could pose a serious risk to the exchange and may be worth monitoring in the days ahead.
The BNB token as well faced challenges in the aftermath as it fell as much as 8% following Zhao’s announcement. The exchange has also lost a significant amount of market share from zero-fee crypto trading since the removal of this lucrative incentive. Binance does not face the same charges as FTX but are we about to witness another titan of the industry disappear into the doldrums?
BNB Daily Chart, November 28, 2023

Source: TradingView -
22 hours ago, phillo said:
that's the plan, but I see it as a slow process

 Source: Bloomberg
The US dollar, as measured by the DXY index, extended its recovery on Thursday, boosted by a bounce in US treasury yields following remarks from San Francisco Federal Reserve president, Mary Daly indicating that the FOMC is not yet considering slashing borrowing costs. Daly's forceful position, which clashes with the more cautious posture embraced by other colleagues, highlights a widening chasm between the doves and the hawks.
Upcoming market events
 Source: DailyFX
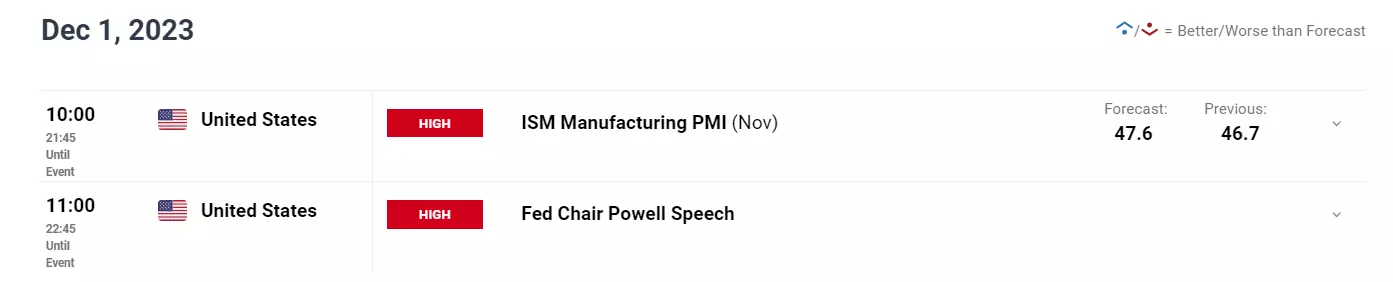
To address uncertainties regarding the broader central bank’s stance, traders should closely monitor Fed chair Jerome Powell’s speech at Spelman College on Friday. This event might serve as a platform for the FOMC chief to provide clarification on the monetary policy outlook.
Hawkish comments endorsing higher interest rates for longer are likely to exert upward pressure on US yields, creating the right conditions for the dollar to prolong its nascent rebound. On the flip side, a lack of pushback on dovish market pricing ( many rate cuts for 2024 already discounted) could drag yields, weighing on the greenback.
-
The group decided to reduce production by an additional one million barrels per day.
 Source: Bloomberg
Key Takeaways:
- OPEC+ announced a strategic decision to cut oil production, influenced by Saudi Arabia's desire to maintain high oil prices.
- The production cut will reduce output by an additional one million barrels per day, which is expected to have significant implications for the global oil market.
- OPEC+ plays a crucial role in the oil industry and their decisions can greatly impact oil prices worldwide, affecting gas prices and the stock market.
- The decision to cut production reflects the ongoing power dynamics within the global oil market, with Saudi Arabia showcasing its influence within OPEC+ by successfully lobbying for the production cut.
- The move by OPEC+ underscores the importance of oil prices in supporting national economies, as Saudi Arabia seeks higher prices to bolster its own economy.
In a strategic move, the OPEC+ oil cartel, comprising members of the Organization of the Petroleum Exporting Countries (OPEC) and other major oil producers like Russia, announced on Thursday that they would be cutting oil production. This decision was heavily influenced by Saudi Arabia, as the country was keen on maintaining high oil prices.
The group decided to reduce production by an additional one million barrels per day. This decision is expected to have significant implications for the global oil market.
OPEC and its allies, known collectively as OPEC+, have been key players in the oil industry for many years. Their decisions can significantly impact oil prices worldwide, affecting everything from gas prices to the stock market. This recent decision to cut production is a strategic move aimed at keeping oil prices up.
The decision by OPEC+ also reflects the ongoing power dynamics within the global oil market. Saudi Arabia, one of the world's largest oil producers, has been pushing for higher oil prices to support its economy. By successfully lobbying for a production cut, it demonstrates the influence it wields within OPEC+.
Brent crude oil – technical trading view
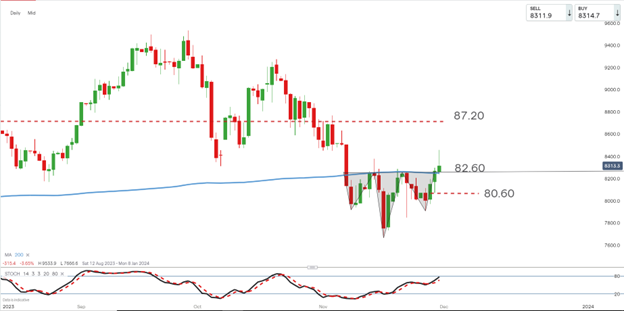 Source: IG
The share price of brent crude has formed an inverse head and shoulders reversal pattern (shaded grey). The reversal pattern suggests that the near-term downtrend is now reversing into a short-term uptrend. A close above 82.60, the neckline, would confirm the pattern. In this scenario, 87.20 becomes the initial upside resistance target from the move, while a close below the 80.60 level might be used as a stop loss indication.
This information has been prepared by IG, a trading name of IG Markets Limited. In addition to the disclaimer below, the material on this page does not contain a record of our trading prices, or an offer of, or solicitation for, a transaction in any financial instrument. IG accepts no responsibility for any use that may be made of these comments and for any consequences that result. No representation or warranty is given as to the accuracy or completeness of this information. Consequently any person acting on it does so entirely at their own risk. Any research provided does not have regard to the specific investment objectives, financial situation and needs of any specific person who may receive it. It has not been prepared in accordance with legal requirements designed to promote the independence of investment research and as such is considered to be a marketing communication. Although we are not specifically constrained from dealing ahead of our recommendations we do not seek to take advantage of them before they are provided to our clients. See full non-independent research disclaimer and quarterly summary.


HOW TO IDENTIFY MAJOR PIVOT POINTS IN FOREX AND CRYPTO SWING TRADING
in Cryptocurrency and Blockchain
Posted
Thanks for sharing @Bash4j
This is great learning content.
All the best - MongiIG