

MongiIG
-
Posts
9,899 -
Joined
-
Last visited
-
Days Won
41
Content Type
Profiles
Forums
Blogs
Events
Community Tutorials
Store
Posts posted by MongiIG
-
-
Microsoft has overtaken Apple to become the world’s biggest company by market capitalization. IGTV financial analyst Angeline Ong looks at what has driven Microsoft's market value up, helping it to eclipse the iPhone giant.
Microsoft overtakes Apple in market value
Microsoft has taken over Apple as the most valuable company in the world by market value. This change can be mostly attributed to Microsoft focusing on generative artificial intelligence, which has caught the attention of investors. This increased interest in AI has given Microsoft's stock a boost, much like other tech stocks. On the flip side, Apple has been dealing with a decrease in demand for its famous iPhone, particularly in China.
Microsoft's AI advancements
Looking at the bigger picture, Apple's stock has actually performed well in 2023, benefiting from different factors. However, Microsoft has also experienced significant gains and now has a larger market value than Apple. This rise in Microsoft's worth highlights the growing importance and potential of generative artificial intelligence. This technology allows machines to learn and generate data, and investors are very excited about it. It is also transforming many industries.
Microsoft's investment and focus on AI have undeniably played a major role in its rise to become the most valuable company. On the other hand, Apple's dependence on the iPhone for its profits has created challenges as the demand for this iconic device has decreased, especially in the saturated smartphone market of China. This struggle with declining iPhone sales has hurt Apple's stock performance and allowed Microsoft to surpass it in market value.
Overall, this shift in the world's most valuable company shows just how important technological advancements like AI are and how they impact the market. It also reminds us that even giant companies like Apple need to constantly innovate and diversify their products to stay ahead in the ever-changing market landscape.
This information has been prepared by IG, a trading name of IG Markets Limited. In addition to the disclaimer below, the material on this page does not contain a record of our trading prices, or an offer of, or solicitation for, a transaction in any financial instrument. IG accepts no responsibility for any use that may be made of these comments and for any consequences that result. No representation or warranty is given as to the accuracy or completeness of this information. Consequently any person acting on it does so entirely at their own risk. Any research provided does not have regard to the specific investment objectives, financial situation and needs of any specific person who may receive it. It has not been prepared in accordance with legal requirements designed to promote the independence of investment research and as such is considered to be a marketing communication. Although we are not specifically constrained from dealing ahead of our recommendations we do not seek to take advantage of them before they are provided to our clients. See full non-independent research disclaimer and quarterly summary.
-
US equity markets surge on Fed rate cut expectations; Nasdaq up 3.23%. Mixed bank earnings reactions. Focus on December retail sales report and Fed speeches this week.
US equity markets rediscovered their bull market mojo last week, supported by increasingly aggressive expectations of Fed rate cuts. The Nasdaq surged 3.23% for the week, while the S&P 500 added 1.84%, and the Dow Jones finished 0.34% higher.
Following Friday night's softer-than-expected PPI data (-0.1% vs 0.1% exp), two-year yields dived to finish 23 basis points (bp) lower at 4.15%. There is now an 80% chance of a Fed rate cut priced for March, and a total of 167 bp of rate cuts priced for 2024.
Friday night's bank earnings reports received a mixed reception. Wells Fargo (-3.34%), Bank of America (-1.06%) and JP Morgan (-0.73%). While Citigroup climbed 1.04% to $52.62 on the news, it will trim its workforce by 10% to boost returns. US Q4 earnings season continues this week, with reports scheduled from companies including Goldman Sachs, Morgan Stanley, Interactive Brokers, Charles Schwab, and Alcoa.

Start trading forex today
Trade the largest and most volatile financial market in the world.
- Spreads start at just 0.6 points on EUR/USD
- Analyse market movements with our essential selection of charts
- Speculate from a range of platforms, including on mobile
Aside from earnings reports, there will be interest in the latest retail sales report for December, the Michigan consumer sentiment for January and speeches from Fed members, including Waller, Williams, Barr, Daly, and Bostic - who may attempt to push back on expectations of rate cuts in March.
What is expected from the December retail sales report? (Thursday 12.30 am AEST)
Following a gain of 0.3% MoM in November, the market is looking for retail sales to gain 0.3% in December. Retail sales, excluding volatile motor vehicles and parts are expected to increase by a subdued 0.2% MoM.
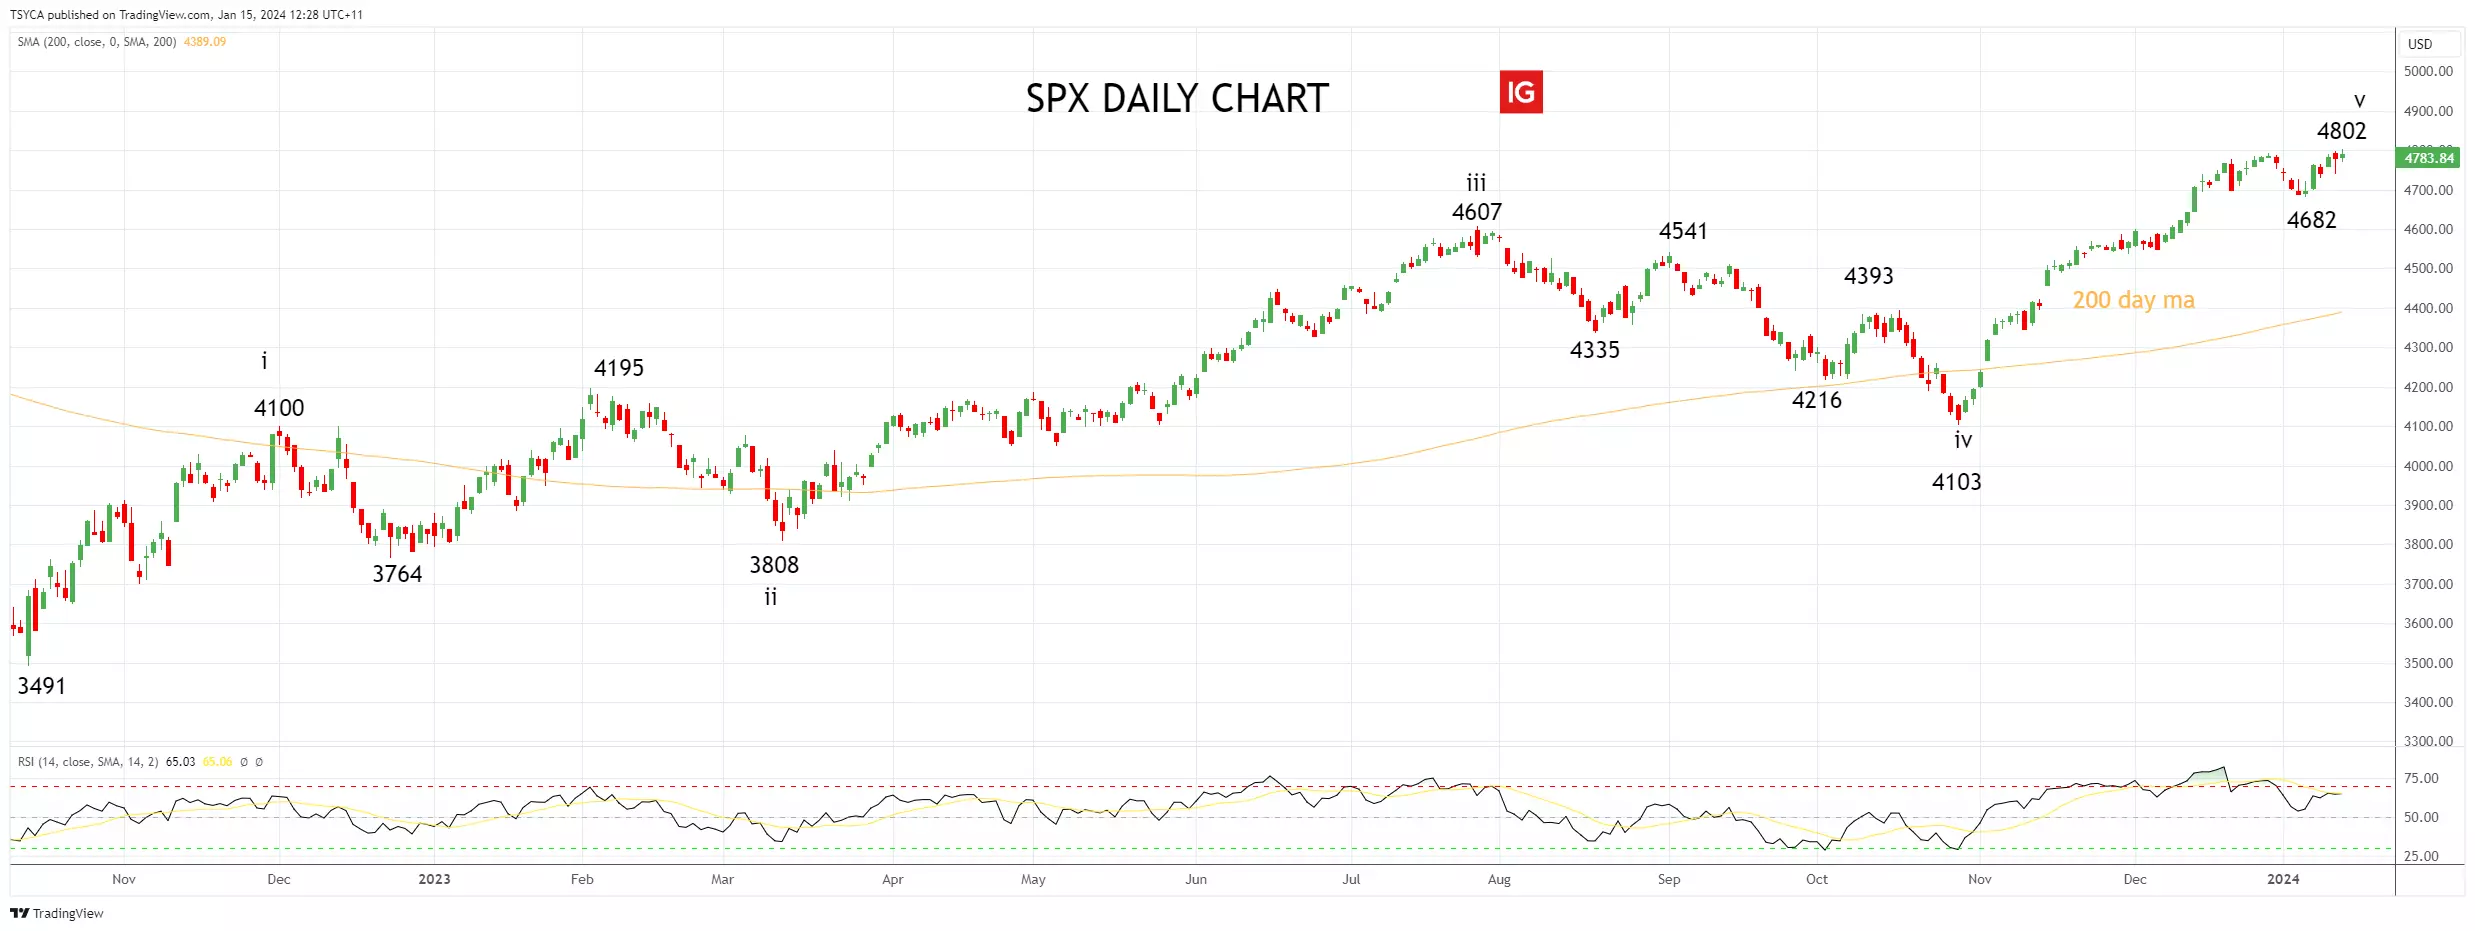
S&P 500 technical analysis
While the S&P 500 cash made a marginal new high last week, the view remains that the advance from the October low is in the terminal stages based on our Elliott Wave count and bearish RSI divergence.
As such, we remain neutral/cautious at current levels, watching for a break of support at 4675 (just below last week's lows), which would warn that a deeper pullback towards support at 4600/4550 is underway.
S&P 500 daily chart
 Source: TradingView
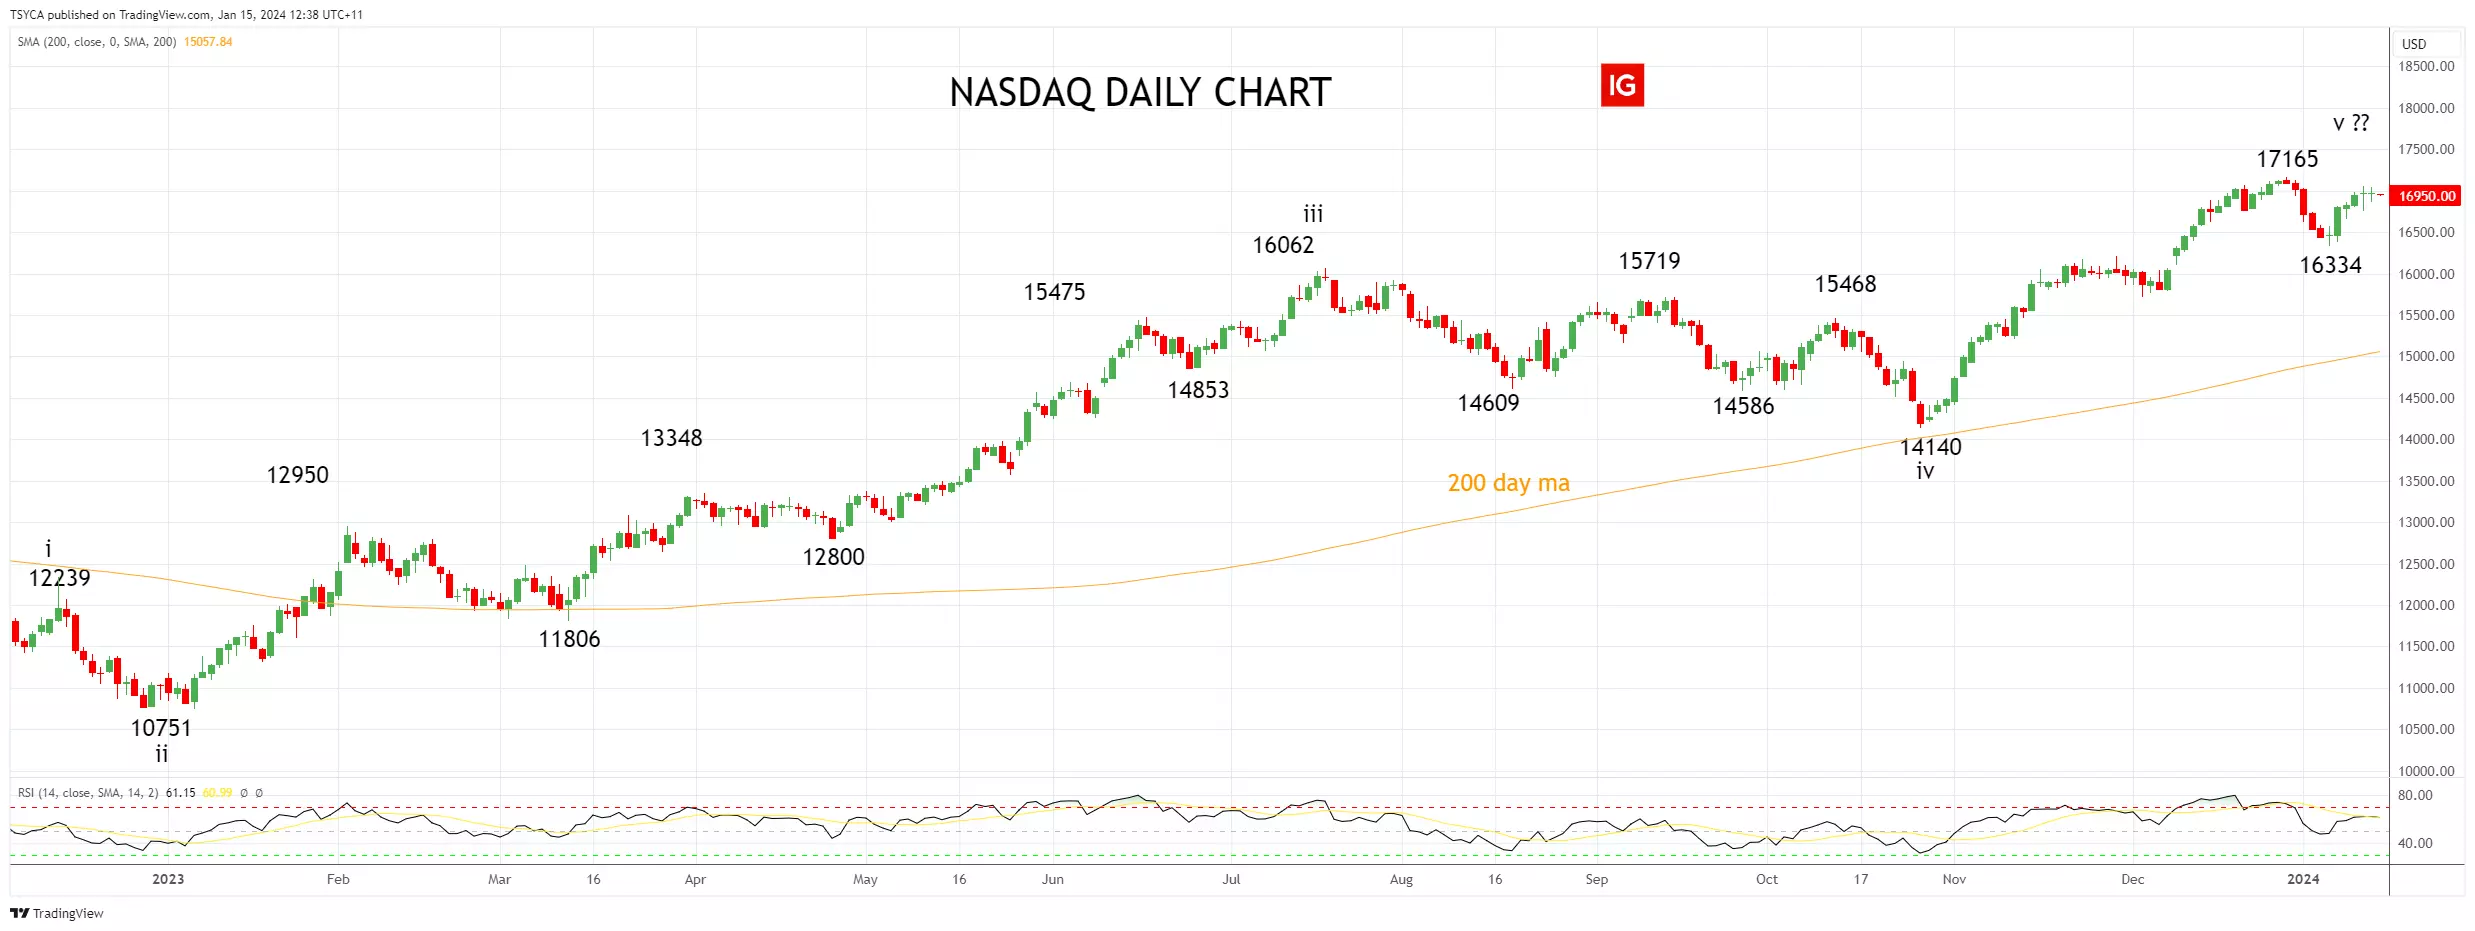
Nasdaq technical analysis
The Nasdaq followed the road map to perfection during the second half of 2023, bottoming as expected in the 14,200/14,000 support zone before a stunning rebound to new highs.
The updated view is that the advance from the October low is in the terminal stages based on our Elliott Wave count, and as such, we remain neutral/cautious at current levels. A sustained break below support at 15,900/15,800 would warn that a deeper pullback initially towards the 200-day moving average at 15,000 is underway.
Nasdaq daily chart
 Source: TradingView
- Source: TradingView. The figures stated are as of 15 January 2023. Past performance is not a reliable indicator of future performance. This report does not contain and is not to be taken as containing any financial product advice or financial product recommendation.
This information has been prepared by IG, a trading name of IG Australia Pty Ltd. In addition to the disclaimer below, the material on this page does not contain a record of our trading prices, or an offer of, or solicitation for, a transaction in any financial instrument. IG accepts no responsibility for any use that may be made of these comments and for any consequences that result. No representation or warranty is given as to the accuracy or completeness of this information. Consequently any person acting on it does so entirely at their own risk. Any research provided does not have regard to the specific investment objectives, financial situation and needs of any specific person who may receive it. It has not been prepared in accordance with legal requirements designed to promote the independence of investment research and as such is considered to be a marketing communication. Although we are not specifically constrained from dealing ahead of our recommendations we do not seek to take advantage of them before they are provided to our clients.
-
AUD/USD faces challenges with softer inflation and iron ore dip. Chinese GDP and Thursday's aussie jobs report key. Expectations of +15k employment and 3.9% unemployment crucial for RBA's 2024 rate outlook.
 Source: Bloomberg
Last week saw a second consecutively weekly fall for the AUD/USD, as a softer-than-expected Australian inflation report and a 4.4% fall in the price of iron ore weighed on the local unit.
Whether the AUD/USD can regain upside traction after its almost 10% rally into year-end will depend to a large degree on Chinese GDP and activity data due for release on Wednesday, which will provide fresh insights into the health of the Chinese economy at the beginning of 2024.
Locally, the release of the latest Australian labour force report schedule for release on Thursday, previewed below, will also have a strong say in how the AUD/USD trades this week.
Start trading forex today
Trade the largest and most volatile financial market in the world.
- Spreads start at just 0.6 points on EUR/USD
- Analyse market movements with our essential selection of charts
- Speculate from a range of platforms, including on mobile
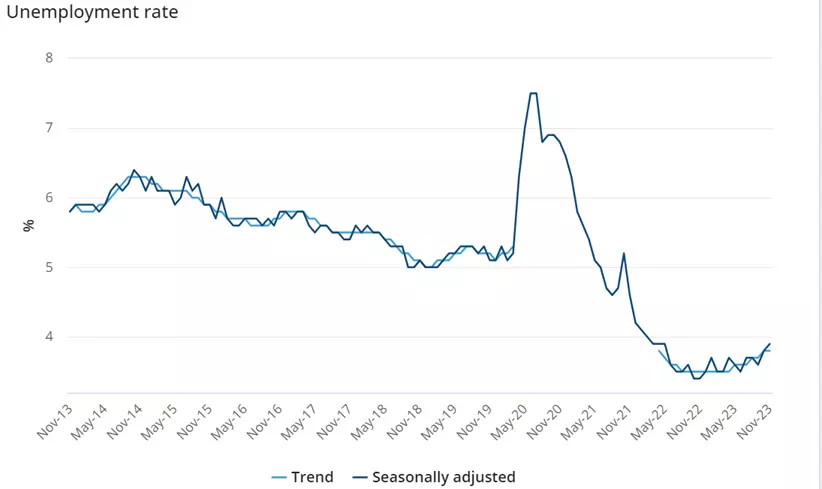
Employment data (Thursday, January 18th at 11.30 am AEST)
The Australian economy added 61.5k jobs in November vs. the 11.5k expected. The unemployment rate rose to 3.9% from 3.8%, as the participation rate surged to a record high of 67.2% from 67%.
Bjorn Jarvis, ABS head of labour statistics, said: "With employment increasing by 61,000 people, and the number of unemployed people rising by 19,000, the unemployment rate rose to 3.9 per cent in November." This month, the market is looking for a +15k rise in employment and for the unemployment rate to remain unchanged at 3.9%. The participation rate is also expected to remain unchanged at 67.2%.
Ahead of the jobs report, there are two RBA rate cuts priced into the Australian rates market, with a first-rate cut for June and a second by December, which would take the cash rate back to 3.60% by year-end. If the unemployment rate were to tick up to 4% or above, it might see the start of a third rate cut priced into the rates curve for 2024.
Australia's unemployment rate chart
 Source: ABS
AUD/USD technical analysis
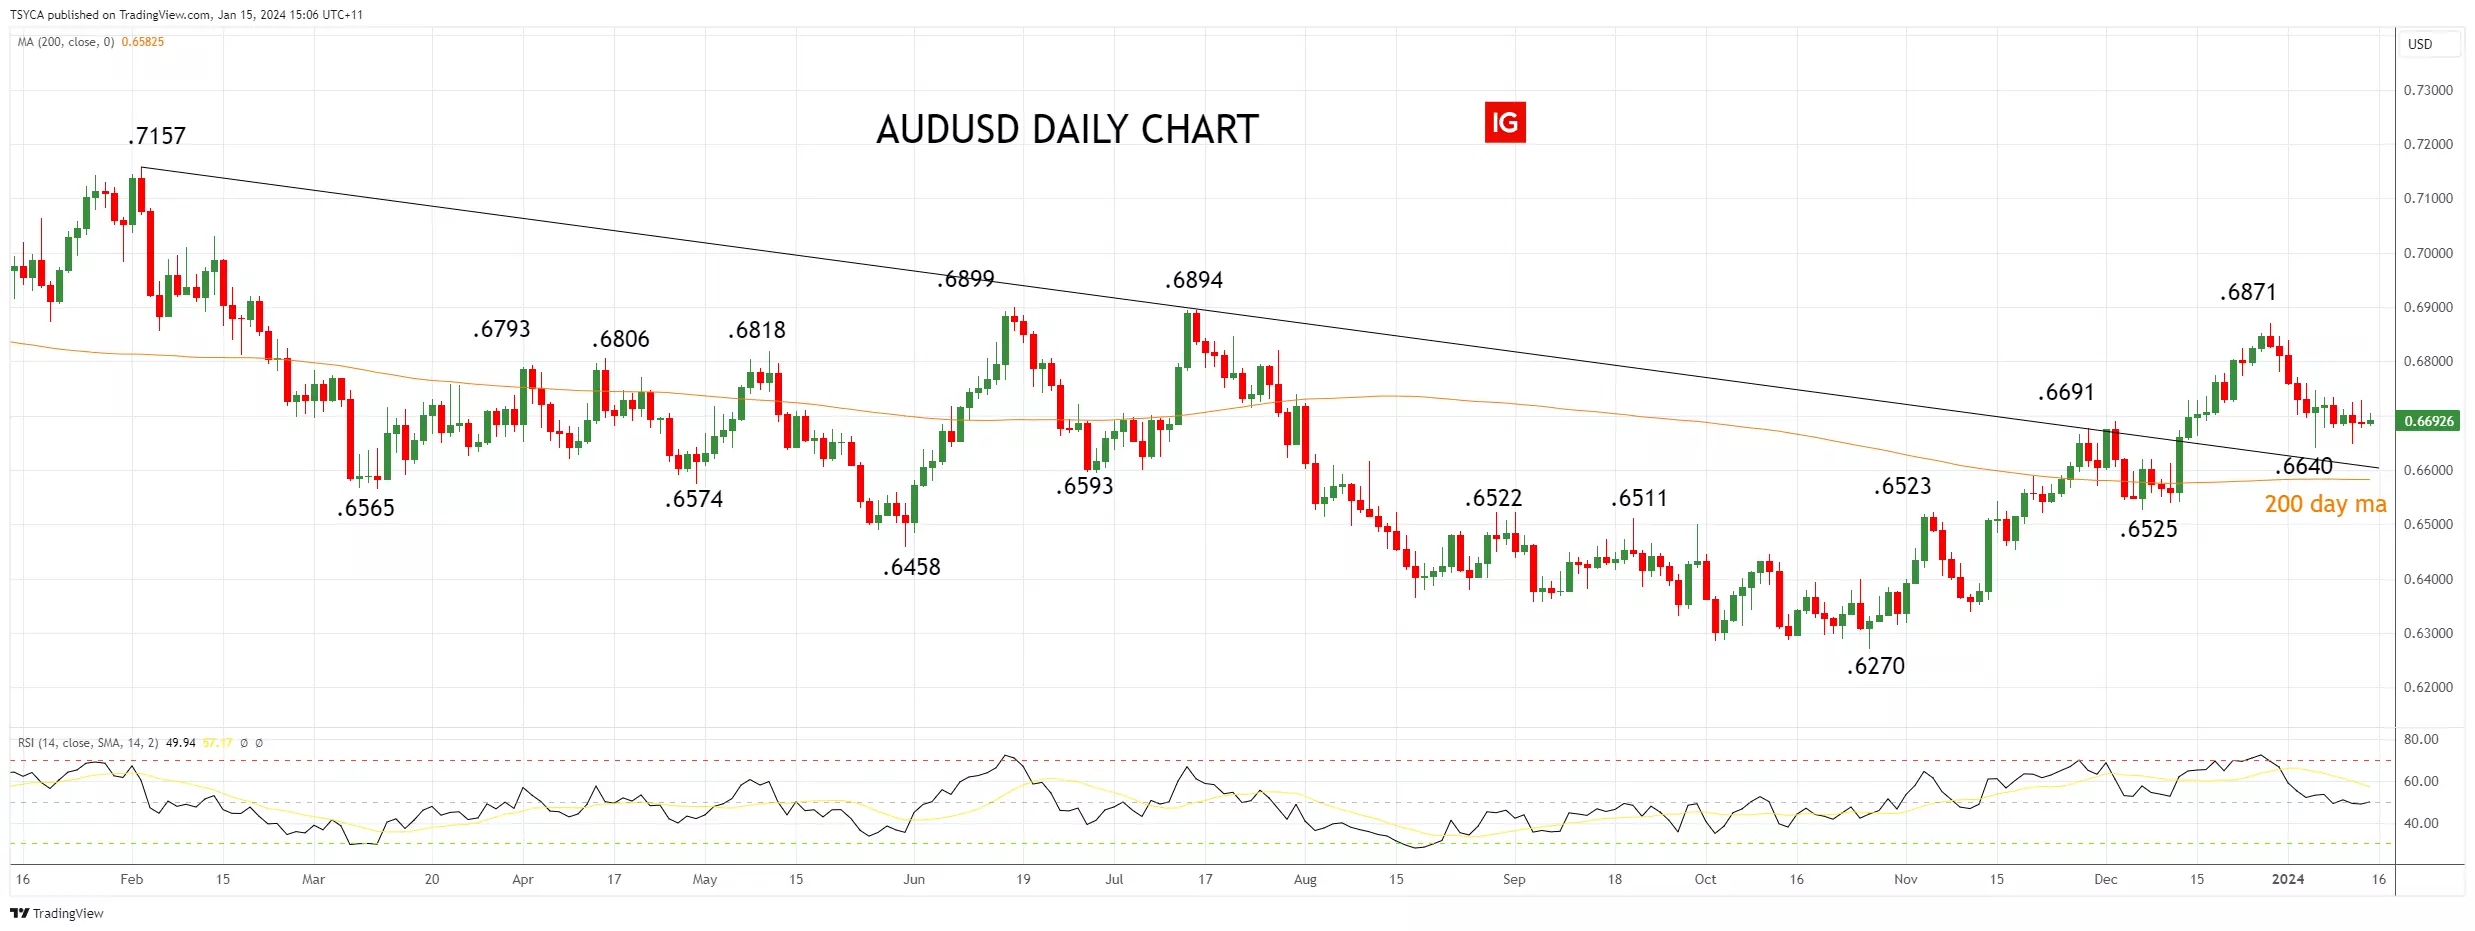
From the October .6270 low to the December .6871 high, the AUD/USD gained just under 10% in two months. The rally appears to have unfolded in five waves (Elliott Wave), which suggests the pullback from the .6871 high is part of a correction, rather than a reversal lower.
The correction will likely be well supported initially at the early January .6640 low, reinforced by the 200-day moving average at .6580. A very good layer of horizontal support is not far below at .6520/00.
If we were to see evidence of basing near one of the support levels mentioned above, it might be the setup for a long trade looking for a rebound towards the .6871 high.
AUD/USD daily chart
 Source: TradingView
- Source: TradingView. The figures stated are as of 15 January 2023. Past performance is not a reliable indicator of future performance. This report does not contain and is not to be taken as containing any financial product advice or financial product recommendation.
This information has been prepared by IG, a trading name of IG Australia Pty Ltd. In addition to the disclaimer below, the material on this page does not contain a record of our trading prices, or an offer of, or solicitation for, a transaction in any financial instrument. IG accepts no responsibility for any use that may be made of these comments and for any consequences that result. No representation or warranty is given as to the accuracy or completeness of this information. Consequently any person acting on it does so entirely at their own risk. Any research provided does not have regard to the specific investment objectives, financial situation and needs of any specific person who may receive it. It has not been prepared in accordance with legal requirements designed to promote the independence of investment research and as such is considered to be a marketing communication. Although we are not specifically constrained from dealing ahead of our recommendations we do not seek to take advantage of them before they are provided to our clients.
-
Gold price rallies while oil & natural gas prices struggle
While gold is moving higher to start the week, oil prices and natural gas prices have seen a more mixed morning of trading.
 Source: Bloomberg
Gold marches higher
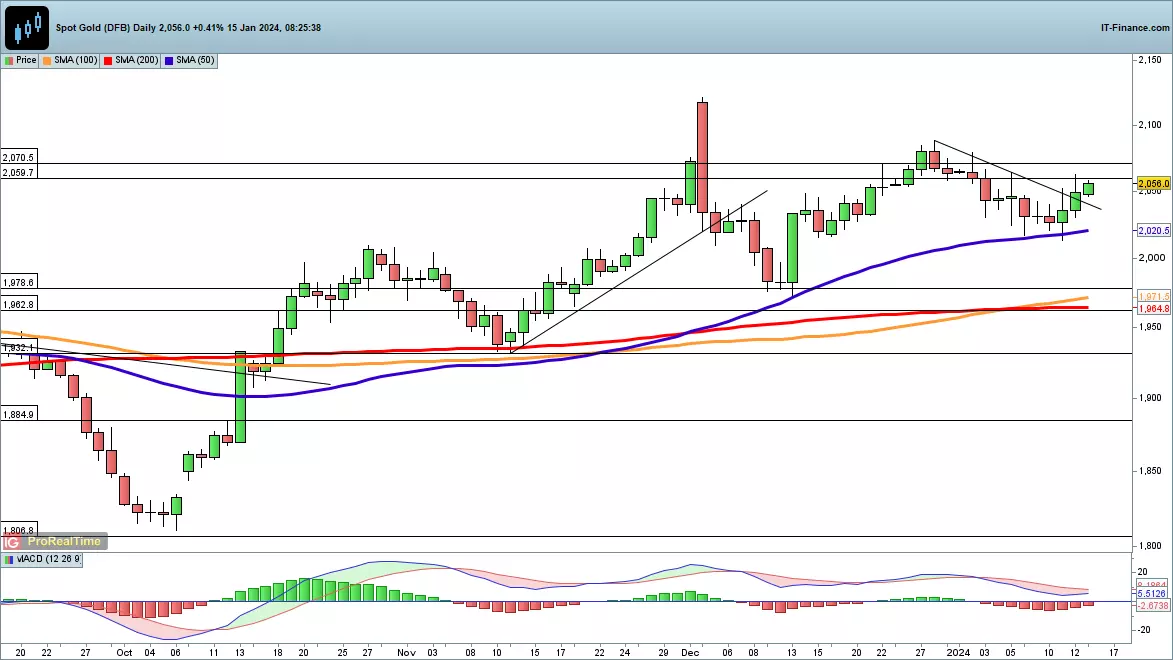
The price is making headway to the upside this morning, building on the strong finish to last week.
Last week saw the price bounce off the 50-day simple moving average (SMA), forming a higher low and reviving the uptrend. Friday saw the price close above trendline resistance from the late-December high, bolstering the bullish short-term narrative.
A close back below $2030 would negate this, while a drop back below the 50-day SMA points towards the possibility of additional short-term weakness.
See your opportunity?
Seize it now. Trade over 17,000+ markets on our award-winning platform, with low spreads on indices, shares, commodities and more.
 Source: ProRealTime
Surge in Brent crude knocked back
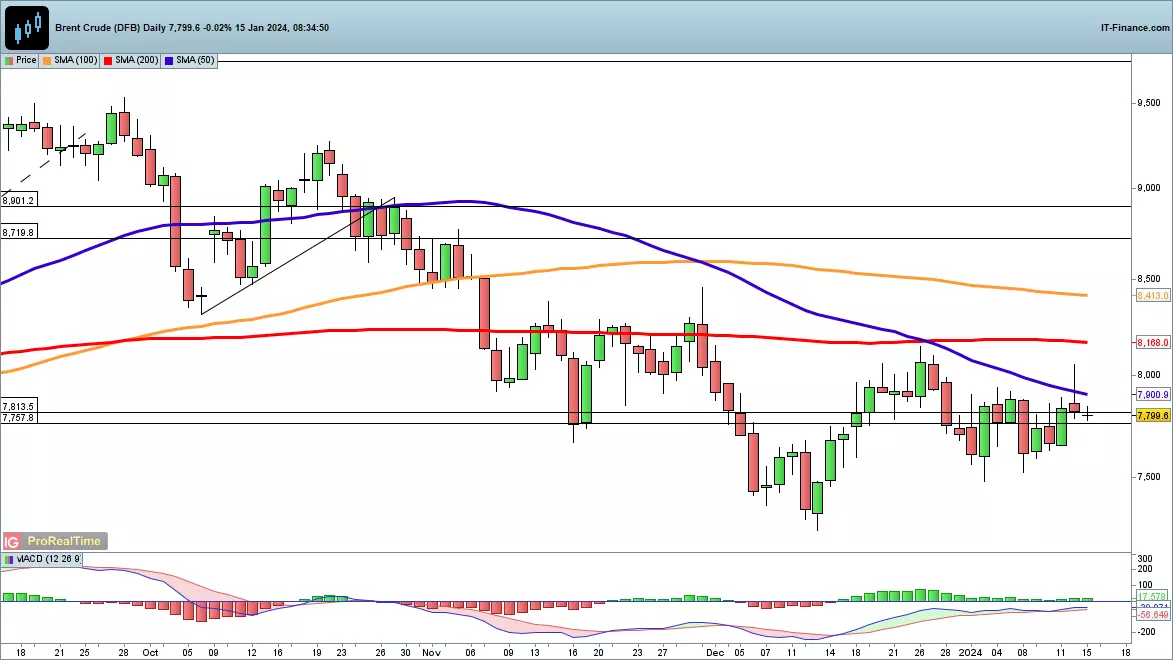
The volatility in crude oil prices continues. Friday witnessed a spike to $80 for Brent, in anticipation of the US/UK military action against the Houthis in Yemen.
However, the spike was short-lived, and the close below the 50-day SMA sends a potentially bearish signal. Sellers now need to follow through on this with a break below $75 that will open the way to the lows of December.
Buyers have been unable to hold on to gains over the past few months, and in the short-term a close above $80 and then the late December high at $81.40 would provide a short-term bullish view.
 Souce: ProRealTime
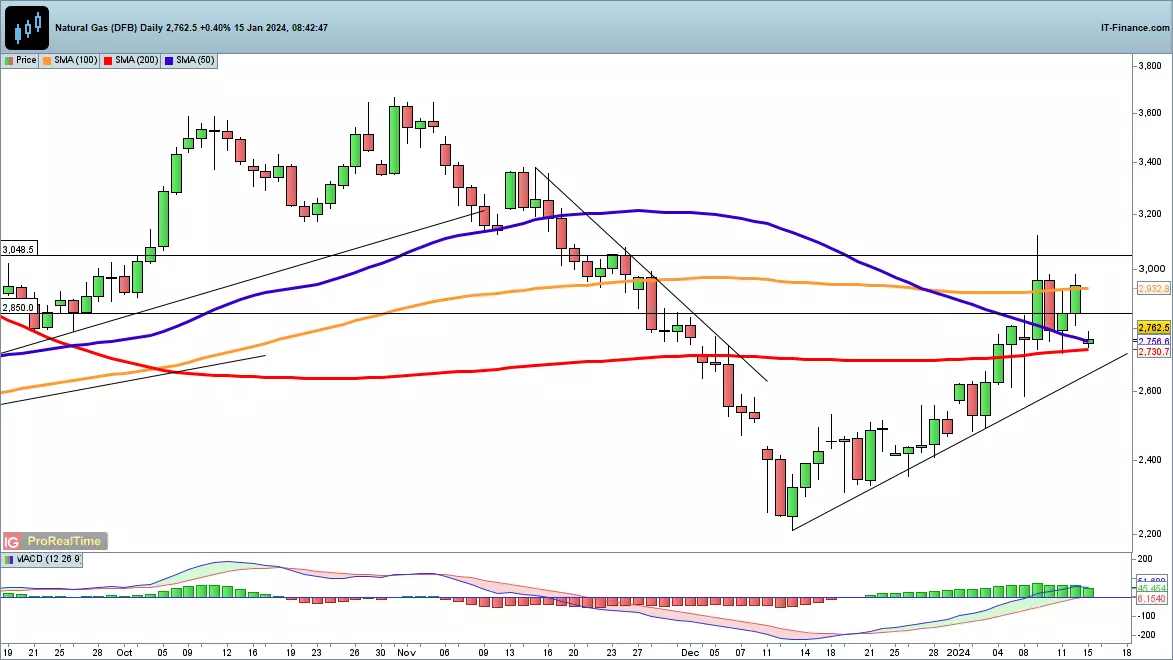
Natural Gas gaps lower
After the surge from the December lows, the price has hit a road block, slumping back to the 200-day SMA, though leaving the uptrend from the lows of December intact.
A close below 2670 would be needed to break trendline support from mid-December, which would reinforce the view that a lower high has been created. This might then renew the downtrend from early-November and put the lows of late December in play.
Renewed strength targets last week’s highs around 2975, and a close above 3000 marks a fresh bullish development.
 Source: ProRealTime
This information has been prepared by IG, a trading name of IG Markets Limited. In addition to the disclaimer below, the material on this page does not contain a record of our trading prices, or an offer of, or solicitation for, a transaction in any financial instrument. IG accepts no responsibility for any use that may be made of these comments and for any consequences that result. No representation or warranty is given as to the accuracy or completeness of this information. Consequently any person acting on it does so entirely at their own risk. Any research provided does not have regard to the specific investment objectives, financial situation and needs of any specific person who may receive it. It has not been prepared in accordance with legal requirements designed to promote the independence of investment research and as such is considered to be a marketing communication. Although we are not specifically constrained from dealing ahead of our recommendations we do not seek to take advantage of them before they are provided to our clients. See full non-independent research disclaimer and quarterly summary.
-
Brace for GBP/USD volatility this week as the market awaits the latest unemployment and CPI print. Both readings could give investors further clues on what the Bank of England will do at its February meeting.
(Video summary)
This week, traders are focusing on the British pound, also known as the sterling, as there are important economic indicators coming out that could give us more information about what the Bank of England (BoE) will do next. One of these indicators is the unemployment rate, which is expected to increase to 4.3% in November. This would be the first time it has gone up in five months. Currently, the rate is at 4.2%, which is the highest it has been since September of last year.
CPI
Another indicator to watch is the Consumer Price Index (CPI) growth, which measures inflation. It is expected to slow down to 3.8% in December compared to the previous month. This is good news because inflation has been high lately, but it has been gradually decreasing since reaching a peak of 11.1% in October of 2022. In addition, the core CPI growth, which excludes volatile items like food and energy, is forecasted to fall to 4.9% compared to the previous year. This would be the lowest level since January of 2022.
Retail sales
Lastly, on Friday we will get data on retail sales in December, which is estimated to decline by 0.5%. This means that people were spending less on goods during the holiday season. All of these indicators will be closely watched by Andrew Bailey and his team at the BoE, as they will decide on interest rates on February 1st. This decision will give us a good idea of how the UK economy is doing.
Overall, the UK economy has been weak recently, with inflation coming down but still remaining high. The property market is uncertain, but there are signs that it is stabilizing after a slow period. The GBP/USD exchange rate, also known as "cable," has been quite volatile since October but has been gradually moving towards the 12,743 mark. If it breaks through that level, it could potentially go up to around 13,140. So, the upcoming economic indicators and the Bank of England's interest rate decision will help us understand how the UK economy is performing and what the sterling's movements are likely to be.
This information has been prepared by IG, a trading name of IG Markets Limited. In addition to the disclaimer below, the material on this page does not contain a record of our trading prices, or an offer of, or solicitation for, a transaction in any financial instrument. IG accepts no responsibility for any use that may be made of these comments and for any consequences that result. No representation or warranty is given as to the accuracy or completeness of this information. Consequently any person acting on it does so entirely at their own risk. Any research provided does not have regard to the specific investment objectives, financial situation and needs of any specific person who may receive it. It has not been prepared in accordance with legal requirements designed to promote the independence of investment research and as such is considered to be a marketing communication. Although we are not specifically constrained from dealing ahead of our recommendations we do not seek to take advantage of them before they are provided to our clients. See full non-independent research disclaimer and quarterly summary.
-
The retailer saw strong growth in its premium and value food lines
 Source: Bloomberg
Marks & Spencer Group PLC reported bumper Christmas trading figures despite the cost of living crisis. The UK-based food and clothing retailer delivered an 8.1% increase in total UK like-for-like sales for the 13 weeks to 30 December 2023 to £3.6 billion. Like-for-like food revenues enjoyed a 9.9% increase to £3.3 billion, boosted by sales of premium Christmas food lines. Group sales rose by 7.2% to £3.9 billion with the figures beating analyst expectations.
Marks and Spencer ‘top performing grocer’
Indeed, Marks and Spencer was the top performing grocer over the Christmas period and quarter in terms of volume growth. The company said this was driven by supply chain improvements and strong growth in its meat, poultry, grocery, produce and in-store bakery lines.
Chief executive Stuart Machin said the company’s “strategy to reshape M&S for growth” had delivered “sustained sales momentum” across the retailer’s food, clothing and home divisions.
“In Food, we led the market on volume growth every month with a c.7% increase across the quarter, and served more customers than ever before,” he told investors. “Core categories grew strongly and renewal stores, which cater to larger basket shops, performed particularly well, as more customers looked to us for more of their full shop. In clothing and home, we delivered a good performance with sales growing ahead of the market and less stock going into sale.”
Sales of its ‘Remarksable’ value food line also grew around 18% over the period. Even the company’s enfant terrible, womenswear, was a “standout”, Machin said, leading the market in terms of volume and value growth.
Marks and Spencer’s Machin: ‘Lots more to do’
While Machin said the company enters 2024 “with a spring in our step,” he said Marks and Spencer still has “lots more to do” to facilitate its turnaround and admitted it had a history of “overpromising and under-delivering”. The company was cautious in its outlook statement, noting that expectations for “economic growth remain uncertain” given continuing consumer and geopolitical-related risks.
Marks and Spencer also says it is seeing increased wage and business rates-related cost inflation. International sales also fell by 6.4% due to issues in the Middle East and India. Management left full-year forecasts unchanged and said the company aims to produce 1% growth in market share in both clothing and food.
Shares in Marks and Spencer are up 80% this year to 262p. Investors may wish to take some profits, given the shares are trading near their five-year highs. However, there could be further momentum in the stock. Analysts at broker Barclays think the shares could reach 300p.
Past performance is not a guide to future performance
This information has been prepared by IG, a trading name of IG Australia Pty Ltd. In addition to the disclaimer below, the material on this page does not contain a record of our trading prices, or an offer of, or solicitation for, a transaction in any financial instrument. IG accepts no responsibility for any use that may be made of these comments and for any consequences that result. No representation or warranty is given as to the accuracy or completeness of this information. Consequently any person acting on it does so entirely at their own risk. Any research provided does not have regard to the specific investment objectives, financial situation and needs of any specific person who may receive it. It has not been prepared in accordance with legal requirements designed to promote the independence of investment research and as such is considered to be a marketing communication. Although we are not specifically constrained from dealing ahead of our recommendations we do not seek to take advantage of them before they are provided to our clients.
-
It will be a quiet start to the week, with US markets on holiday for Martin Luther King Day, stopping earnings season in its tracks. The latest reporting period began on a muted note with mixed figures from the big banks, resulting in a muted end to last week's trading. Over the weekend Taiwan's presidential election contest resulted in a win for the pro-sovereignty party, a move likely to increase tensions in the region. The US and UK began strikes on Houthi rebels in response to attacks on shipping in the Red Sea, with more action likely on both sides, potentially boosting oil prices further. Key events for the week include Chinese GDP and Japanese inflation, while UK inflation and employment data is also scheduled for release.

-
-
-
-
Late on Wednesday, the US Securities and Exchange Commission (SEC) approved 11 applications, including those from BlackRock, Fidelity, Invesco and VanEck.
Most of these products are expected to start trading today, but the big question is what could it mean for Bitcoin? ETFs offer investors exposure to bitcoin without directly holding it. Earlier this week, analysts at Standard Chartered estimated ETFs could draw $50 billion to $100 billion this year alone. As of Wednesday, bitcoin market capitalisation stood at $913 billion. And what next? Some regulatory experts believe other innovative crypto products could follow, as from now on it will be a lot harder for the SEC to say no.
Bitcoin ETFs approved by SEC
The US Securities and Exchange Commission (SEC) has given the green light to 11 applications for Bitcoin exchange-traded funds (ETFs) from companies like BlackRock, Fidelity, Invesco, and VanEck. These ETFs allow people to invest in Bitcoin without actually owning it. Experts think that these ETFs could bring in a whopping $50 billion to $100 billion this year alone. This approval is seen as a positive sign for Bitcoin trading.
What next for Bitcoin?
If we look at the chart for Bitcoin, we can see that it has been bouncing back since hitting a low point in November 2022, with a massive increase of 209%. However, things have been a bit quiet recently, so people are wondering what's next for Bitcoin. Some experts in regulations think that by approving these Bitcoin ETFs, the SEC will find it harder to say no to other new cryptocurrency products in the future.
We don't have any immediate signs that Bitcoin's price will go up even more, but it's interesting to see how things will unfold and how much people will be interested in these newly approved ETFs. The approval by the SEC allows more mainstream adoption of Bitcoin, which could mean that its value goes even higher in the future. So, this is a big step forward for Bitcoin investors.
Overall, it seems like a positive development for Bitcoin with the approval of these ETFs. It offers a new way for people to invest in Bitcoin without having to actually buy and hold the cryptocurrency themselves. This could potentially attract more investors and push Bitcoin's value even higher. It will be interesting to see how things progress from here and how successful these ETFs will be in bringing in billions of dollars.
This information has been prepared by IG, a trading name of IG Markets Limited. In addition to the disclaimer below, the material on this page does not contain a record of our trading prices, or an offer of, or solicitation for, a transaction in any financial instrument. IG accepts no responsibility for any use that may be made of these comments and for any consequences that result. No representation or warranty is given as to the accuracy or completeness of this information. Consequently any person acting on it does so entirely at their own risk. Any research provided does not have regard to the specific investment objectives, financial situation and needs of any specific person who may receive it. It has not been prepared in accordance with legal requirements designed to promote the independence of investment research and as such is considered to be a marketing communication. Although we are not specifically constrained from dealing ahead of our recommendations we do not seek to take advantage of them before they are provided to our clients. See full non-independent research disclaimer and quarterly summary.
-
The surge in the Nikkei goes on, with the Japanese index breaking 35,000 for the first time in over three decades. It was a solid session across most of Asia as investors threw caution to the wind ahead of today's widely-anticipated US CPI data. Today's report will provide further indications as to whether inflation is still dropping towards the Fed's 2% target. While the FOMC itself only expects to cut by 75bps this year, markets are merrily pricing in 140 basis points of cuts. Herein lies the potential for at least some volatility this year, even within the context of a broader equity market uptrend. Futures currently point to a solid start for European and US markets, though traders should be prepared for volatility around the US inflation announcement.

-
All sessions on the IG platform, the stock of Boeing is adding to the 8% drop on Monday, the biggest one day drop since October 2022.
(Partial Video Script)
Boeing share price drops drastically as aircraft problems discovered
This drop in stocks all comes after a section of the fuselage fell from an Alaska Airlines Boeing 737 Max 9 on Friday. Reports are also coming in from United Airlines of bolts in need of "additional tightening" during inspections of Boeing 737 Max 9s. United Airlines said "installation issues" relating to door plugs would be "remedied" before the aircraft type would return to service. Other reports have come in too from Alaska Airlines which says it too, has since found "some loose hardware" on some Max 9s. The Federal Aviation Administration (FAA), which regulates air travel in the US, has grounded 171 planes of the same type.
Airbus stock hits record high
Meanwhile, Airbus stock hits a record high with Reuters reporting the company is nearing an order from Delta Air Lines for dozens of wide-body jets including extra A350-1000 aircraft. It says that, depending on last-minute negotiations, a deal could be made public as early as Friday when Delta reports its fourth-quarter earnings.
This information has been prepared by IG, a trading name of IG Markets Limited. In addition to the disclaimer below, the material on this page does not contain a record of our trading prices, or an offer of, or solicitation for, a transaction in any financial instrument. IG accepts no responsibility for any use that may be made of these comments and for any consequences that result. No representation or warranty is given as to the accuracy or completeness of this information. Consequently any person acting on it does so entirely at their own risk. Any research provided does not have regard to the specific investment objectives, financial situation and needs of any specific person who may receive it. It has not been prepared in accordance with legal requirements designed to promote the independence of investment research and as such is considered to be a marketing communication. Although we are not specifically constrained from dealing ahead of our recommendations we do not seek to take advantage of them before they are provided to our clients. See full non-independent research disclaimer and quarterly summary.
-
Coinbase Global all-sessions rise after at least five brokerages raised their price targets on the crypto exchange. IGTV financial analyst Angeline Ong takes a look at how this is linked to bitcoin ETF approval requests.
Coinbase's share price on the rise
Coinbase, a leading platform for buying and selling cryptocurrencies, has recently seen a notable increase in its stock price. This means that the value of the company's shares has gone up, and it's good news for investors. In fact, one brokerage called Needham has even named Coinbase as its top pick for 2024 and added it to its list of stocks that it strongly believes will do well in the future.
This rise in Coinbase's stock price is part of a larger trend in the cryptocurrency markets. Since June, these markets have been experiencing significant growth, attracting the attention of big financial companies like BlackRock. These companies are even seeking regulatory approval to set up a Bitcoin exchange-traded fund, showing that they are becoming more interested in cryptocurrencies.
Coinbase's impressive performance
But what makes Coinbase's performance so impressive is how much its stock price has gone up compared to other financial markets. In 2023 alone, it increased by a whopping 391%, which is a lot more than other major indices on Wall Street. This highlights the fact that investing in cryptocurrencies can be highly profitable.
Overall, Coinbase's stock has risen because various brokerages have given positive price targets for the company, the cryptocurrency markets have been rallying since June, and traditional financial firms are becoming more interested. Coinbase's strong performance compared to other markets and indices shows just how appealing and potentially lucrative investing in cryptocurrencies can be.
So, if you're curious about getting involved in trading cryptocurrencies like Bitcoin, it's worth taking a closer look at Coinbase. With its increasing stock price and the interest it's attracting from big financial players, it could be a promising investment opportunity. Just remember that investing in cryptocurrencies comes with its own risks, so it's essential to do your research and understand what you're getting into.
This information has been prepared by IG, a trading name of IG Markets Limited. In addition to the disclaimer below, the material on this page does not contain a record of our trading prices, or an offer of, or solicitation for, a transaction in any financial instrument. IG accepts no responsibility for any use that may be made of these comments and for any consequences that result. No representation or warranty is given as to the accuracy or completeness of this information. Consequently any person acting on it does so entirely at their own risk. Any research provided does not have regard to the specific investment objectives, financial situation and needs of any specific person who may receive it. It has not been prepared in accordance with legal requirements designed to promote the independence of investment research and as such is considered to be a marketing communication. Although we are not specifically constrained from dealing ahead of our recommendations we do not seek to take advantage of them before they are provided to our clients. See full non-independent research disclaimer and quarterly summary.
-
Oil drops on Saudi price cuts, gold and silver prices also under pressure
Outlook on Brent crude oil, gold and silver as Saudi Arabia reduces February official selling price for Asia.
 Source: Bloomberg
Brent crude oil takes hit on Saudi price cuts
Oil - Brent Crude fell by over 3% on Monday as Saudi Arabia announced a reduction in the February official selling price (OSP) of its primary Arab Light crude oil for Asia by $2 to $1.50 a barrel above the benchmark, its lowest level in 27 months. It did so amid increasing global supply, especially from non-OPEC producers, and dwindling demand.
The front month futures contract held above last week’s 74.81 low, though. Were it to give way, the 7 December low at 73.69 would likely represent the next downside target ahead of the 72.50 December low.
Resistance can now be spotted around Friday’s 77.60 low ahead of the October-to-January downtrend line at 79.22 and last week’s 79.35 high.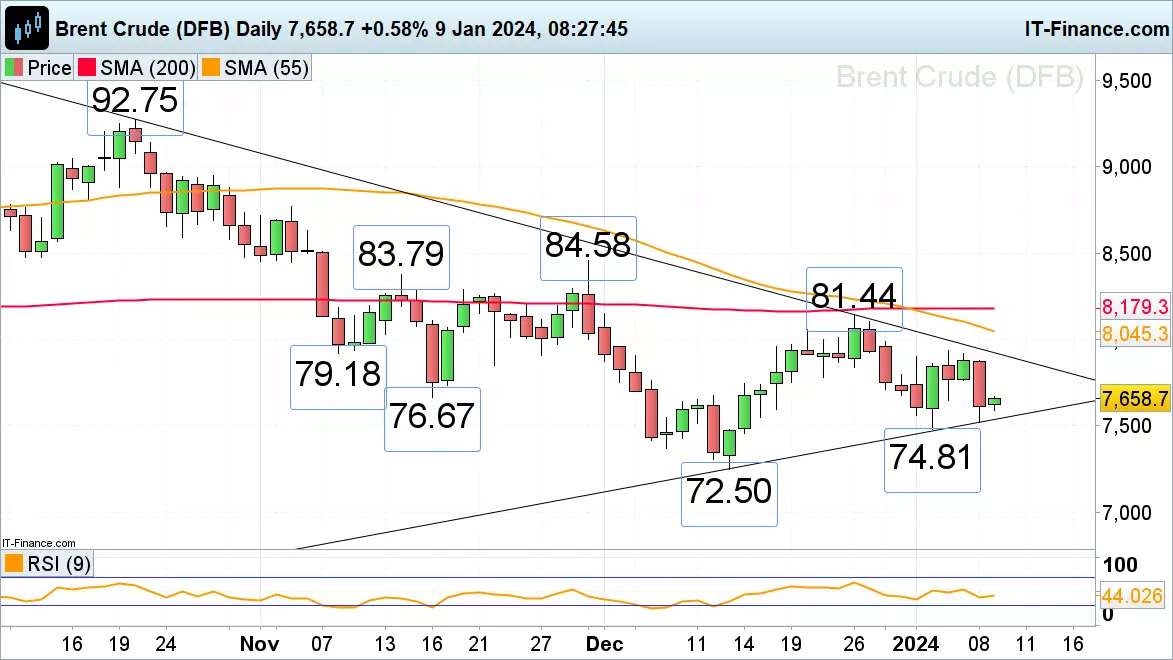 Source: ProRealTime
Gold price continues to slide
Spot Gold’s drop from its $2,088 per troy ounce late December high amid an appreciating US dollar has so far taken it to Monday’s $2,017 low from where it is trying to recover. Slightly further down support can be found along the 55-day simple moving average (SMA) at $2,014 and, more significantly, between the October and late November highs at $2,009 to $2,007.
Resistance above the breached October-to-January uptrend line, now because of inverse polarity a resistance line, at $2,038 can be spotted at Friday’s $2,064 high. While remaining below it, downside pressure should retain the upper hand.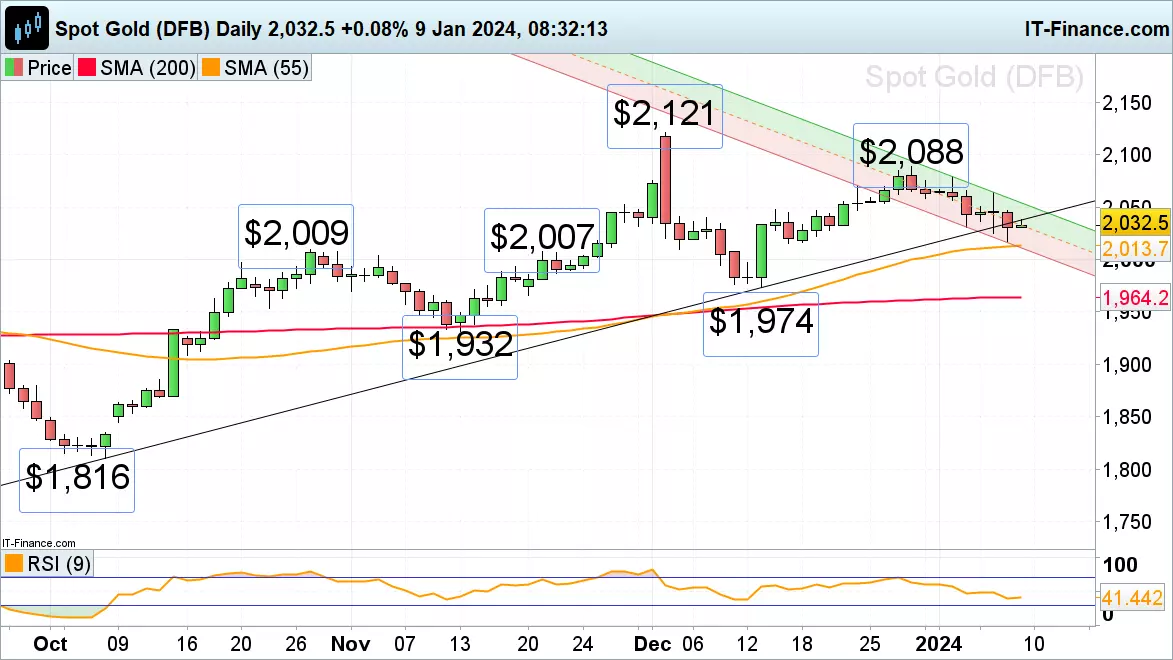 Source: ProRealTime
Silver price hovers above support
Spot Silver (5000oz)’s descent from its late December per troy ounce high at $24.60 on the back of an appreciating US dollar took it to last week’s $22.84 low, above which it has been hovering since. Slightly below it remains the $22.51 December low which should act as support, were it to be retested. Further down sits the November low at $21.89.
Minor resistance above Tuesday’s $23.37 intraday high can be seen between Friday’s high and the 55- and 200-day simple moving averages (SMA) at $23.51 to $23.66. While this resistance area caps, downside pressure should continue to dominate.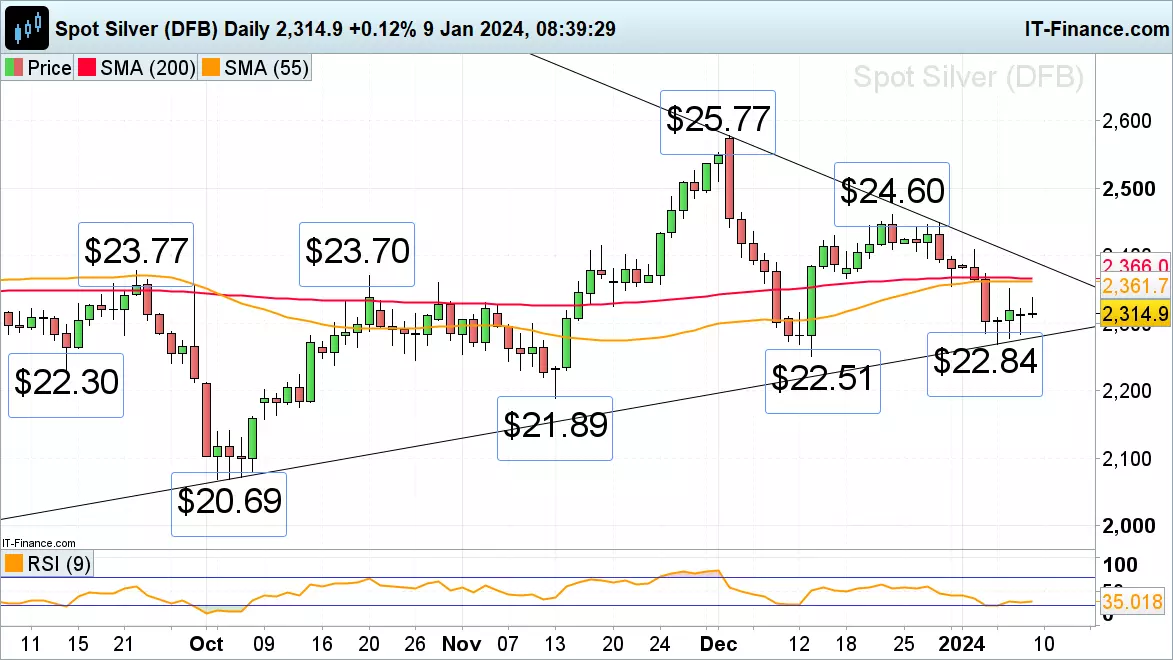 Source: ProRealTime
This information has been prepared by IG, a trading name of IG Markets Limited. In addition to the disclaimer below, the material on this page does not contain a record of our trading prices, or an offer of, or solicitation for, a transaction in any financial instrument. IG accepts no responsibility for any use that may be made of these comments and for any consequences that result. No representation or warranty is given as to the accuracy or completeness of this information. Consequently any person acting on it does so entirely at their own risk. Any research provided does not have regard to the specific investment objectives, financial situation and needs of any specific person who may receive it. It has not been prepared in accordance with legal requirements designed to promote the independence of investment research and as such is considered to be a marketing communication. Although we are not specifically constrained from dealing ahead of our recommendations we do not seek to take advantage of them before they are provided to our clients. See full non-independent research disclaimer and quarterly summary.
-
Dow and Nikkei 225 rally, but Hang Seng slips lower again
Falling inflation expectations and Saudi Arabia’s move to cut export prices for oil meant that equities have finally found their footing after a difficult start to the year. However the Hang Seng falls once again.
 Source: Bloomberg
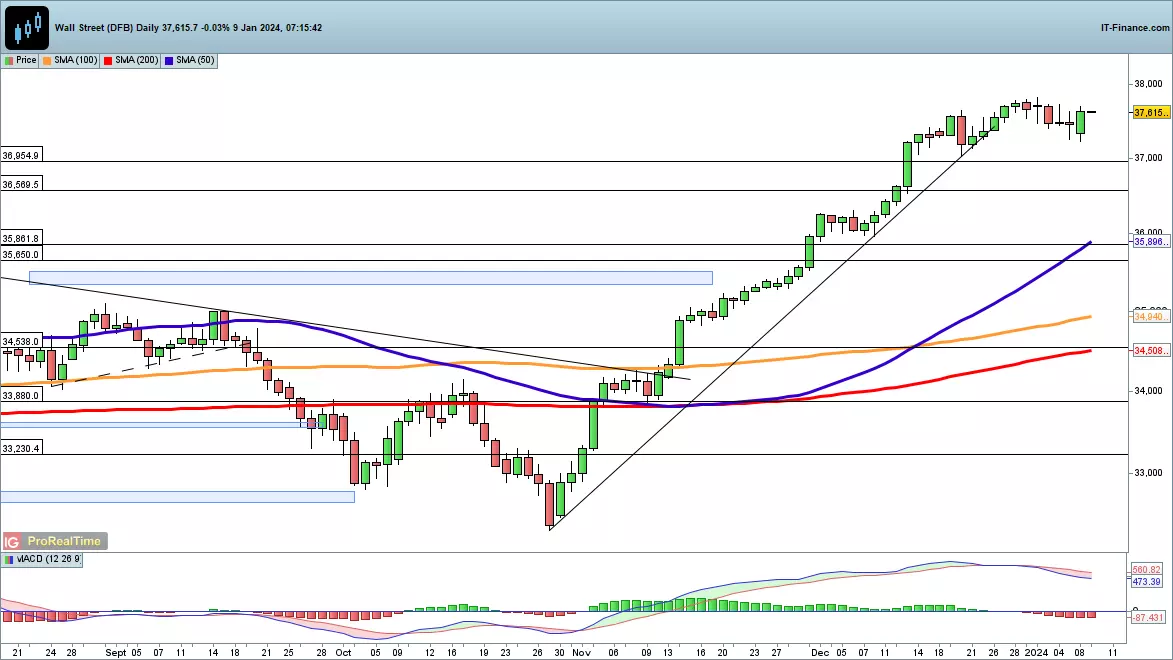
Dow rallies once more
Monday saw the index rebound from the lows of the session, clawing back losses from the final two sessions of last week.
A push to new record highs may well now develop, and beyond this the 38,000 level comes into view. This cancels out a short-term negative view and revives the uptrend, albeit at a potentially overextended level.
A reversal back below 37,250 would be needed to revive the short-term negative view.
 Source: ProRealTime
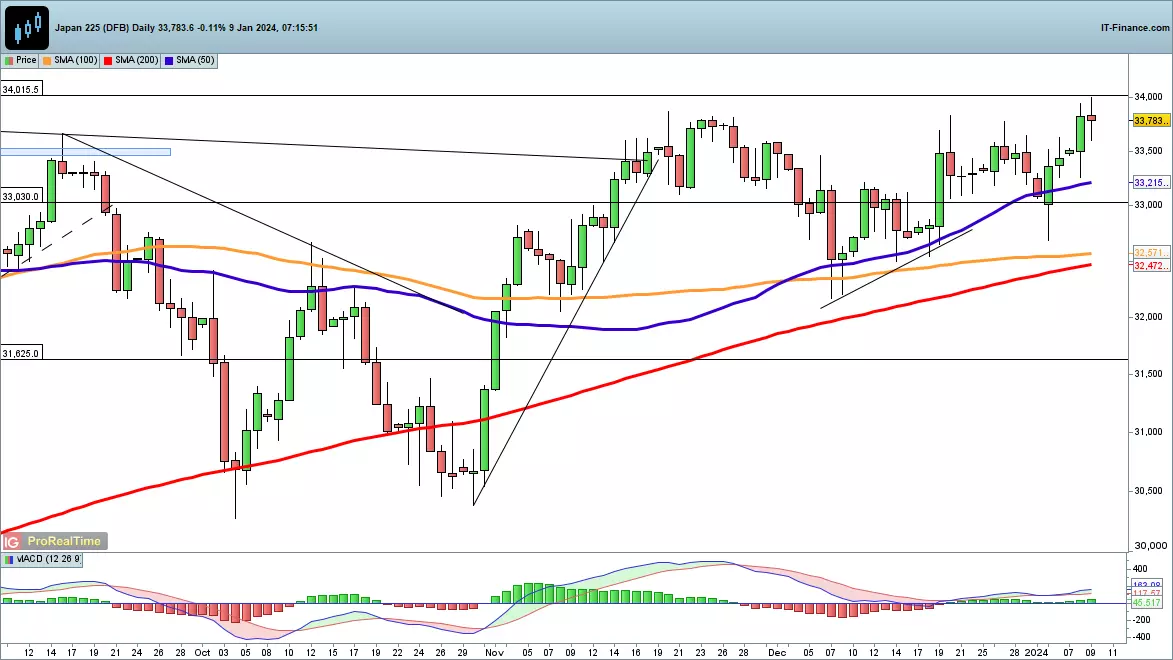
Nikkei 225 testing recent highs
Further gains on Monday helped to lift the index back to the November highs, and now a test of 34,000 seems to beckon.
A move above 34,000 would put the index at its highest levels since 1989, and would mark the end of the extended consolidation period for the index that has been in place since the end of June.
Since last week’s low the price has gained over 3%, and it would need a close back below 33,000 to put the sellers back in charge in the short-term.
 Source: ProRealTime
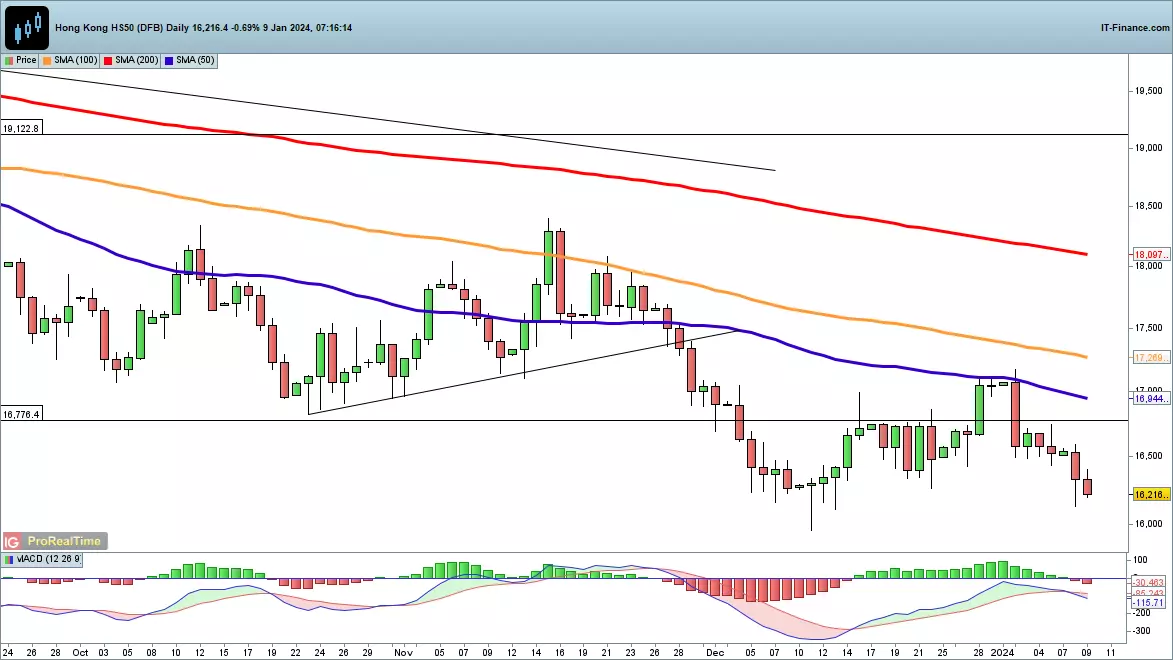
Hang Seng back on a downward path
This index has resumed its downward move, after the brief rebound in late December.
Gains faltered at the 50-day simple moving average (SMA), resulting in a textbook reversal that has taken the index back towards the December lows, the lowest level since November 2022. Further declines head towards the November low at 14,640.
A revival above the 50-day SMA and 17,170, the highs of last week, would be needed to suggest a short-term rebound has begun.
 Source: ProRealTime
This information has been prepared by IG, a trading name of IG Markets Limited. In addition to the disclaimer below, the material on this page does not contain a record of our trading prices, or an offer of, or solicitation for, a transaction in any financial instrument. IG accepts no responsibility for any use that may be made of these comments and for any consequences that result. No representation or warranty is given as to the accuracy or completeness of this information. Consequently any person acting on it does so entirely at their own risk. Any research provided does not have regard to the specific investment objectives, financial situation and needs of any specific person who may receive it. It has not been prepared in accordance with legal requirements designed to promote the independence of investment research and as such is considered to be a marketing communication. Although we are not specifically constrained from dealing ahead of our recommendations we do not seek to take advantage of them before they are provided to our clients. See full non-independent research disclaimer and quarterly summary.
-
Bitcoin (BTC/USD) Pumping Higher as SEC ETF Deadline Nears
Jan 8, 2024 5:03 PM | Nick Cawley, Senior StrategistBITCOIN (BTC) PRICES, CHARTS, AND ANALYSIS:
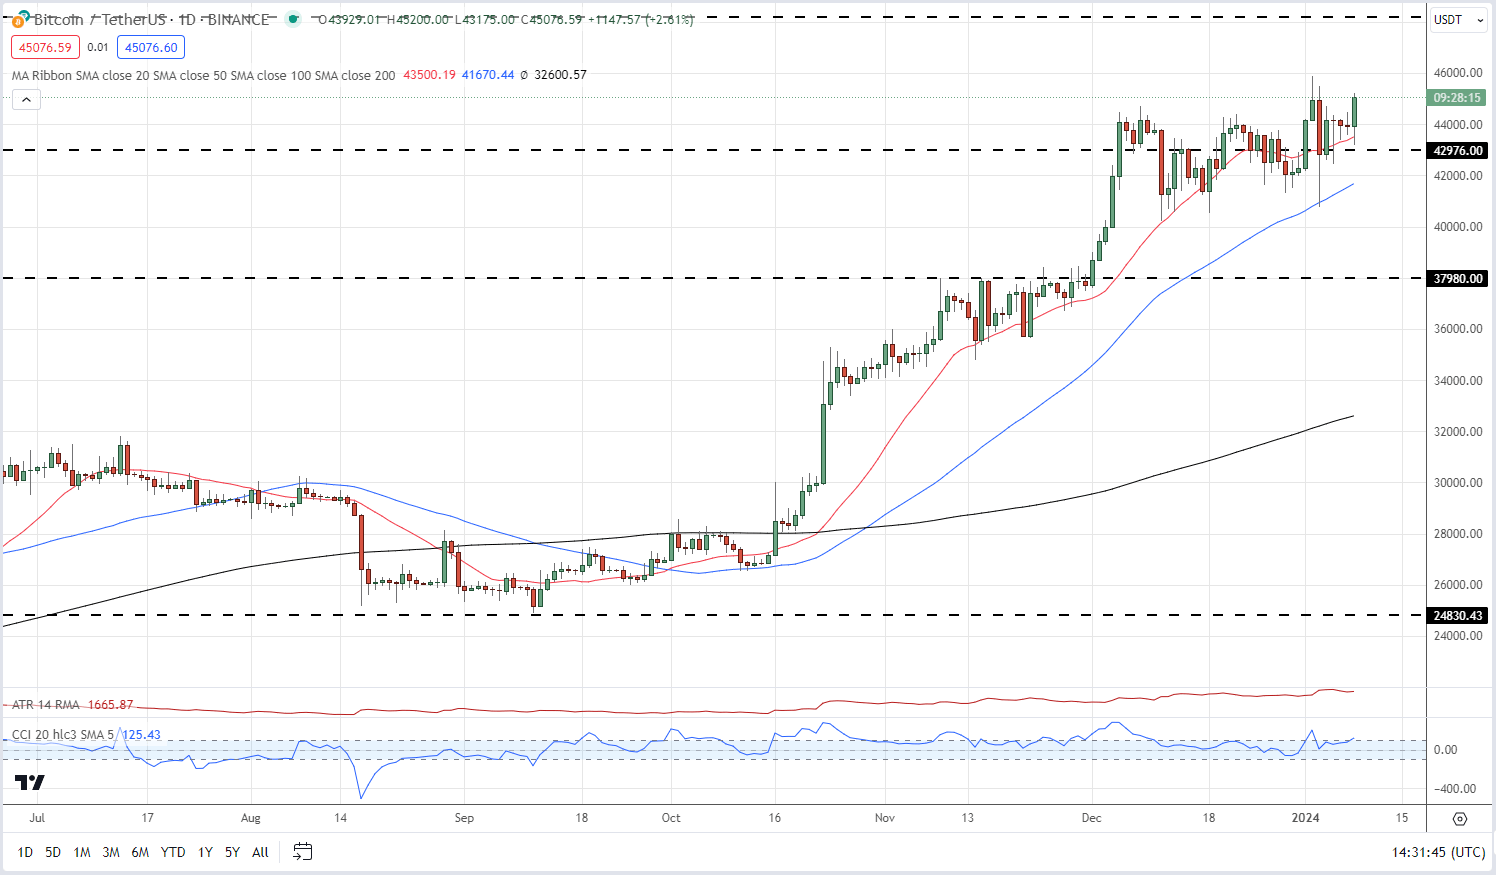
- Bitcoin pressing against $45k.
- Is an ETF approval a ‘buy the rumor, sell the fact’ event?
Bitcoin ETF fever is pushing the price of the largest cryptocurrency by market capitalization back to highs last seen in April 2022. At least 10 companies have handed in amended and updated Bitcoin ETF applications and are waiting to hear from the SEC. The ARK 21Shares Bitcoin ETF will be the first exchange-traded fund ruled on by the Securities and Exchange Commission (SEC). The SEC has until January 10th to approve or reject this ETF and the thinking is that if this application is approved, then the other 10 or so applications will also be approved to prevent any first-mover advantage.
The latest Bitcoin rally is being driven by reports that these applicants are all posting their ETF fee structures with two firms announcing 0% fees for the first six months. A number of these ETF applicants have also launched Bitcoin commercials over the last 10 days, adding fuel to the fire that the SEC will approve a physically-backed Bitcoin ETF this week. The near 10% sell-off candle on January 3rd was prompted by a story that these spot ETFs would not be approved this week, highlighting the current volatility in the cryptocurrency space. There is also a growing feeling in the market that an SEC approval would be a ‘buy the rumor/sell the fact’ event, especially after Bitcoin’s strong run-up over the past months. As always, the cryptocurrency space remains highly volatile and prone to wild swings on rumors as well as facts.
Bitcoin (BTC) Slumps on ETF Rejection Rumor, All Eyes on the SEC
From a technical outlook, the daily chart remains positive. BTC/USD remains above all three simple moving averages and higher highs and higher lows can be seen on the chart since mid-September. A break above the January 2nd high at $45.88k would leave $48.19k vulnerable before $52k comes into play. To the downside, $43k is initial support while $38k should hold if the market sells off sharply.
BITCOIN DAILY PRICE CHART

Charts via TradingView
What is your view on Bitcoin – bullish or bearish?
-
Bitcoin (BTC/USD) Pumping Higher as SEC ETF Deadline Nears
Jan 8, 2024 5:03 PM | Nick Cawley, Senior StrategistBITCOIN (BTC) PRICES, CHARTS, AND ANALYSIS:
- Bitcoin pressing against $45k.
- Is an ETF approval a ‘buy the rumor, sell the fact’ event?
Bitcoin ETF fever is pushing the price of the largest cryptocurrency by market capitalization back to highs last seen in April 2022. At least 10 companies have handed in amended and updated Bitcoin ETF applications and are waiting to hear from the SEC. The ARK 21Shares Bitcoin ETF will be the first exchange-traded fund ruled on by the Securities and Exchange Commission (SEC). The SEC has until January 10th to approve or reject this ETF and the thinking is that if this application is approved, then the other 10 or so applications will also be approved to prevent any first-mover advantage.
The latest Bitcoin rally is being driven by reports that these applicants are all posting their ETF fee structures with two firms announcing 0% fees for the first six months. A number of these ETF applicants have also launched Bitcoin commercials over the last 10 days, adding fuel to the fire that the SEC will approve a physically-backed Bitcoin ETF this week. The near 10% sell-off candle on January 3rd was prompted by a story that these spot ETFs would not be approved this week, highlighting the current volatility in the cryptocurrency space. There is also a growing feeling in the market that an SEC approval would be a ‘buy the rumor/sell the fact’ event, especially after Bitcoin’s strong run-up over the past months. As always, the cryptocurrency space remains highly volatile and prone to wild swings on rumors as well as facts.
Bitcoin (BTC) Slumps on ETF Rejection Rumor, All Eyes on the SEC
From a technical outlook, the daily chart remains positive. BTC/USD remains above all three simple moving averages and higher highs and higher lows can be seen on the chart since mid-September. A break above the January 2nd high at $45.88k would leave $48.19k vulnerable before $52k comes into play. To the downside, $43k is initial support while $38k should hold if the market sells off sharply.
BITCOIN DAILY PRICE CHART
Charts via TradingView
What is your view on Bitcoin – bullish or bearish?
-
Asian markets made gains overnight, following on from the rally on Wall Street on Monday that marked a strong start to the week after the lacklustre beginning of the year. Tech stocks led the way, supported by falling yields, after a survey of inflation expectations by the New York Fed showed that fears of rising prices were continuing to abate. In addition, Fed governor Bowman said that she would support eventual rate cuts, shifting away from her more hawkish stance. Oil prices dropped sharply yesterday after Saudi Arabia cut its official selling price for February. All eyes are on the US inflation readings later in the week, which is closely followed by the start of earnings season.

-
Bitcoin (BTC) Slumps on ETF Rejection Rumor, All Eyes on the SEC
Jan 3, 2024 | Nick Cawley, Senior StrategistBitcoin slumps as report suggests SEC will reject all ETF proposals in January.
A bearish report by crypto financial services company Martixport is said to be behind the sharp sell-off in Bitcoin. The report suggested that despite all the recent meetings between ETF applicants and SEC staff, and subsequent amendments, all applications will fall short of SEC requirements and will be denied in January. The report added that these requirements may be fulfilled by Q2 2024.
-
Boeing share price trades around 8% lower in pre-open on the IG platform.
 Source: Bloomberg
Boeing stock drops sharply after Alaska Airlines incident
Boeing Co (All Sessions)’s attempts to put its best foot forward in 2024 have been dealt a blow by the incident in Alaska, sending the shares lower on the IG platform this morning.
Boeing's recent stock drop and setbacks are undoubtedly concerning for the company. The blowout incident with an Alaska Airlines plane has once again raised regulatory scrutiny on Boeing, just as it was seeking approval for new models of its Max jet. This has resulted in a 7.7% drop in Boeing's stock on the IG platform.
The timing of these setbacks is critical for Boeing, as it is trying to catch up with its competitor Airbus, which has gained market share following the issues with the Max airliners in previous years. The delays in aircraft production will not only impact Boeing's financial position but also undermine its new strategy.
Moreover, the Alaska incident will likely hinder Boeing's efforts to enter the Chinese market, which has already been strained due to trade tensions. This setback will further delay Boeing's return to profitability, with net income expected to remain negative despite a rebound from the poor performance in 2022.
Although Boeing's Q3 revenue of $18.1 billion showed a 13% year-on-year increase, driven by growth in commercial airplanes and global services segments, there were challenges in commercial airplane deliveries, which declined by 6% compared to the previous year. The company also lowered its 2023 delivery outlook due to fuselage-related production issues.
Boeing's core operating margin improved in Q3, standing at -6.6% compared to -19.2% in the prior-year quarter. However, the adjusted loss per share narrowed from the previous year, indicating some progress in mitigating losses.Boeing share price technical analysis
Even before the Alaska Airlines incident, the Boeing share price had dropped by around 7% from its 2 ¾ year December $267.54 high to last week’s $243.0 low.
Boeing Weekly Candlestick Chart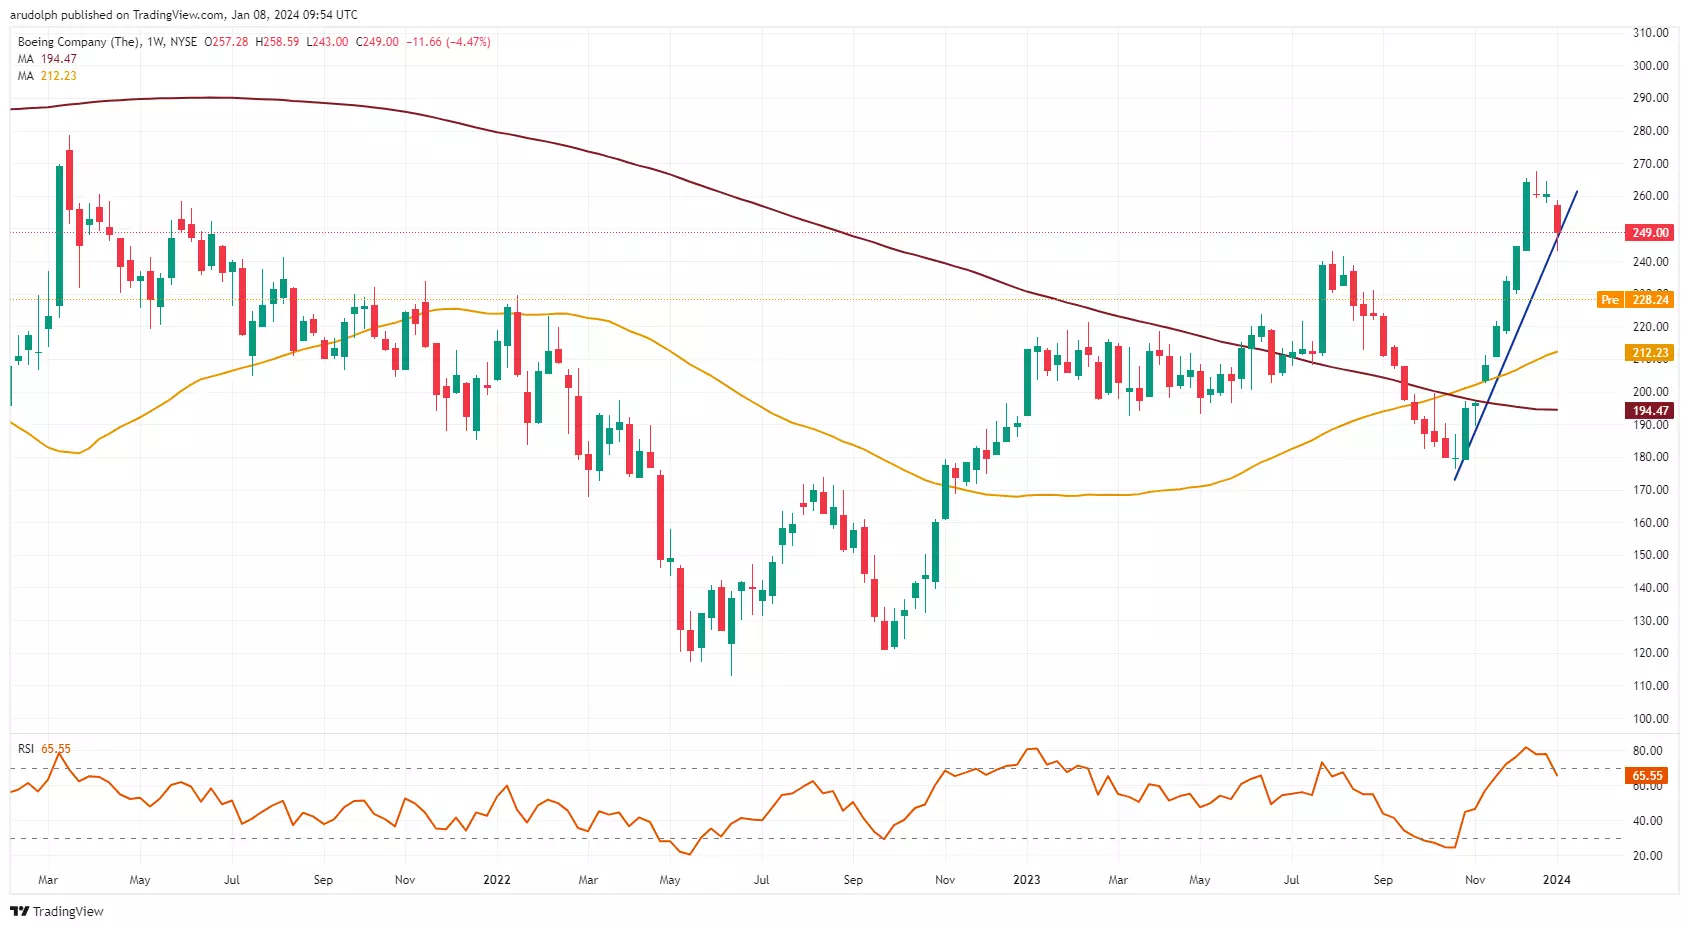 Source: Tradingview
The steep October-to-January uptrend line had already been breached before the incident happened with the 50% retracement of the advance seen since then and the 55-day simple moving average (SMA) at $221.90 to $221.84 representing possible downside targets.
More significant potential support can be found along the 200-day simple moving average (SMA) at $213.77 and 61.8% Fibonacci retracement at $211.11.Boeing Daily Candlestick Chart
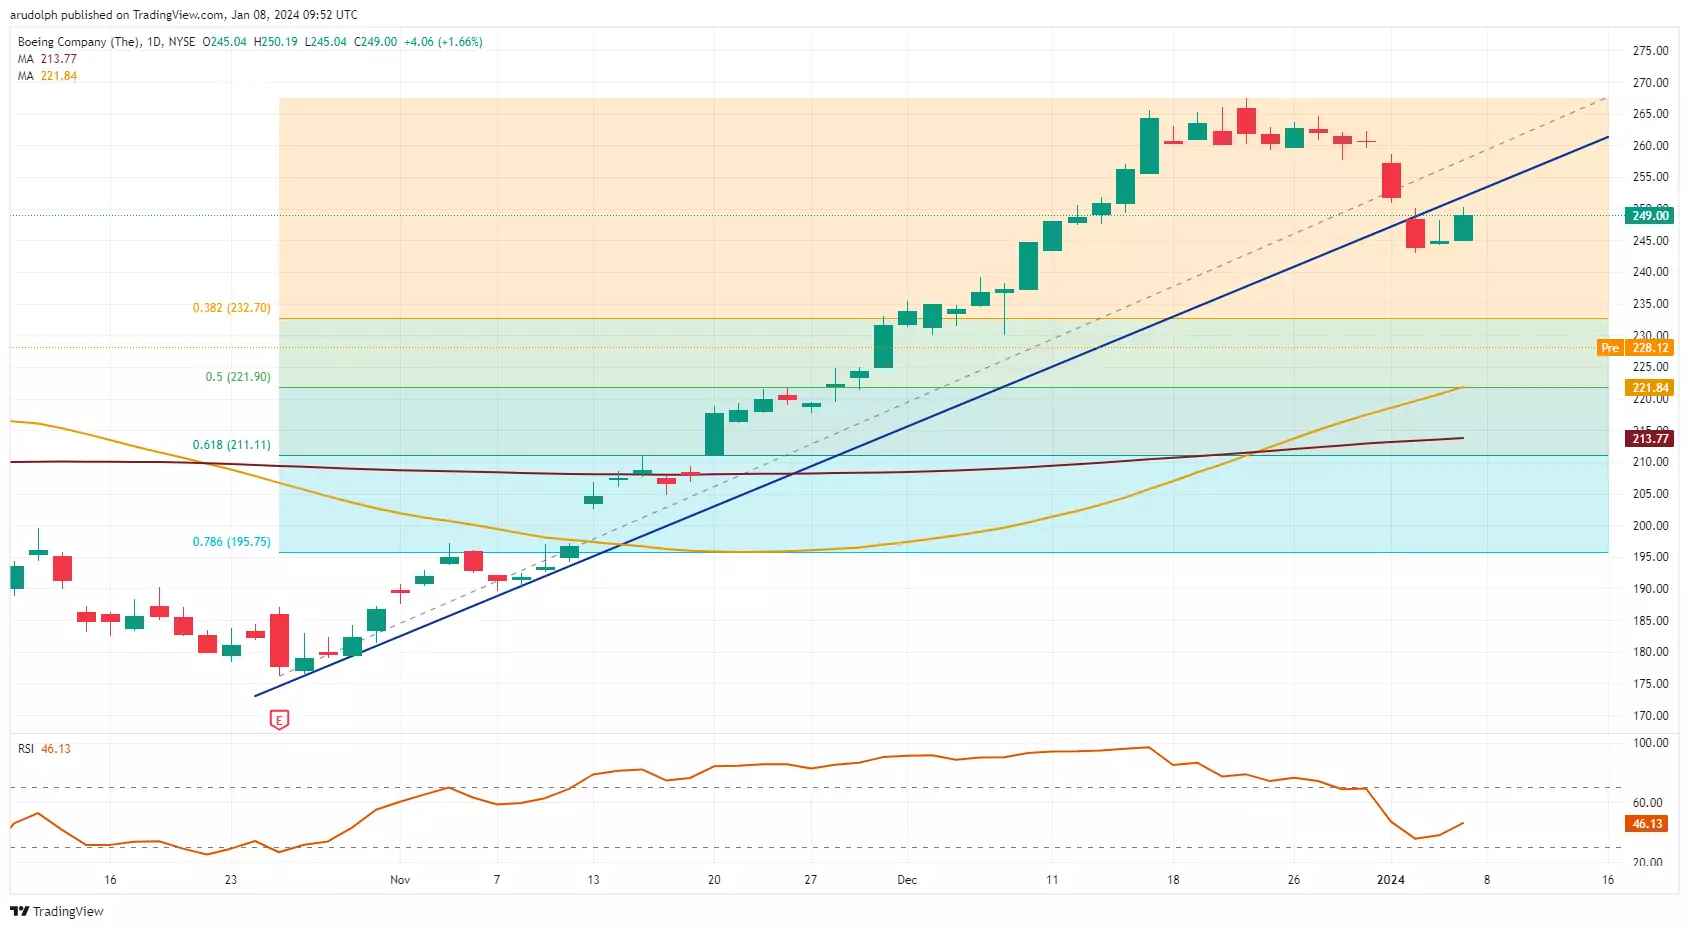 Source: Tradingview
Potential resistance can be found at last week’s low at $243.00 which represents the top of this week’s price gap.
This information has been prepared by IG, a trading name of IG Markets Limited. In addition to the disclaimer below, the material on this page does not contain a record of our trading prices, or an offer of, or solicitation for, a transaction in any financial instrument. IG accepts no responsibility for any use that may be made of these comments and for any consequences that result. No representation or warranty is given as to the accuracy or completeness of this information. Consequently any person acting on it does so entirely at their own risk. Any research provided does not have regard to the specific investment objectives, financial situation and needs of any specific person who may receive it. It has not been prepared in accordance with legal requirements designed to promote the independence of investment research and as such is considered to be a marketing communication. Although we are not specifically constrained from dealing ahead of our recommendations we do not seek to take advantage of them before they are provided to our clients. See full non-independent research disclaimer and quarterly summary.
-
2 hours ago, Raslghoul said:
Traders implement versatile trading strategies to win trades. What are the most effective fx trading strategies?
Hi @Raslghoul
Here are a few links you can have a look at:
The complete guide to trading strategies and styles
The complete guide to trading strategies
Best forex trading strategies and tips
I hope this helps
All the best - MongiIG
-
 1
1
-
-
The US dollar remained steady on Monday morning after being shaken on Friday following the release of non-farm payrolls data.
Friday's figures showed that the US economy created 216,000 jobs in the last month of 2023, more than the 173,000 in November and higher that the 170,000 expected. Meanwhile, the unemployment rate remained at 3.7%, while average hourly earnings rose to 4.1% year-over-year. The next test for the dollar will be US consumer price index data on Thursday. IGTV’s Angela Barnes has this overview.
(AI Video Summary)
US dollar steadies following jobs data release
The US dollar had a bit of a bumpy ride after the release of the latest jobs report, but it has since settled down. The report showed that the US economy added 216,000 jobs in December 2023, which was better than expected. The unemployment rate remained steady, and wages actually increased more than economists predicted. This suggests that the Federal Reserve is unlikely to change interest rates in the near future. The anticipation for a rate cut in March has also decreased since the report came out. Now, the focus is on the upcoming release of consumer price index (CPI) data, which is expected to show a slight increase in prices. Overall, the US dollar is holding its own against other currencies, showing a small increase for the day.
CPI data could impact the US dollar
So, what does all of this mean? Essentially, the US economy is still growing and adding jobs, which is a good sign. The Federal Reserve, which is like the country's central bank, is in charge of setting interest rates. The strong jobs report suggests that they won't feel the need to cut rates anytime soon. This has made traders less certain that a rate cut will happen in March. Instead, they are now looking at the CPI data, which tells us about changes in prices. If the CPI data shows prices going up a bit, it could have an impact on the US dollar and how it performs against other currencies. But for now, the US dollar is doing alright and holding its ground.
This information has been prepared by IG, a trading name of IG Markets Limited. In addition to the disclaimer below, the material on this page does not contain a record of our trading prices, or an offer of, or solicitation for, a transaction in any financial instrument. IG accepts no responsibility for any use that may be made of these comments and for any consequences that result. No representation or warranty is given as to the accuracy or completeness of this information. Consequently any person acting on it does so entirely at their own risk. Any research provided does not have regard to the specific investment objectives, financial situation and needs of any specific person who may receive it. It has not been prepared in accordance with legal requirements designed to promote the independence of investment research and as such is considered to be a marketing communication. Although we are not specifically constrained from dealing ahead of our recommendations we do not seek to take advantage of them before they are provided to our clients. See full non-independent research disclaimer and quarterly summary.
-
Q4 2023 earnings growth expected to slow compared to Q3.
 Source: Bloomberg
Earnings growth to slow
The current expected earnings growth rate is 2.4%, which is lower than the estimated growth rate of 8.1% on September 30. If 2.4% is the actual growth rate, it will mark the second consecutive quarter of year-over-year earnings growth for the US 500 index, but at a lower rate compared to the third quarter.
The earnings outlook for S&P 500 companies in the fourth quarter is currently more pessimistic compared to historical averages. Analysts have lowered their earnings estimates for Q4 2023 by a larger margin than usual, resulting in a decrease in estimated earnings for the quarter. This decline is larger than the 5-year and 10-year averages and represents the largest decrease in quarterly Earnings Per Share (EPS) estimate since Q1 2023.
Negative guidance above average
In terms of guidance, a higher percentage of S&P 500 companies have issued negative EPS guidance for Q4 2023 compared to the average. This suggests that more companies are expecting lower earnings for the quarter. The number and percentage of companies issuing negative EPS guidance are above the 5-year and 10-year averages.
Among the sectors, Communication Services, Utilities, and Consumer Discretionary are projected to report year-over-year earnings growth, while Energy, Materials, and Health Care sectors are predicted to report a decline in earnings.
Analysts have also decreased their revenue estimates for the quarter. The current expected year-over-year revenue growth rate for the S&P 500 is 3.1%, which is lower than the expectations on September 30. If 3.1% is the actual revenue growth rate, it will mark the 12th consecutive quarter of revenue growth for the index.
Longer-term outlook more encouraging
Looking ahead, analysts expect earnings growth of 6.2% for Q1 2024, 10.5% for Q2 2024, and 11.5% for the full year 2024.
The forward 12-month price-to-earnings (P/E) ratio for the S&P 500 is currently 19.3, which is above the 5-year and 10-year averages. It is also higher than the forward P/E ratio recorded at the end of the third quarter.
This information has been prepared by IG, a trading name of IG Markets Limited. In addition to the disclaimer below, the material on this page does not contain a record of our trading prices, or an offer of, or solicitation for, a transaction in any financial instrument. IG accepts no responsibility for any use that may be made of these comments and for any consequences that result. No representation or warranty is given as to the accuracy or completeness of this information. Consequently any person acting on it does so entirely at their own risk. Any research provided does not have regard to the specific investment objectives, financial situation and needs of any specific person who may receive it. It has not been prepared in accordance with legal requirements designed to promote the independence of investment research and as such is considered to be a marketing communication. Although we are not specifically constrained from dealing ahead of our recommendations we do not seek to take advantage of them before they are provided to our clients. See full non-independent research disclaimer and quarterly summary.


IG Morning Call
in General Trading Strategy Discussion
Posted
Investors are turning risk averse once again, as Donald Trump's strong victory in Iowa and hawkish comments from European policymakers raise fears of a resurgence in volatility. Trump won a firm victory, as expected, and investors are bracing themselves for a volatile campaign. European policymakers in Davos pushed back against the prospect of deep rate cuts. Asian markets fell back, with the Nikkei 225 finally shedding some ground after its recent surge, and the Hang Seng breaking below 16,000 once again to hit a 14-month low. The UK unemployment rate held at 4.2% in November, while wages grew at a slower-than-expected pace of 6.5%. US markets return from their holiday, joining in the cautious mood.