

MongiIG
-
Posts
9,887 -
Joined
-
Last visited
-
Days Won
41
Content Type
Profiles
Forums
Blogs
Events
Community Tutorials
Store
Posts posted by MongiIG
-
-
Tesla’s stock has fallen further after a poorly-received earnings report this week, with a gloomy outlook contributing to the bearish turn in price.
 Source: Bloomberg
Tesla slumps after earnings release
Tesla shares experienced a significant decline on Thursday, reaching their lowest point in eight months. The drop in share price was largely attributed to disappointment surrounding the company's latest earnings report, which led to a wave of selling.
In its fourth-quarter (Q4) earnings update released on Tuesday, Tesla reported $25.2 billion in sales and earnings per share (EPS) of $0.71. These figures fell short of average analyst estimates of $25.6 billion and $0.73 respectively, according to FactSet.
Price cuts drive weakness in profits
One of the key factors contributing to the decline in profits was Tesla's decision to implement price cuts on its cars. This move resulted in a significant decrease in profit margins, with the company's gross margin during the Q4 standing at 17.6%, the lowest since 2019 and down over 600 basis points (bp) from the previous year.
Tesla's profits for the last quarter dropped by 40% compared to the same period in 2022, while revenue only experienced a modest 3% year-over-year growth.
Full-year outlook remains weak
For the full year of 2023, Tesla reported EPS of vague warning of "notably lower" output in 2024. This lack of clear guidance from CEO Elon Musk and the company raised further doubts and criticism.
Tesla stock price – technical analysis
The Tesla share price has resumed its long-term downtrend which began in November 2021 and is now trading at levels last seen in May 2023 with the March and April 2023 lows at $163.91 to $152.37 being eyed.
Tesla weekly chart
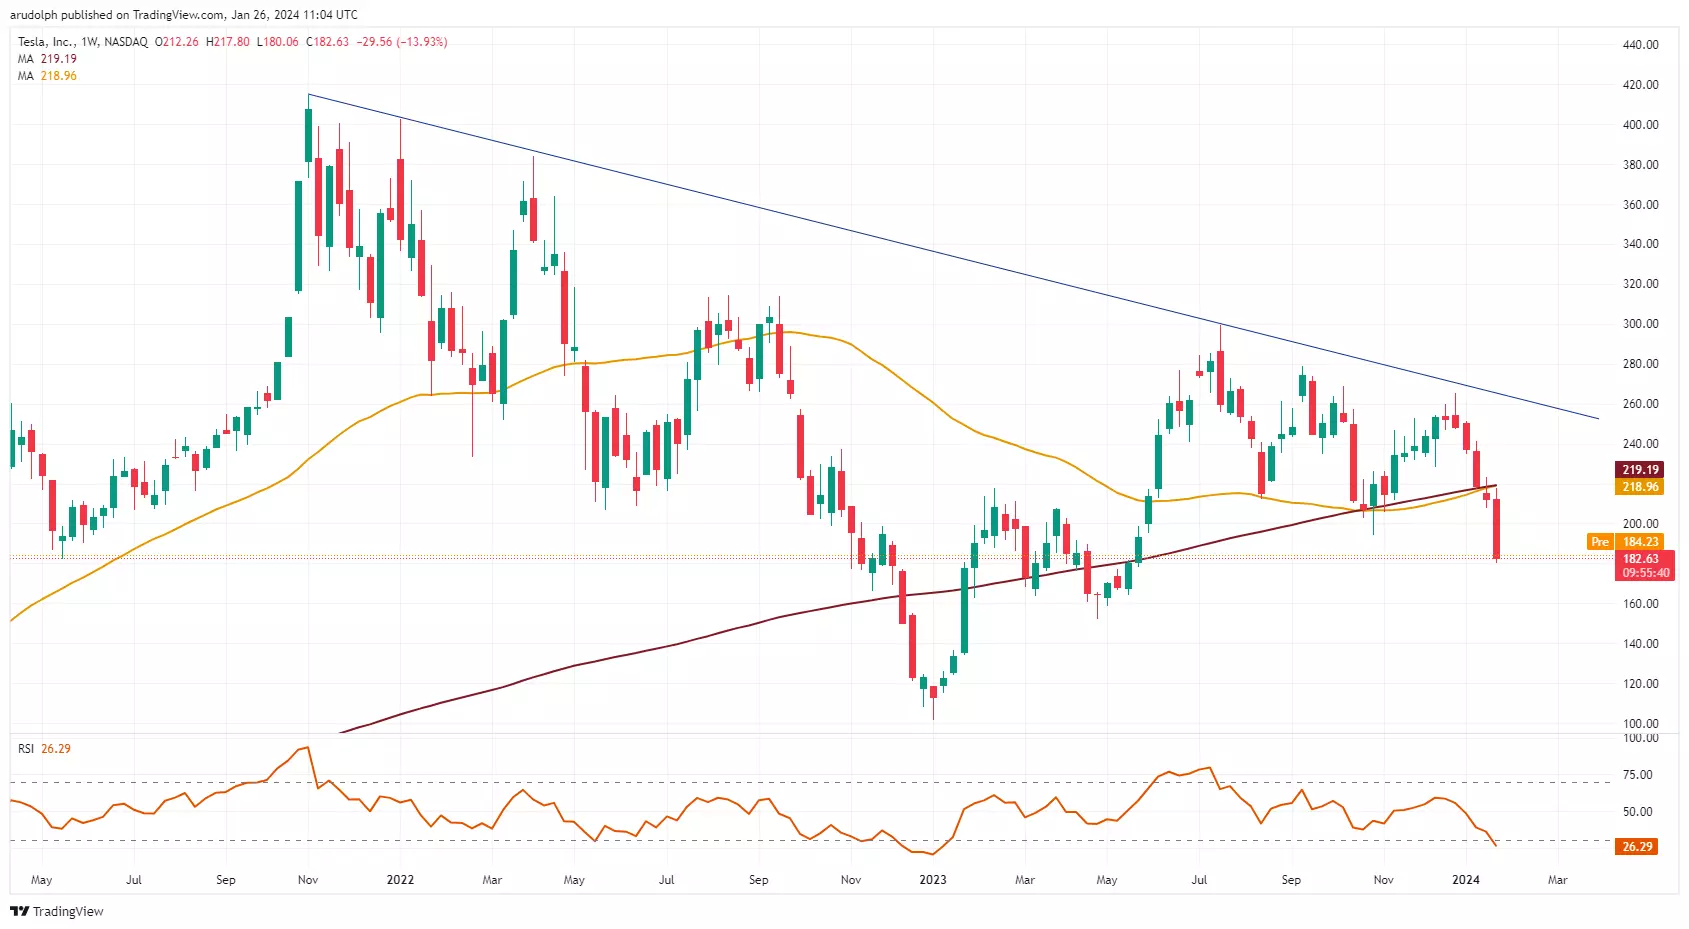 Source: TradingView
The fact that a daily chart, and it being Friday, also a weekly chart close will most likely be made below the October 2023 trough at $194.07 is technically bearish.
Resistance now comes in at the late-October 2023 low at $194.07 and also at Thursday’s $206.77 to $193.00 price gap.
Only a currently unexpected bullish reversal and rise above the last reaction high on the daily candlestick chart – a daily high which is higher than that of the preceding and following day – would lead technical analysts to question their bearish outlook. This was made on Monday at $217.80.
Tesla daily chart
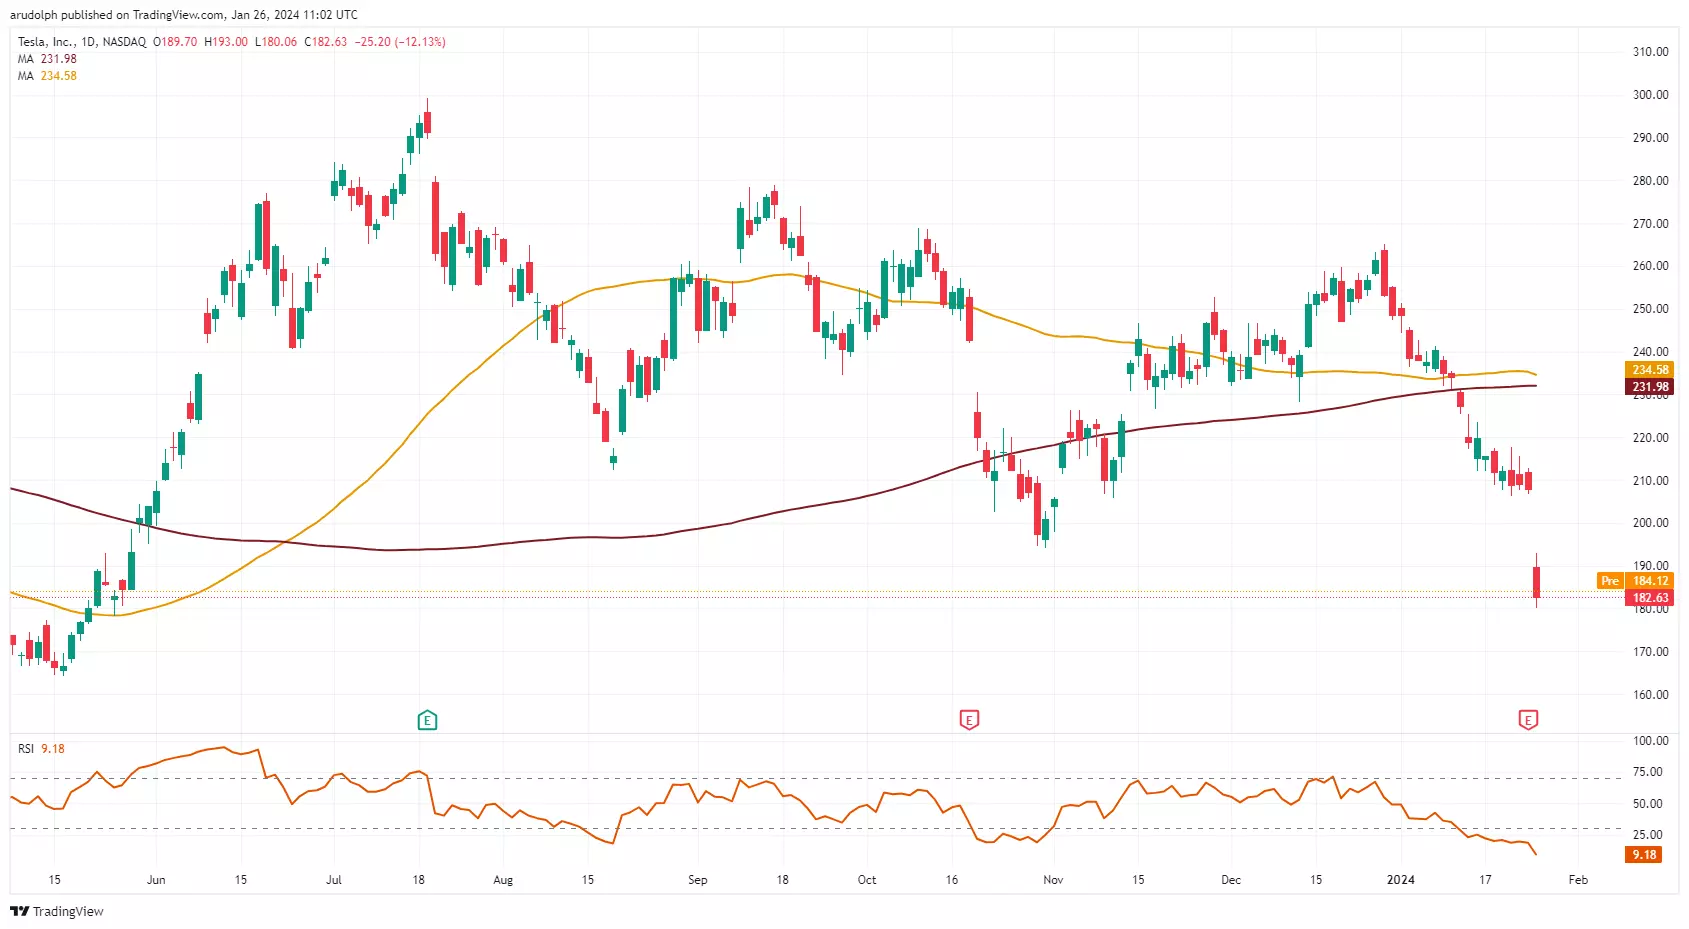 Source: TradingView
This information has been prepared by IG, a trading name of IG Markets Limited. In addition to the disclaimer below, the material on this page does not contain a record of our trading prices, or an offer of, or solicitation for, a transaction in any financial instrument. IG accepts no responsibility for any use that may be made of these comments and for any consequences that result. No representation or warranty is given as to the accuracy or completeness of this information. Consequently any person acting on it does so entirely at their own risk. Any research provided does not have regard to the specific investment objectives, financial situation and needs of any specific person who may receive it. It has not been prepared in accordance with legal requirements designed to promote the independence of investment research and as such is considered to be a marketing communication. Although we are not specifically constrained from dealing ahead of our recommendations we do not seek to take advantage of them before they are provided to our clients. See full non-independent research disclaimer and quarterly summary.
-
-
On 25/01/2024 at 05:59, Imam said:
BTC ETF approval
-
-
-
17 hours ago, Wakanda said:
Despite the approval of the Bitcoin spot ETF
'Bitcoin's ETF approval marks its maturity as an investment'
The 18% loss seen in the immediate aftermath of the approval of the ETF a few weeks ago was the market retracing back into the 200% gains seen in Bitcoin over the previous 14 months.
But, Hector McNeil, founder and CEO of HANetf, says if the pattern is repeated from the first EFT in gold two decades ago, then this is the beginning of the maturity of Bitcoin into an investment that will form part of many portfolios.
He says the ‘wild west’ that was the trading environment of cryptocurrencies will increasingly be a thing of the past. Then, on from this point, is likely to come ETF approvals for other cryptos such as Ethereum.
The Bitcoin ETF
The Bitcoin ETF, a type of investment fund, was approved a few weeks ago. On its first day, the 10 new funds together brought in around $4.7 billion. However, the price of Bitcoin has since dropped by about 18%. Hector McNeill, who helped create the first gold ETF 20 years ago and is now the CEO of HANetf, discusses how these two types of ETFs are similar. He thinks ETFs are valuable because they allow people to invest in assets that are typically difficult to trade.
Additionally, ETFs offer protections and are regulated, unlike the crypto world. McNeil hopes that the approval of the Bitcoin ETF by the SEC will encourage regulators like the UK's Financial Conduct Authority (FCA) to be more open to cryptocurrencies.
One advantage of ETFs, according to McNeil, is that investors can have a regulated product and combine all their investments in one place. Currently, the FCA only allows professional investors to access Bitcoin through a special product called spot Bitcoin. However, retail investors have other options like proxies. McNeil hopes that the FCA will eventually see the value of regulated products in providing investor protection and the ability to trade cryptocurrencies.
Gold ETF
McNeil uses the example of the first gold ETF to explain how ETFs can make an asset more accessible. Before the gold ETF, people had to physically own gold, which was inconvenient for online businesses. The gold ETF allowed people to own gold on a shared and fractional basis, backed by good delivery bars.
In the same way, McNeil believes that the Bitcoin ETF will lead to a wider adoption of Bitcoin. This will make Bitcoin less speculative and more of a long-term investment and diversifier for portfolios. Although the price of Bitcoin will still have some ups and downs due to limited supply, McNeill predicts a steadier rise over time.
KOIN ETF
McNeill also suggests that Bitcoin is chosen by many people as a store of value and a hedge against the conventional financial system, just like gold. He believes that the technology behind Bitcoin makes it function well as a currency, and that criticisms of Bitcoin, such as money laundering, also apply to traditional currencies. As more people adopt Bitcoin, McNeil thinks central banks and governments will need to find ways to digitise their currencies.
In terms of accessing Bitcoin in the UK, McNeil mentions the KOIN ETF, which provides exposure to companies heavily influenced by the price of Bitcoin. He thinks this is a good option for retail investors and expects more ETFs for other cryptocurrencies like Ethereum in the future.
Overall, McNeill sees parallels between the gold ETF and the Bitcoin ETF, and believes that the wider adoption of Bitcoin will lead to a more stable and valuable asset class.
This information has been prepared by IG, a trading name of IG Markets Limited. In addition to the disclaimer below, the material on this page does not contain a record of our trading prices, or an offer of, or solicitation for, a transaction in any financial instrument. IG accepts no responsibility for any use that may be made of these comments and for any consequences that result. No representation or warranty is given as to the accuracy or completeness of this information. Consequently any person acting on it does so entirely at their own risk. Any research provided does not have regard to the specific investment objectives, financial situation and needs of any specific person who may receive it. It has not been prepared in accordance with legal requirements designed to promote the independence of investment research and as such is considered to be a marketing communication. Although we are not specifically constrained from dealing ahead of our recommendations we do not seek to take advantage of them before they are provided to our clients. See full non-independent research disclaimer and quarterly summary.
-
10 hours ago, BillionaireFXTrader said:
Thank you so much @MongiIG and Mr. @Chris Beauchamp I watch a lot of your shows on the IG TV. You inspire me greatly, God Bless You.
You are welcome @BillionaireFXTrader
-
A fifth straight record high for the S&P 500 on Thursday came even as Tesla stock tumbled following disappointing earnings. Optimism about the economy and lower interest rates, combined with AI-driven flows, has helped to push the S&P 500 to its new peak. However, poor earnings from Intel overnight cast a shadow over the end of the session on Wall Street. Meanwhile in Asia, optimism soured with a 1.3% fall for the Nikkei 225 and a 1.5% drop for the Hang Seng. Today's calendar is dominated by the release of US PCE price inflation, the Fed's preferred measure of price growth, along with pending home sales.

-
10 minutes ago, CGE_Trading said:
Here is the latest version of the Trade Cycle Composite indicator v1.10 <---
Thanks for sharing @CGE_Trading
-
 1
1
-
-
6 hours ago, BillionaireFXTrader said:
What do you think will be the ECB interest rate decision? With a forecast of 4.5% and the previous rate at the same value of 4.5%. With today being the day the ECB will decide, what are your thoughts?
ECB Leaves Interest Rates Unchanged, EUR/USD Listless Ahead of Press Conference and US Q4 GDP
ECB IMPLIED RATES AND BASIS POINTS
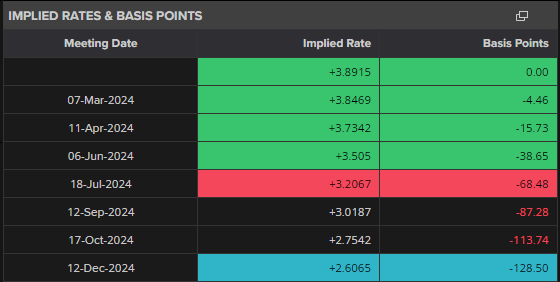
The Euro barely moved on the announcement and remained in a tight range against the US dollar. The pair has traded between 1.0870 and 1.0902 so far today and traders will hope that the upcoming ECB press conference (13:45 UK) may add some volatility to the, currently, lifeless pair. Support is seen off the 200-day simple moving average (black line on the chart) that sits just below 1.0850, while 1.0950 will be tough to break unless there is any strength in today’s US Q4 GDP figure.
-
The US dollar weakens despite positive data; focus shifts to Q4 GDP Report. Explore the technical outlook for EUR/USD, USD/JPY, and GBP/USD.
 Source: Bloomberg
The US dollar retreated on Wednesday despite better-than-anticipated PMI results, but the tide could turn in its favor over the coming days, especially if key US economic data continues to surprise to the upside. With that in mind, it is important to keep an eye on the fourth-quarter gross domestic product numbers set to be released on Thursday.
In terms of estimates, economic activity is forecast to have expanded by 2% at an annualized rate during the fourth quarter, following a 4.9% increase in Q3. Although GDP is backward-looking, it can still offer valuable information on the health of the economy. For this reason, traders should follow the report closely, paying particular attention to household expenditures, the main engine of growth.
Economic calendar
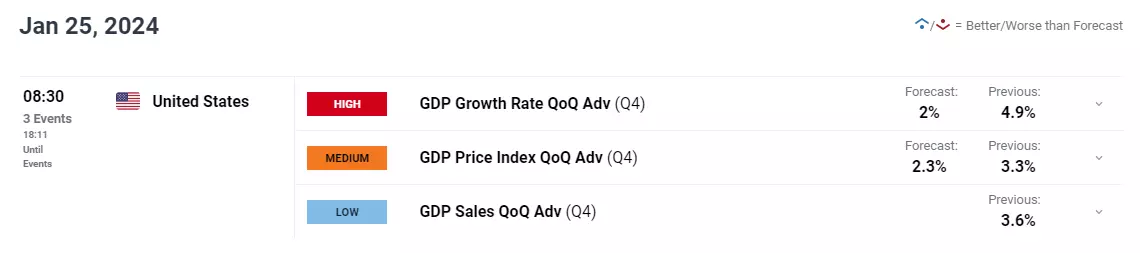 Source: DailyFX
With consumer spending holding up better than expected thanks in part to a strong labor market and rising confidence levels, it would not be surprising to see another buoyant GDP report. This scenario could further reduce the odds of a Fed rate cut in March and push traders to scale back overly dovish expectations for the FOMC’s policy path, creating a more constructive backdrop for the US dollar.
EUR/USD technical analysis
After a subdued performance earlier in the week, EUR/USD rebounded on Wednesday, bouncing off the 200-day simple moving average and approaching the 1.0900 handle. If gains accelerate in the coming days, technical resistance appears at 1.0920/1.0935, and 1.0975 thereafter. On further strength, the crosshairs will be 1.1020.
On the other hand, if sentiment shifts back in favor of sellers and the pair takes a turn to the downside, the 200-day SMA near 1.0840 will be the first line of defense against a bearish assault. Prices may find stability in this area on a pullback before mounting a comeback, but in the event of a breakdown, we could see a move towards 1.0770, followed by 1.0710 (trendline support).
EUR/USD daily chart
 Source: TradingView
GBP/USD technical analysis
GBP/USD also climbed on Wednesday, but failed to clear resistance at 1.2770. Traders should keep a close eye on this technical ceiling in the trading sessions ahead to see if it contains the bulls. If it does and prices are ultimately rejected to the downside, we could be looking at a possible pullback towards 1.2680. Further losses from this point onward may shift focus towards 1.2600.
On the contrary, if the cable prolongs its advance and decisively surpasses 1.2770, we will have before us a bullish signal derived from the confirmation of the symmetrical triangle in development since the middle of last month. In this scenario, GBP/USD could first rally towards 1.2830 before starting the next leg of the upward trend towards 1.3000.
GBP/USD daily chart
 Source: TradingView
USD/JPY technical analysis
USD/JPY sold off on Wednesday, but managed to finish the day off its worst levels and above the 100-day simple moving average located at near 147.40. There's a potential for prices to find stability in this zone in the coming days before continuing their upward trend. Yet, if a breakdown occurs, the possibility of retracement towards the 146.00 handle cannot be dismissed.
On the flip side, if the bulls regain control and propel USD/JPY higher, technical resistance can be spotted at 149.00. On further strength, all eyes will be on the psychological 150.00 mark. Although a retest of the area is within the realm of possibility, the pair may not be able to sustain these levels for an extended period of time, given the risk of Tokyo intervening in FX markets to support the yen.
USD/JPY daily chart
 Source: TradingView
This information has been prepared by IG, a trading name of IG Australia Pty Ltd. In addition to the disclaimer below, the material on this page does not contain a record of our trading prices, or an offer of, or solicitation for, a transaction in any financial instrument. IG accepts no responsibility for any use that may be made of these comments and for any consequences that result. No representation or warranty is given as to the accuracy or completeness of this information. Consequently any person acting on it does so entirely at their own risk. Any research provided does not have regard to the specific investment objectives, financial situation and needs of any specific person who may receive it. It has not been prepared in accordance with legal requirements designed to promote the independence of investment research and as such is considered to be a marketing communication. Although we are not specifically constrained from dealing ahead of our recommendations we do not seek to take advantage of them before they are provided to our clients.
-
Yen picks up late bid as markets digest Ueda’s comments; rising Japanese Government bonds spur on the yen one day after BoJ meeting and USD/JPY turns away from the 150 mark as 146.50 emerges as immediate support.
 Source: Bloomberg
Yen picks up a late bid as markets digest Ueda’s comments
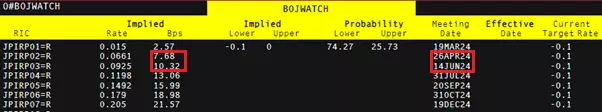
The main takeaway from yesterday’s Bank of Japan (BoJ) meeting was that Ueda still has his eye on an eventual exit from negative rates, despite inflation showing signs of slowing down. Ueda described the likelihood of reaching the 2% target as “increasing” and even said an exit from negative rates is possible in the absence of addressing the current, sub-optimal output gap (difference between potential output and current output).
Markets see April as a live meeting for the BoJ, but currently price in a full 10 basis points (bps) by the June meeting. The BoJ is primarily looking for the continuation of what it refers to as the virtuous cycle between inflation and wages. The wage negotiation process is likely to roundup in March, which has led markets to naturally look to the April meeting for any movement in the interest rate.
Implied basis points priced in by rate markets
 Source: Refinitiv
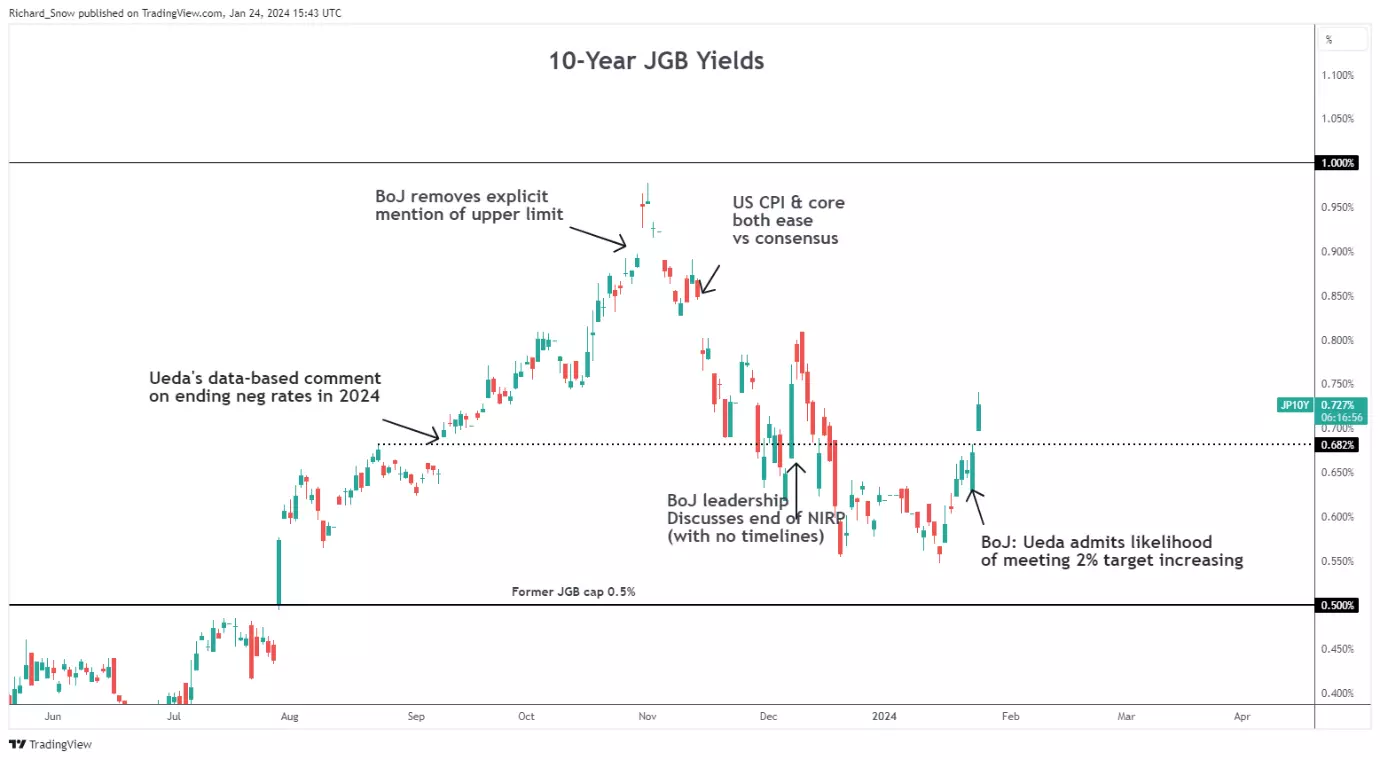
Rising Japanese bond yields spur on the yen
Japanese Government bond yields (10-year) continued to rise today, in the aftermath of the BoJ meeting. Yields are still a long way off the early November peak before inflation pressures revealed signs of slowing, and markets cooled expectations around any imminent rate changes. The higher yield boosts the attractiveness of the yen and typically sees a rise in the local currency.
Japanese government bond yields (10-year)
 Source: TradingView
The Yen has broadly risen against a number of major FX currencies (GBP, AUD, EUR, USD) as can be seen below in an equal-weighted index, comprising of the above-mentioned currencies:
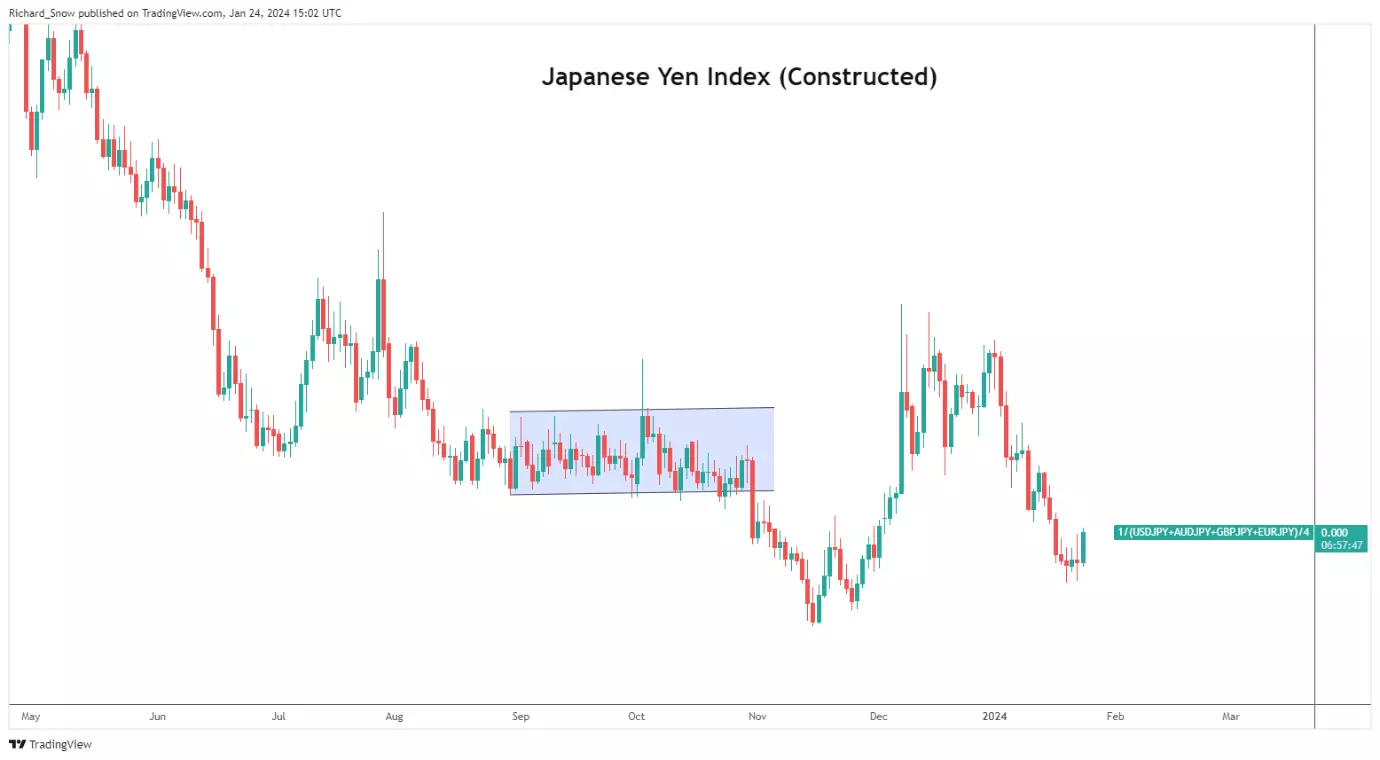 Source: TradingView
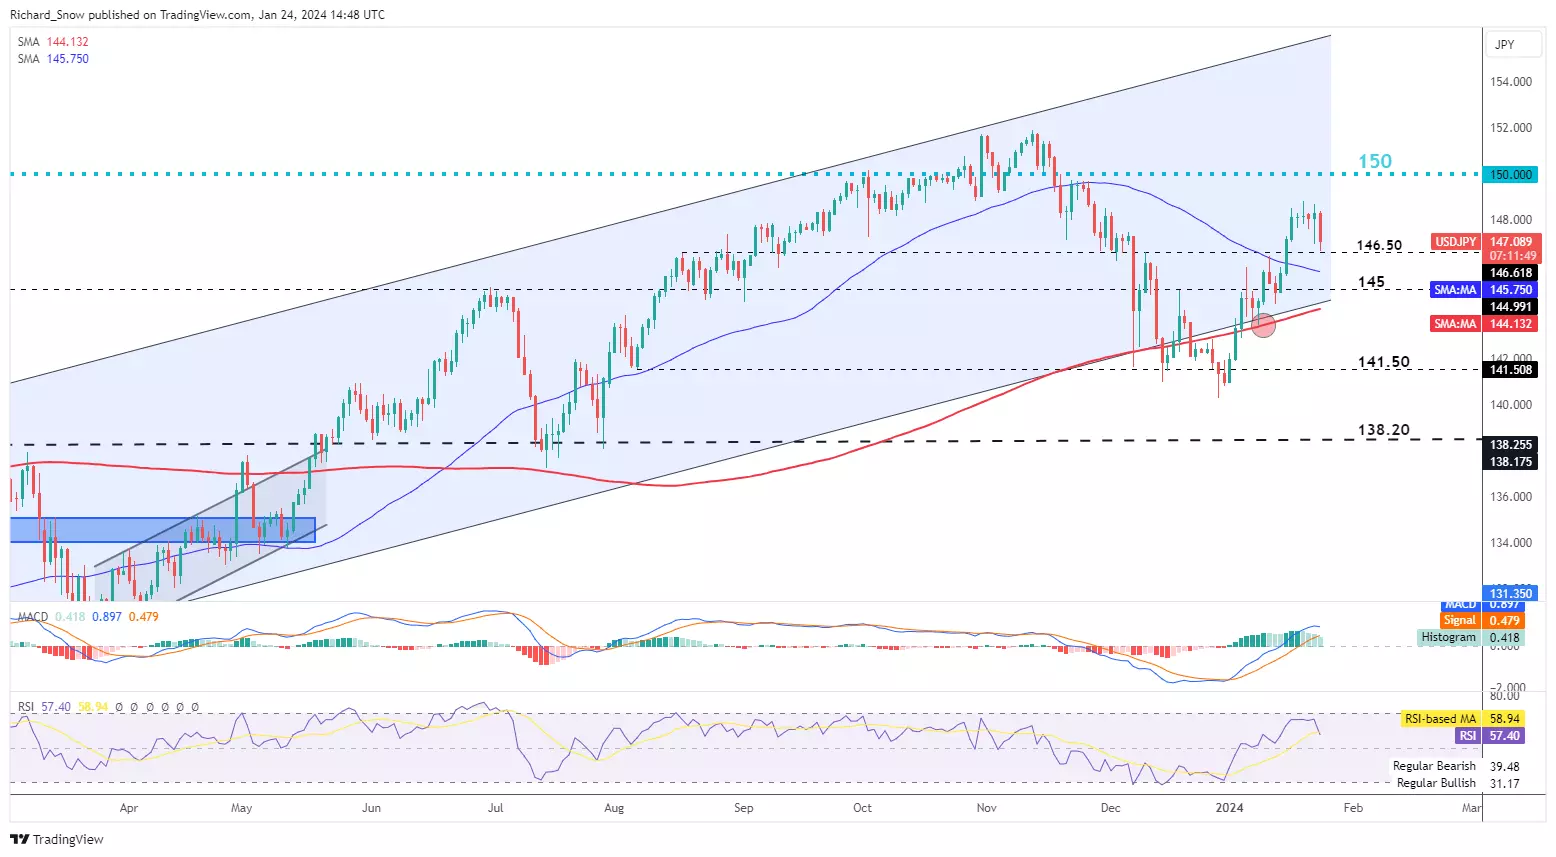
USD/JPY turns away from the 150 mark as 146.50 emerges as immediate support
USD/JPY found resistance ahead of the 150 marker but failed to reach the psychological level after the BoJ head pointed towards an eventual exit from negative rates with increasing probability.
The short to medium term uptrend has not broken down as of yet, with 146.50 the most immediate level of support, followed by 145.00 and the underside of the longer-term rising channel (highlighted in blue). However, the US dollar may pose a challenge to the yen tomorrow and Friday with US Q4 GDP and PCE data on tap.
Strong PMI data earlier today points to an economy that is growing at a decent pace and this could keep USD supported if inflation concerns build in the upcoming data prints with the resilient December CPI print still fresh in the minds of traders.
USD/JPY daily chart
 Source: TradingView
After the BoJ meeting, Japan specific data is rather scarce but US Q4 GD and PCE data on Thursday and Friday ought to provide a lift for intra-day volatility before the weekend.
Better-than-expected PMI data for the month of January suggests the US economy is moving along at a decent canter, but markets will be more focused on backward looking data in tomorrow’s Q4 growth print.
USD/JPY will also maintain plenty of interest next week when the FOMC meet to discuss monetary policy. Before then, US PCE data for December is expected to reveal stubborn headline pressures remain, with another welcome drop in the core measure of inflation.
Economic calander
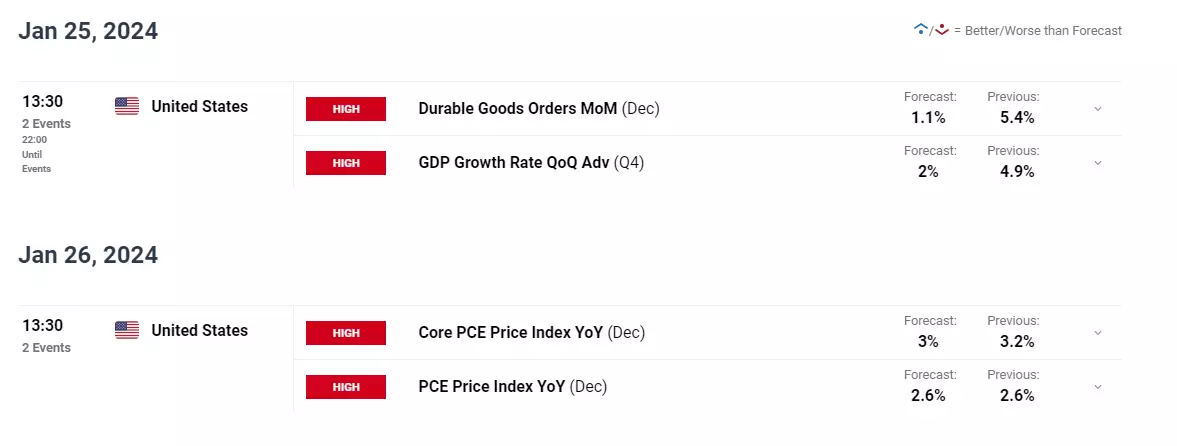 Source: DailyFX
This information has been prepared by IG, a trading name of IG Australia Pty Ltd. In addition to the disclaimer below, the material on this page does not contain a record of our trading prices, or an offer of, or solicitation for, a transaction in any financial instrument. IG accepts no responsibility for any use that may be made of these comments and for any consequences that result. No representation or warranty is given as to the accuracy or completeness of this information. Consequently any person acting on it does so entirely at their own risk. Any research provided does not have regard to the specific investment objectives, financial situation and needs of any specific person who may receive it. It has not been prepared in accordance with legal requirements designed to promote the independence of investment research and as such is considered to be a marketing communication. Although we are not specifically constrained from dealing ahead of our recommendations we do not seek to take advantage of them before they are provided to our clients.
-
Amid flat revenues and a challenging Chinese market, the tech giant's AI integration and upcoming VR headset launch are key focal points as Apple prepares to report its Q1 2024 earnings.
 Source: Bloomberg
When will Apple report its latest earnings?
Apple is scheduled to report its Q1 earnings on Thursday, February 1, 2024.
The backdrop
Apple's Q4 2023 earnings, reported in early November, surpassed analysts' expectations for sales and earnings per share, but the company reported a 1% year-over-year decline in quarterly revenues.
Tim Cook, Apple's CEO, stated, "We now have our strongest lineup of products ever heading into the holiday season, including the iPhone 15 lineup and our first carbon-neutral Apple Watch models, a significant milestone in our efforts to make all Apple products carbon-neutral by 2030."
Key financials
Wall Street's expectations for the upcoming results are as follows:
- EPS: $2.11 vs $1.46 per share in the previous quarter
- Revenue: $117.95 billion vs $89.5 billion
Q4 2023 highlights
- An all-time revenue record in services of $22.31 billion compared to the expected $21.35 billion. The services segment includes subscriptions such as iCloud storage, the App Store, and Apple Music.
- A September quarter revenue record for the iPhone of $43.81 billion. Moreover, the iPhone was the only hardware line for Apple to exhibit growth in the quarter, while the Mac and iPad businesses contracted during the quarter. The period only included about one week of iPhone 15 sales.
- The wearables section, which includes AirPods and Apple Watches, experienced a year-over-year decrease of over 3%.
Net sales by category
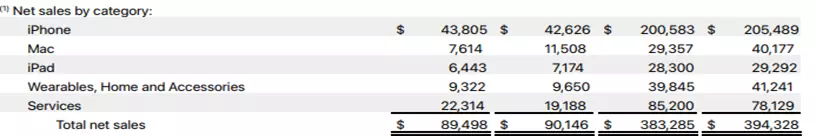 Source: Apple.com
China's chill: Apple vs. Huawei
Of concern to shareholders, Apple's sales in Greater China, its third largest market, were flat on the year. Chinese government officials are banned from using Apple's devices in favour of homegrown products like Huawei. Outside of the public sector, the Chinese consumer remains cautious, as the Chinese economy remains tepid.
Net sale by segment
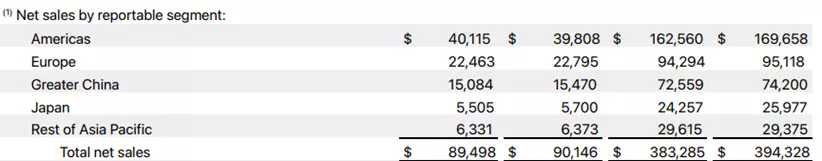 Source: Apple.com
What to look for in Q2?
In its Q4 Earnings call, CFO Luca Maestri guided that Apple expected December quarter revenue to be similar to last year's.
After a recent broker upgrade, which helped spark a sharp move higher in the Apple share price, there will be interest in commentary around the following topics:
- The potential for long-term gains as the company integrates AI into iPhones
- Prospects for the Vision Pro virtual reality headset, scheduled to launch on February 2 – a launch which seems to lack "buzz"
- Whether Apple continues to gain market share in a contracting Chinese market
- An update on iPhone 15 sales
- The impact of the removal of the Oxygen feature from Apple Watches after its legal setback
- Insights into the iPhone 16 due for release in September of this year.
Apple's sale revenue 2015 to the present
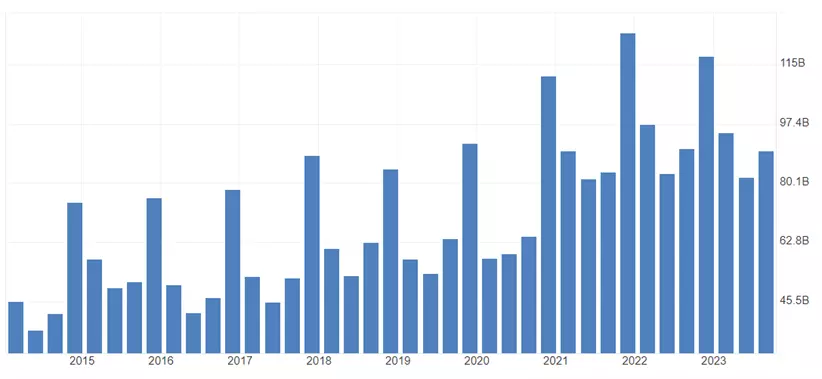 Source: TradingEconomics
Apple technical analysis
Following an almost 48% gain in 2023, Apple's share price has shrugged off some New Year nerves to trade higher in January, just 2.5% below its $199.62 all-time high.
Providing Apple's share price remains above a support band near $180.00/75, including the 200-day moving average at $181.45, recent lows in the $180 area, and uptrend support, we expect Apple's shares to break above resistance at $199 in the coming months, aiming for $220.00.
It's essential to note that if Apple's share price experiences a sustained break below $180/75, it would signal a deeper pullback, initially toward the $165.57 low from last October.
Apple daily chart
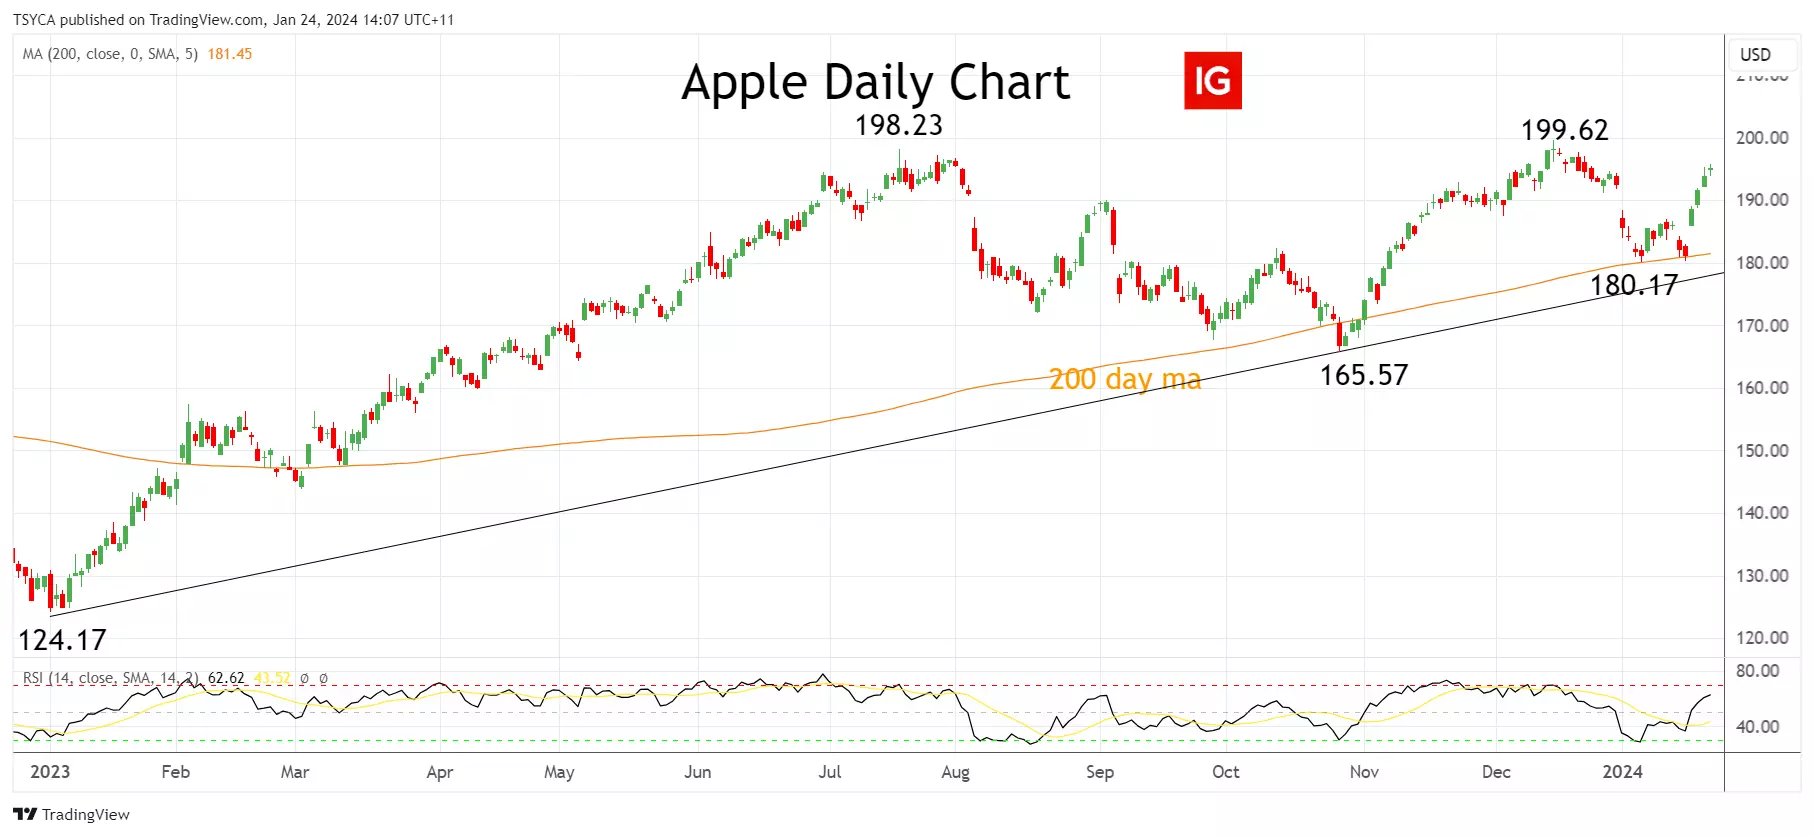 Source: TradingView
- Source: TradingView. The figures stated are as of 24 January 2024. Past performance is not a reliable indicator of future performance. This report does not contain and is not to be taken as containing any financial product advice or financial product recommendation.
This information has been prepared by IG, a trading name of IG Markets Limited. In addition to the disclaimer below, the material on this page does not contain a record of our trading prices, or an offer of, or solicitation for, a transaction in any financial instrument. IG accepts no responsibility for any use that may be made of these comments and for any consequences that result. No representation or warranty is given as to the accuracy or completeness of this information. Consequently any person acting on it does so entirely at their own risk. Any research provided does not have regard to the specific investment objectives, financial situation and needs of any specific person who may receive it. It has not been prepared in accordance with legal requirements designed to promote the independence of investment research and as such is considered to be a marketing communication. Although we are not specifically constrained from dealing ahead of our recommendations we do not seek to take advantage of them before they are provided to our clients. See full non-independent research disclaimer and quarterly summary.
-
1 hour ago, BillionaireFXTrader said:
With today being the day the ECB will decide, what are your thoughts?
ECB preview: caution to prevail as bank expected to leave rates unchanged
While the ECB will be pleased to see a slowdown in the pace of inflation, it will want to avoid hinting at a dramatic change of policy in the near-term.
European Central BankSource: Bloomberg
Written by: Chris Beauchamp | Chief Market Analyst, London | Publication date: Monday 22 January 2024 16:05
No changes in ECB policy expected
The upcoming European Central Bank (ECB) meeting is not anticipated to bring any significant changes in policy signals, as there has been limited new information since December. However, President Lagarde is likely to reiterate that the next policy rate change will be a cut, which could potentially occur in the summer.The June meeting holds potential importance, similar to comments made by ECB Chief Economist Philip Lane. Lagarde is expected to emphasize the significance of the new staff projections in March, which will play a crucial role in determining policy rates.
Markets pricing in April rate cut
According to market expectations, the first ECB policy rate cut is projected to take place in April, with a total reduction of 135 basis points (bp) by the end of 2024. The policy rates are expected to reach a trough of 2% within the next two years.Despite recent inflation prints showing a slight downside surprise compared to staff projections, the ECB has not declared victory over inflation. The disinflation process continues, supported by easing underlying inflation indicators.
Economic growth concluded 2023 on a weak note, with manufacturing experiencing contractionary territory and services showing modest growth. Although growth momentum remains weak, the ECB anticipates a gradual rebound in activity throughout 2024. This rebound will be supported by rising real wages, a strong labour market, and a turnaround in the global manufacturing cycle.
Cautious ECB meeting expected
Central bankers are determined to avoid giving the market too much of an impression that rate cuts are imminent. Having seen such a huge rally in risk assets from the end of October, they will be uncomfortably aware that at least some rate cuts have essentially been priced in already.This week’s meeting, therefore, is likely to see a cautious Christine Lagarde appear before the world’s financial markets. Inflation is coming down from its highs, but like her peers at the Federal Reserve (Fed) and elsewhere, the head of the ECB will be unwilling to move too soon on inflation lest consumer price index (CPI) begin to rise once more.
EUR/USD technical analysis
EUR/USD continues to oscillate around the 55-day simple moving average at $1.0900 but remains below its December-to-January downtrend line at $1.0909.While it caps, further sideways trading between Monday’s $1.0909 intraday high and the 200-day simple moving average (SMA) and last week’s low at $1.0845 remains at hand. Failure there may kick off a more significant decline towards the late-August low and mid-September high at $1.04769 to $1.0766.
A rise and daily chart close above $1.0909 would eye the 12 and 15 January lows at $1.0933 to $1.0936.
EUR/USD chart

EUR/USD chart Source: TradingView
This information has been prepared by IG, a trading name of IG Markets Limited. In addition to the disclaimer below, the material on this page does not contain a record of our trading prices, or an offer of, or solicitation for, a transaction in any financial instrument. IG accepts no responsibility for any use that may be made of these comments and for any consequences that result. No representation or warranty is given as to the accuracy or completeness of this information. Consequently any person acting on it does so entirely at their own risk. Any research provided does not have regard to the specific investment objectives, financial situation and needs of any specific person who may receive it. It has not been prepared in accordance with legal requirements designed to promote the independence of investment research and as such is considered to be a marketing communication. Although we are not specifically constrained from dealing ahead of our recommendations we do not seek to take advantage of them before they are provided to our clients. See full non-independent research disclaimer and quarterly summary.-
1
-
-
Chinese stocks were given fresh support overnight thanks to a cut in bank reserve requirements, as well as promises of more support in the future. Tesla earnings missed on revenue and earnings per share, despite beating forecasts on vehicle deliveries, causing a check to sentiment after Netflix's numbers earlier in the week. Attention now turns to today's ECB meeting, though no change in policy is expected, and the first reading on US Q4 GDP. Boeing shares will be in focus once more after the US Federal Aviation Administration blocked the group from expanding production of its 737 Max aircraft after recent incidents.

-
1
-
-
Oil, gold and silver prices rise amid heightened Middle East tensions
Outlook on TI, gold and silver ahead of key US data later this week.
 Source: Bloomberg
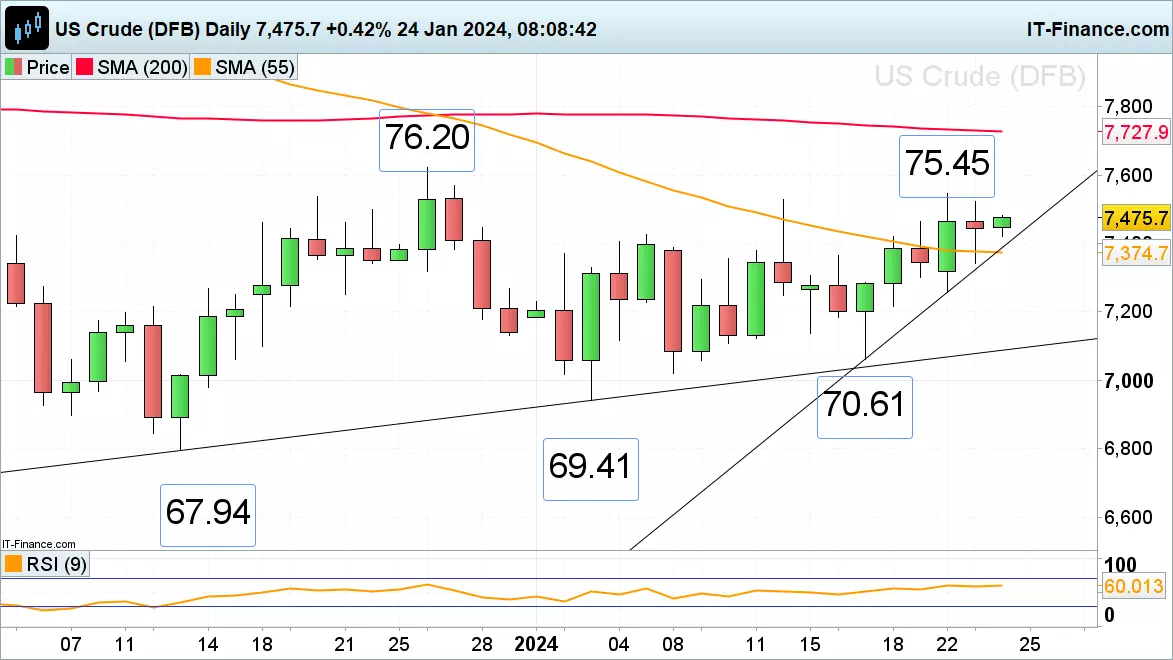
WTI rises on heightened Red Sea tensions
Front month WTI futures continue to grind higher as investors weigh up escalating geopolitical tensions around the Red Sea with demand-side uncertainties and recovering global supply. The rise from last Wednesday’s 70.61 low has so far taken the front month futures contract to Monday’s 75.45 three-week high, a rise above which would engage the 76.20 late December peak and the 200-day simple moving average (SMA) at 77.28. The rise in the oil price is underpinned by a one-week uptrend line at 73.86 and the 55-day SMA at 73.75. While Monday’s low at 72.57 isn’t giving way, further upside should be seen.
 Source: ProRealTime
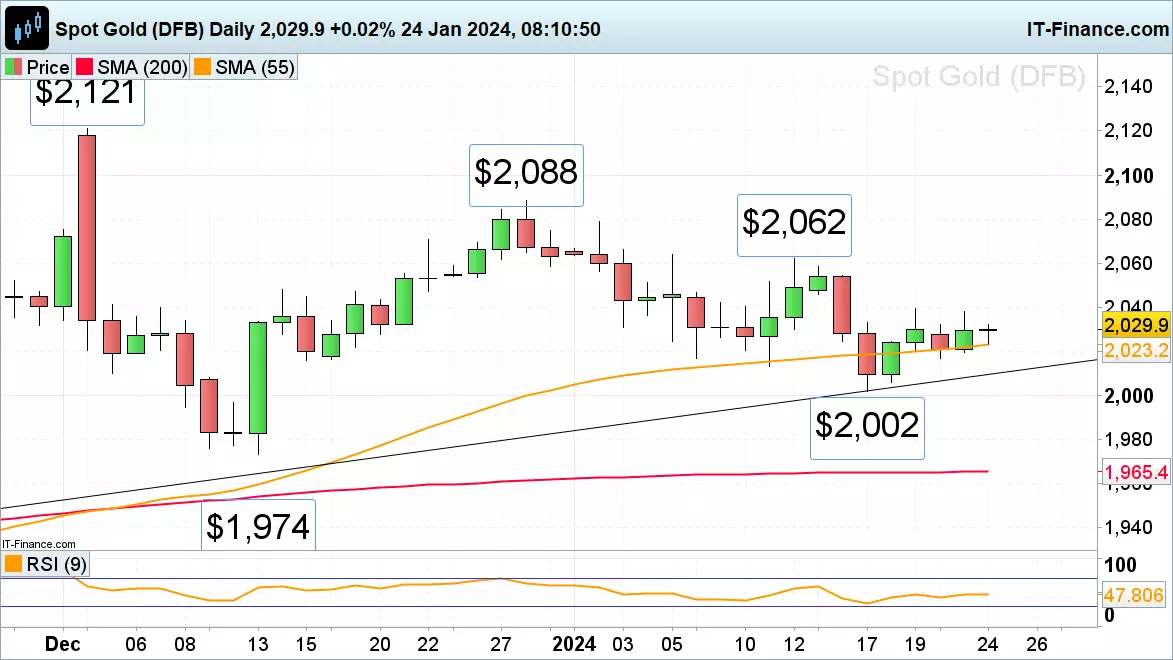
Gold price side-lined
Spot gold’s slide from last week’s $2,062 per troy ounce high amid a strengthening US dollar has taken it back to the 55-day simple moving average (SMA) at $2,023 along which it has been trading for the past week while remaining above last week’s low at $2,002. Further range trading between this low and Friday’s high at $2,039 is at hand. More resistance is to be found at last Monday’s $2,046 low.
 Source: ProRealTime
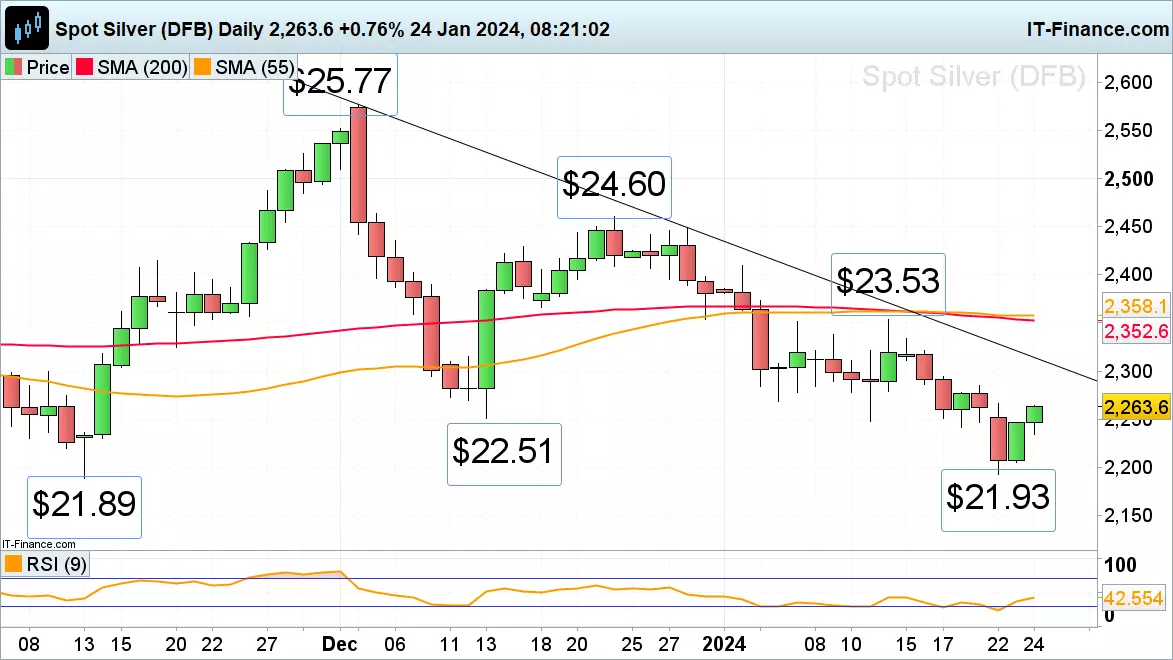
Silver price bounces off January trough
Spot silver’s descent from its mid-January $23.53 per troy ounce high rapidly took it to Monday’s $21.93 low which was made marginally above its $21.89 mid-November low. The rise above Tuesday’s daily candlestick Harami high at $22.46 points to a probable bullish trend reversal with the 4 January low at $22.69 representing the first hurdle. Once bettered, the December-to-January downtrend line at $23.14 should be back in sight. Support below Wednesday’s $22.35 low lies in the $21.93 to $21.89 region.
 Source: ProRealTime
-
FTSE 100 in recovery mode while DAX 40 and S&P 500 surge ahead
Outlook on FTSE 100, DAX 40 and S&P 500 ahead of key US data out later in the week.
 Source: Bloomberg
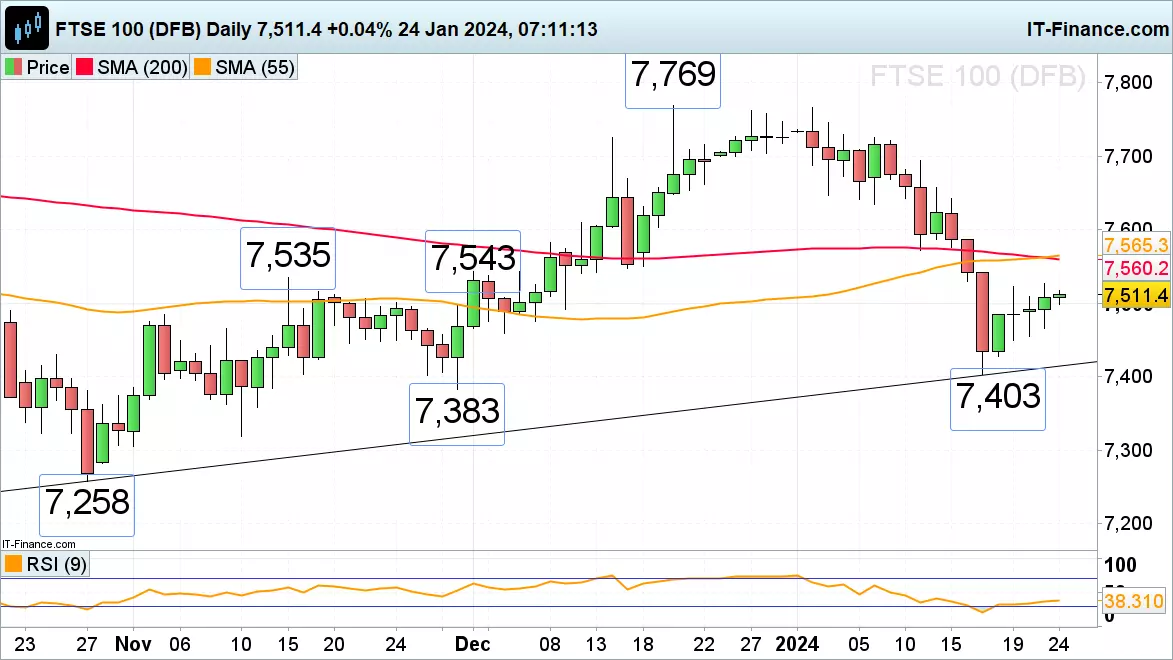
FTSE 100 in recovery mode
The FTSE 100’s gradual advance from last week’s six-week low at 7,403 on pared back rate cut expectations has been helped by mining stocks rallying as optimism over demand from China pushed iron ore prices higher. A rise above Tuesday’s 7,527 high has the mid-November and early December highs at 7,535 to 7,543 and also the 55- and 200-day simple moving averages (SMA) at 7,560 to 7,565 in its sights. Minor support below Wednesday’s 7,498 intraday low sits at Tuesday’s 7,466 low ahead of the 5 December 7,459 low and last week’s 7,403 trough.
 Source: ProRealTime
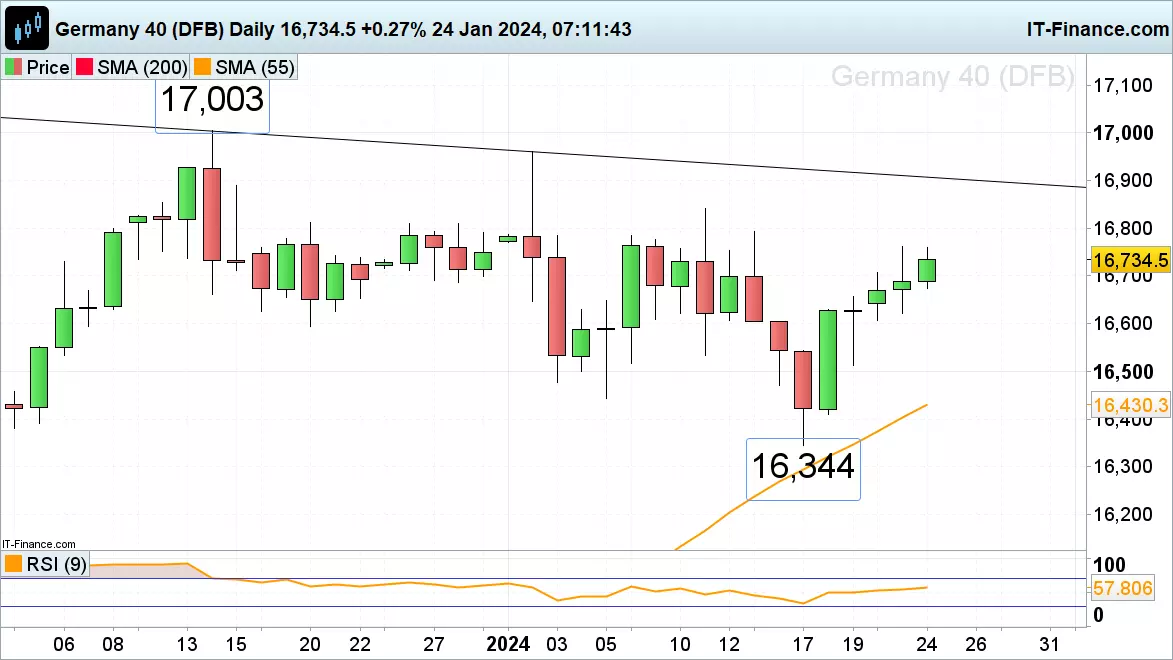
DAX 40 resumes its ascent after Tuesday’s pause
The DAX 40 index continues its advance, having briefly paused it on Tuesday, and approaches the 8 January high at 16,785 with the more significant 11 and 15 January highs at 16,792 to 16,841 representing further upside targets ahead of Thursday’s European Central Bank (ECB) meeting. Minor support below Wednesday’s 16,674 intraday low can be seen at Friday’s 16,657 high and then at Thursday’s high and Tuesday’s low at 16,630 to 16,623.
 Source: ProRealTime
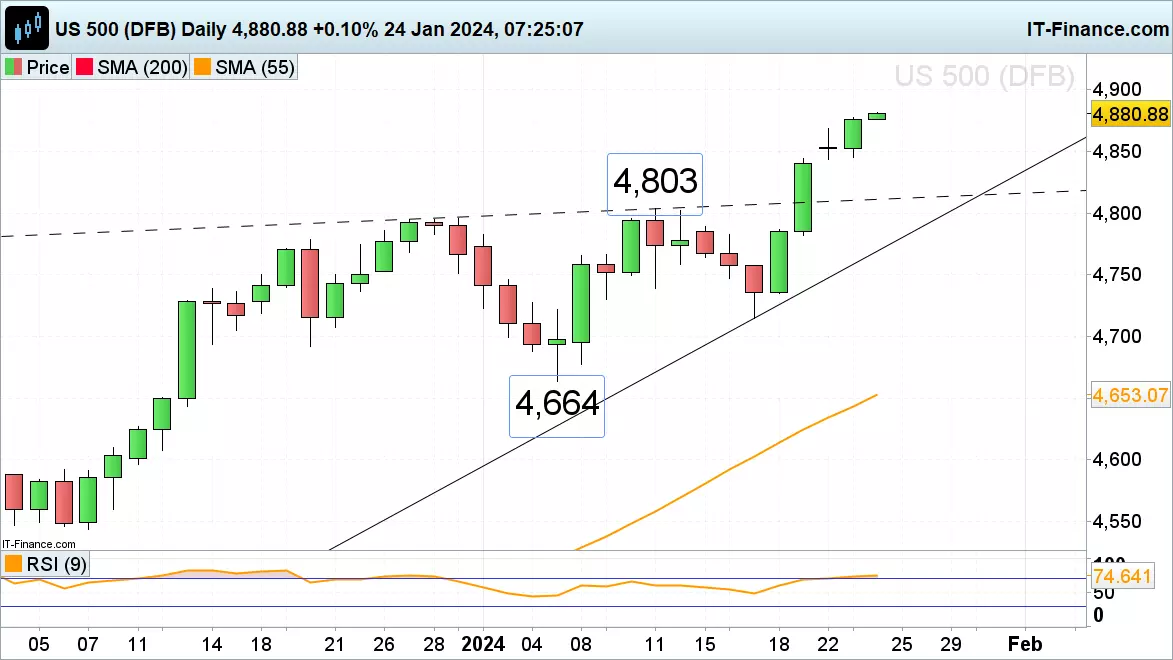
S&P 500 once more trades in new record highs
The S&P 500 continues its advance into new record high territory following Netflix earnings, the first of the ‘magnificent seven’ to report, which showed a new record subscriber count in the fourth quarter, better-than-expected revenue and a strong earnings guidance for the current quarter. The psychological 5,000 mark remains in focus and may be reached over the coming weeks and months but first the minor psychological 4,900 level needs to be exceeded. Minor support sits at Monday’s 4,868 high and more significant support between Friday’s high and Tuesday’s low at 4,845 to 4,844.
 Source: ProRealTime
-
EUR/USD above 200-day SMA, key levels at 1.0840 and 1.0770. USD/JPY eyes 149.00 breakout, potential retracement at 147.40. USD/CAD rebounds, eyes 1.3500 resistance, and 1.3415 support.
Source: Bloomberg
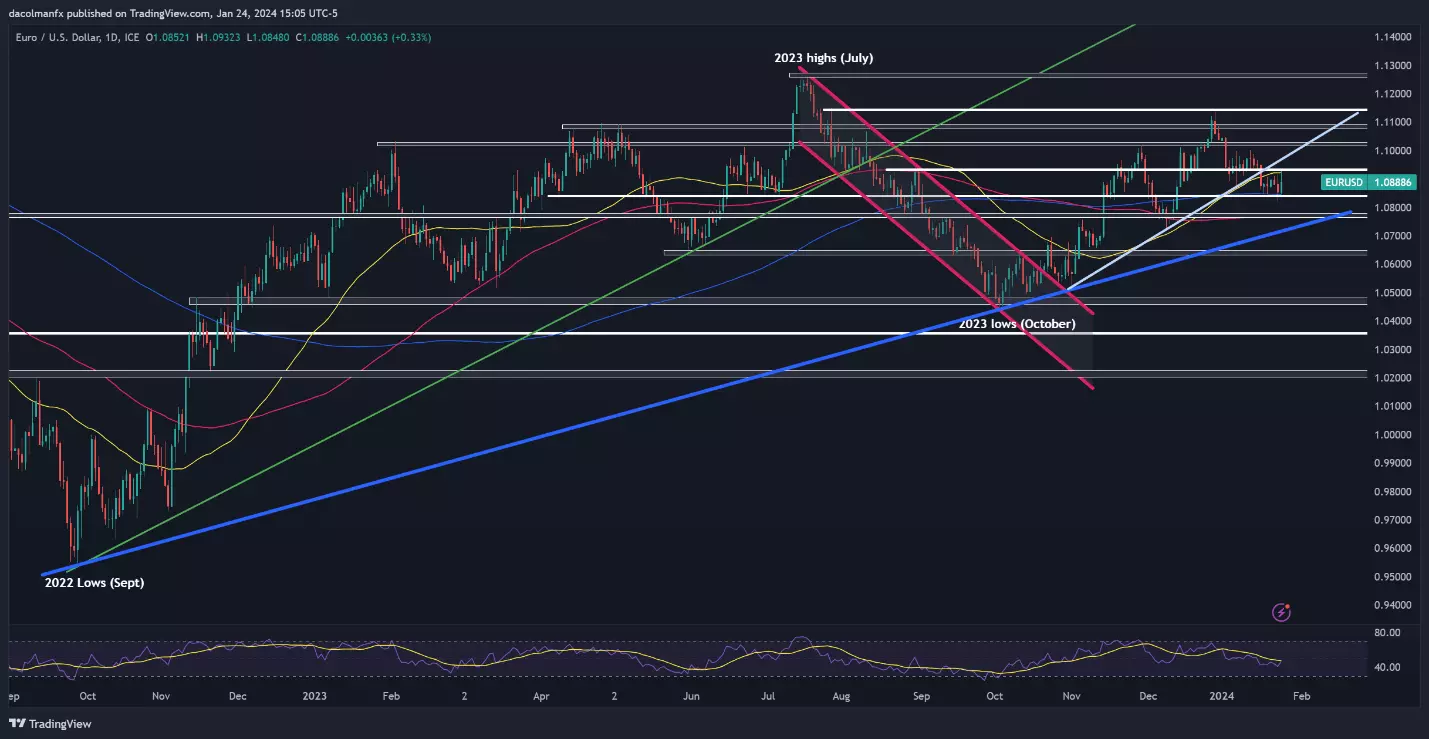
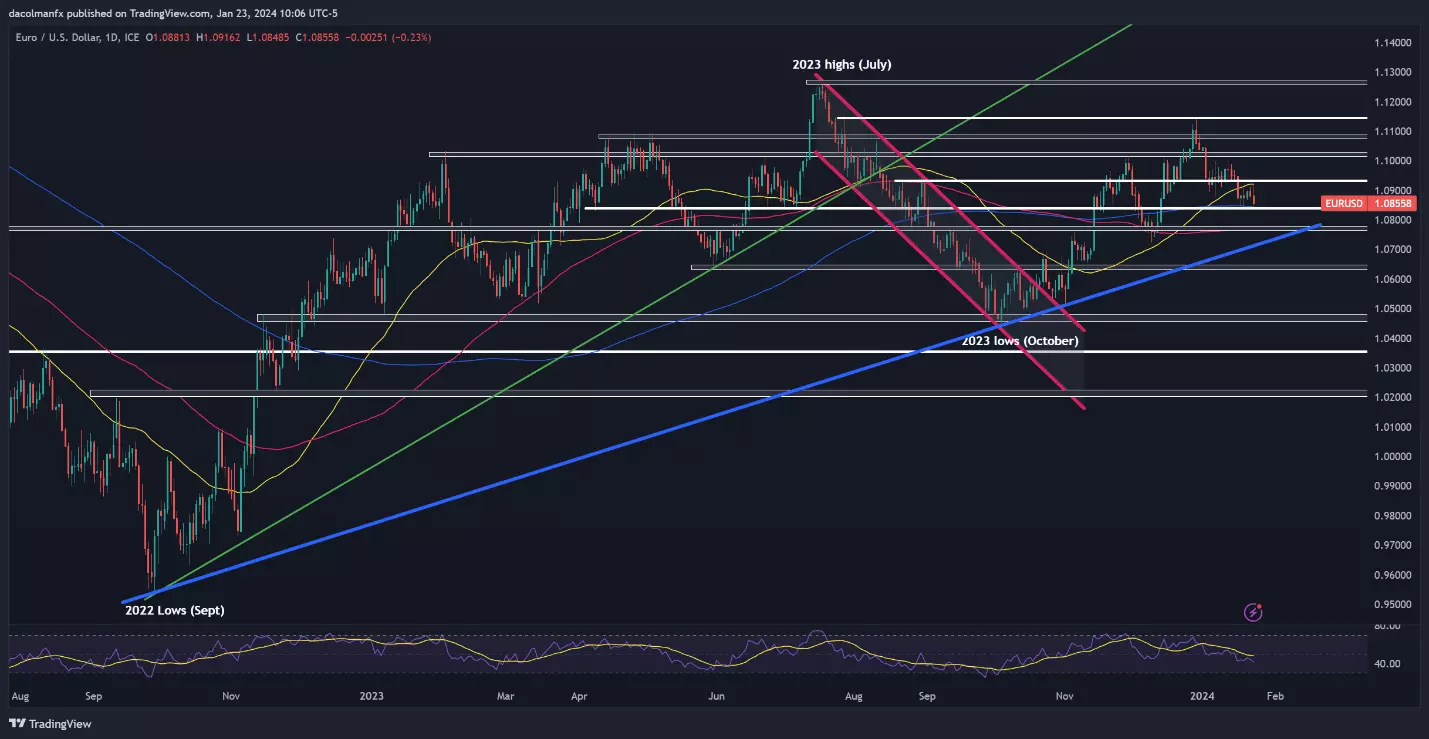
EUR/USD technical analysis
EUR/USD has been moving lower this week, but has so far managed to hold above its 200-day simple moving average near 1.0840. For sentiment around the euro to improve, the bulls have to protect this floor at all costs; failure to do so could result in a pullback towards 1.0770. On further weakness, all eyes will be on trendline support at 1.0710.
In the event of a bullish reversal ahead of the European Central Bank decision, technical resistance extends from 1.0920 to 1.0935. If history is any guide, buyers will face difficulties in clearing this barrier; however, a successful breakout has the potential to usher in rally towards 1.1020. On continued upward momentum, attention will turn to 1.1080.
EUR/USD daily chart
 Source: TradingView
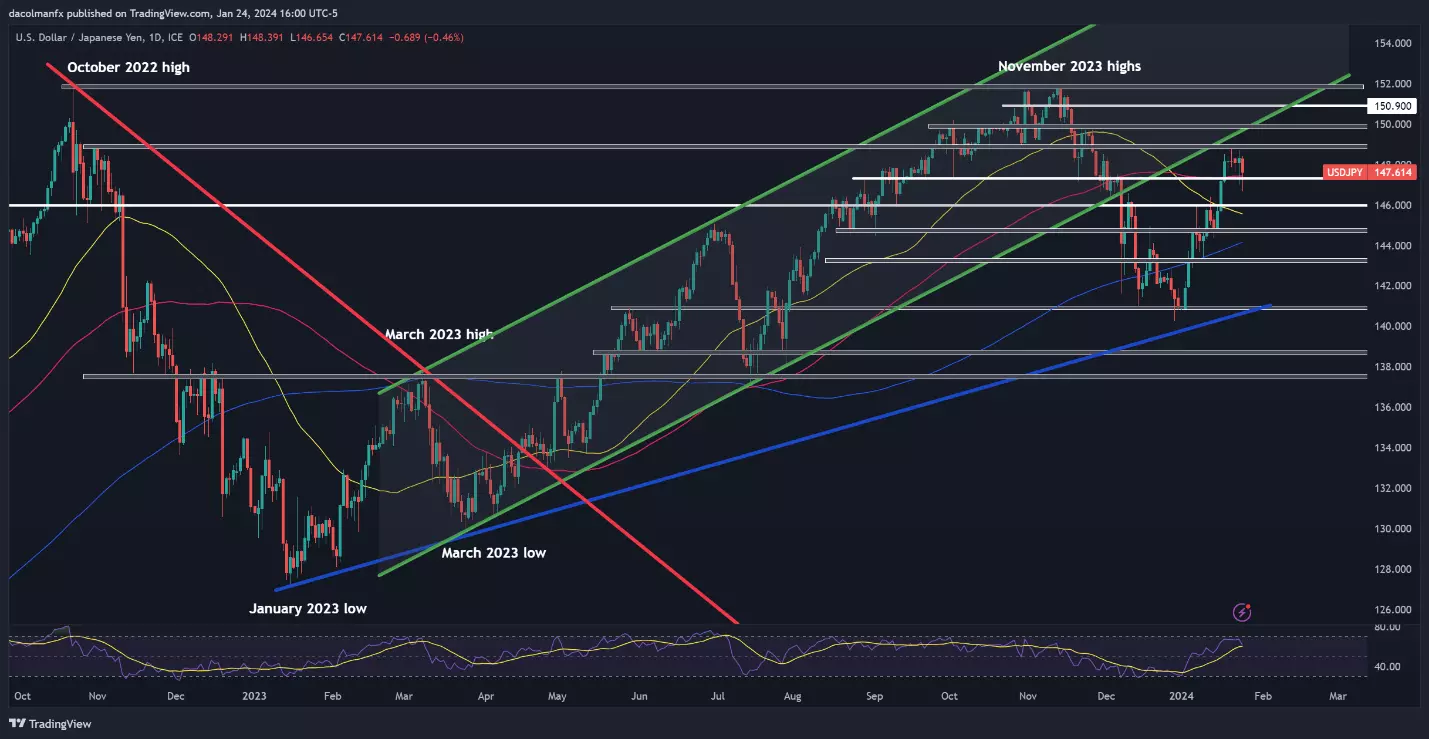
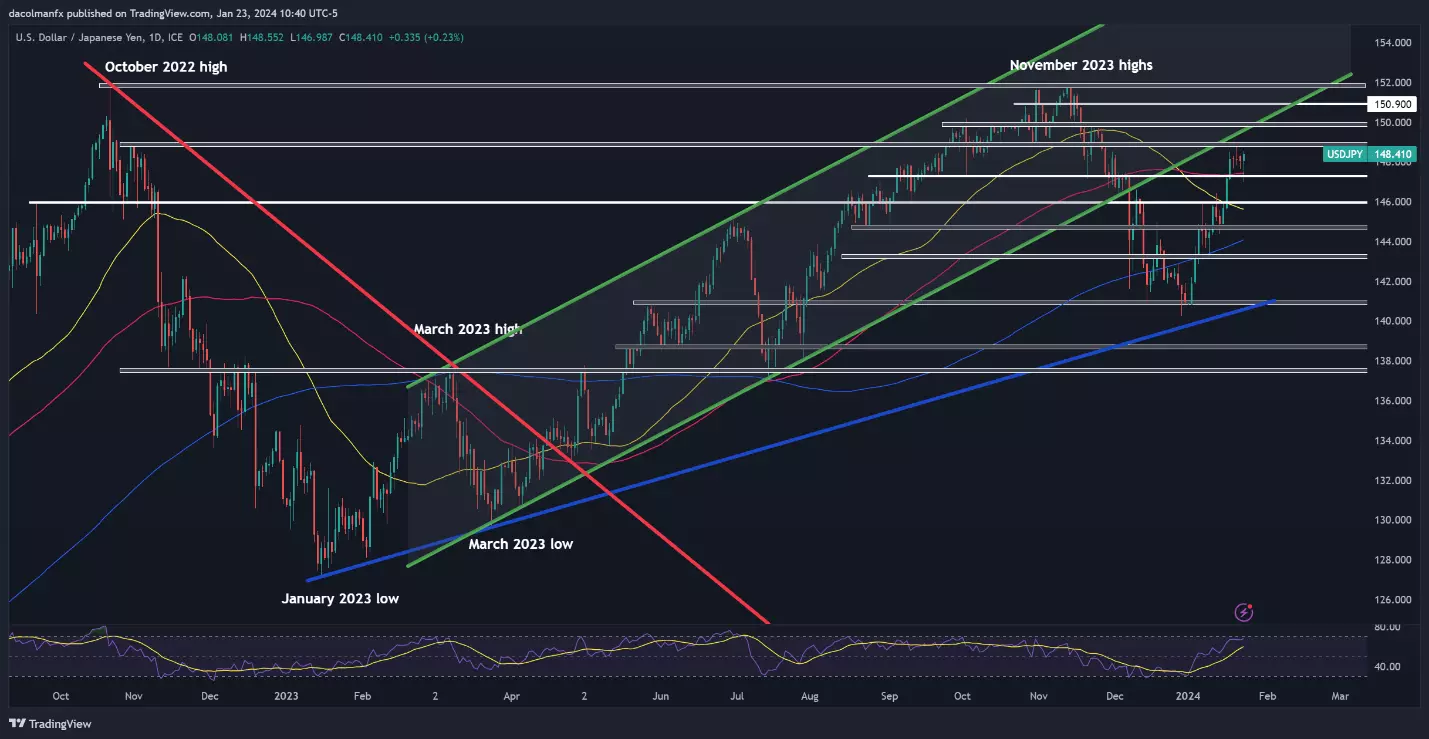
USD/JPY technical analysis
While the Bank of Japan’s monetary policy announcement sparked some yen’s volatility, it was ultimately a nothingburger, with the institution maintaining its ultra-loose policy settings - a decision that could pave the way for further weakness in the Japanese currency.
Looking at USD/JPY, prices seem to be ready to start the next leg higher after a short period of market consolidation, as shown on the daily chart below, where the pair can be seen approaching a key ceiling near 149.00. If buyers manage to push the exchange rate above this ceiling, a retest of the 150.00 level could be just around the corner.
On the flip side, if USD/JPY reverses off technical resistance, initial support is located near 147.40, near the 100-day simple moving average. Prices are likely to stabilize in this area before resuming their bullish path; however, a decisive breakdown could pave the way for a retracement toward the 146.00 handle.
USD/JPY daily chart
 Source: TradingView
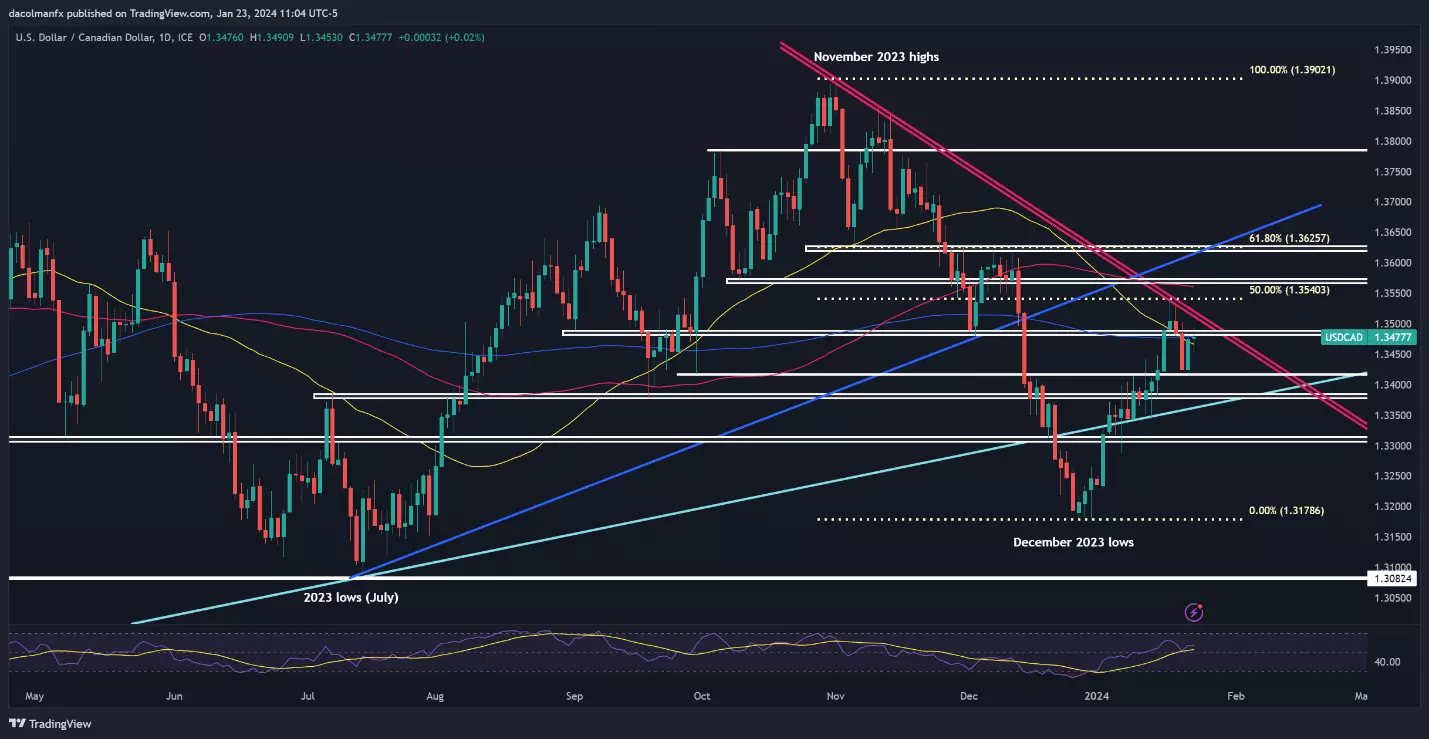
USD/CAD daily chart
After a sharp pullback late last week, USD/CAD has regained ground over the past two days, overcoming significant hurdles in the process, including the 200-day and 50-day simple moving averages. Should gains accelerate in the coming days, trendline resistance appears at 1.3500. Looking higher, the crosshairs will be on 1.3540, the 50% retracement of the November/December downturn.
In contrast, should USD/CAD's upward momentum falter and prices turn lower, primary support below the key moving averages highlighted before looms at 1.3415, followed by 1.3380. Although the pair may bottom out in this region during a pullback, a decisive breakdown could create the right conditions for a drop toward the 1.3300 handle.
USD/CAD daily chart
 Source: TradingView
This information has been prepared by IG, a trading name of IG Australia Pty Ltd. In addition to the disclaimer below, the material on this page does not contain a record of our trading prices, or an offer of, or solicitation for, a transaction in any financial instrument. IG accepts no responsibility for any use that may be made of these comments and for any consequences that result. No representation or warranty is given as to the accuracy or completeness of this information. Consequently any person acting on it does so entirely at their own risk. Any research provided does not have regard to the specific investment objectives, financial situation and needs of any specific person who may receive it. It has not been prepared in accordance with legal requirements designed to promote the independence of investment research and as such is considered to be a marketing communication. Although we are not specifically constrained from dealing ahead of our recommendations we do not seek to take advantage of them before they are provided to our clients.
-
Gold rebounds but faces resistance at $2,040, while GBP/USD consolidates within a symmetrical triangle. Russell 2000 encounters resistance at 2,000. Critical levels and potential trends explored in technical analyses.
 Source: Bloomberg
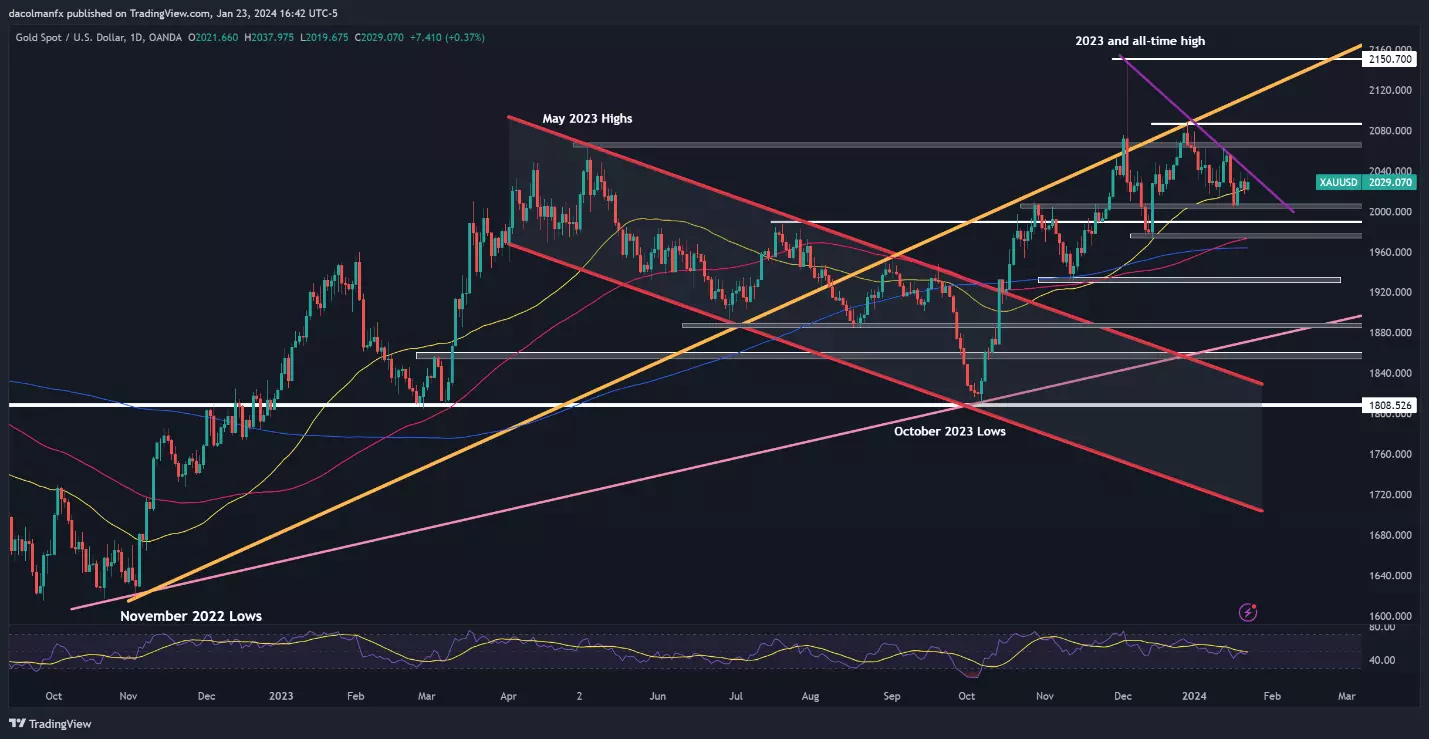
Gold technical analysis
After falling to multi-week lows last Wednesday, gold has recovered some ground in recent days; however, the rebound appears to be losing momentum, with prices approaching trendline resistance at $2,040. To gauge the future direction, it’s vital to see how XAU/USD reacts around this ceiling, keeping in mind that a breakout could usher in a move towards $2,065. Moving up, all eyes will be on $2,080.
In case of a bearish rejection around $2,040, technical support is positioned around $2,005. The precious metal might find stability in this area during a pullback before mounting a turnaround, but should prices fall below this threshold, the bears could initiate an assault on $1,975. Additional losses from this point onward could draw attention to the 200-day simple moving average.
Gold price daily chart
 Source: TradingView
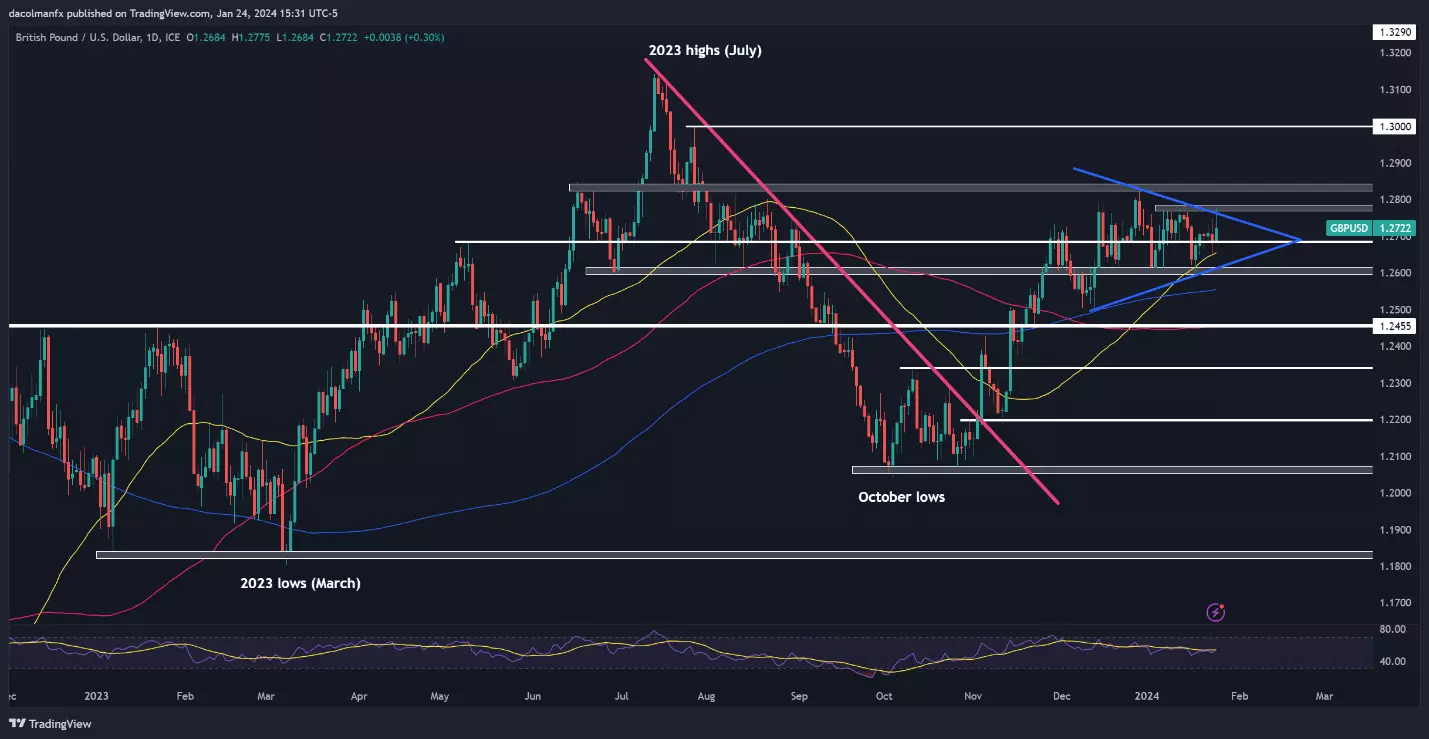
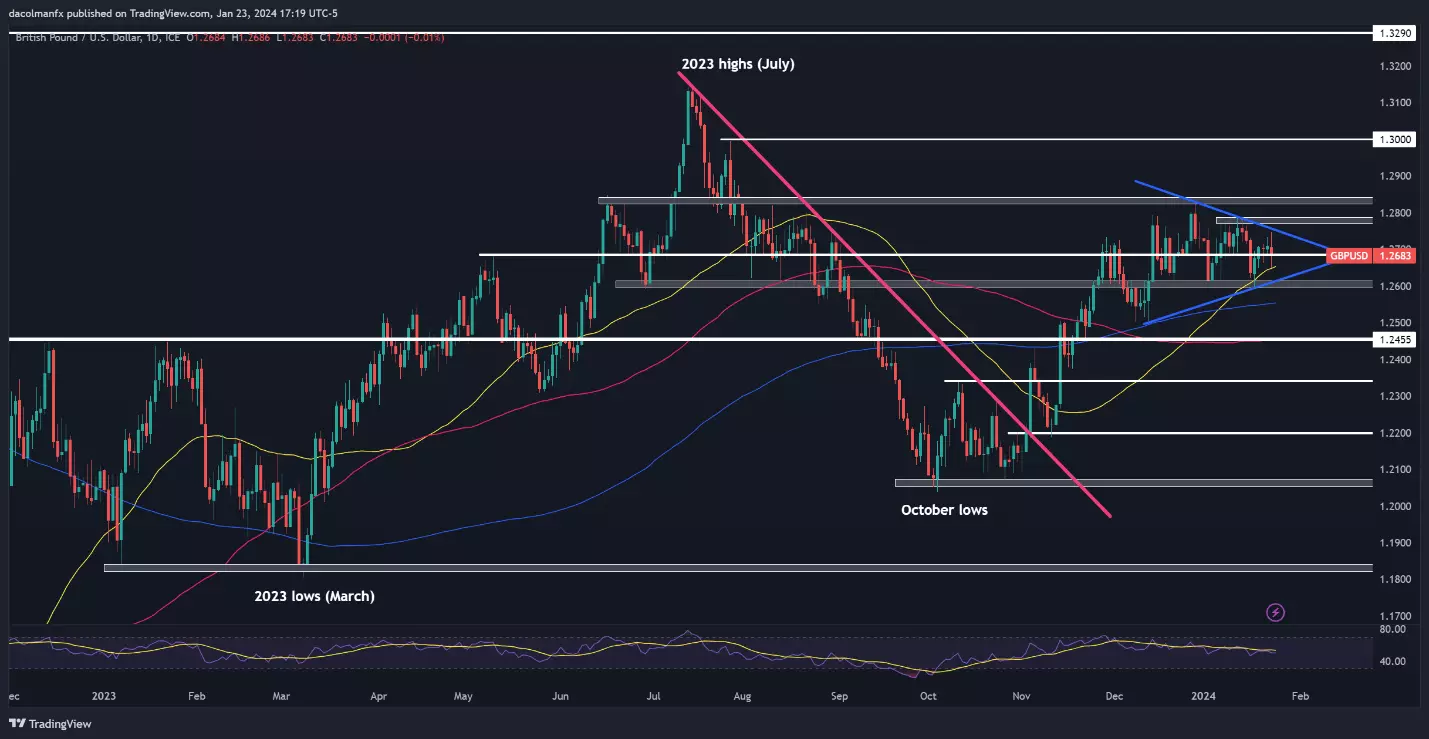
GBP/USD technical analysis
GBP/USD has been in an uptrend since October of last year, but its upward impetus has faded in recent weeks, with cable entering a consolidation phase, as reflected by the pair’s coiling within what appears to be a symmetrical triangle.
A symmetrical triangle, composed of two converging trend lines, an ascending one connecting a sequence of higher highs, and a descending one linking a series of lower lows, is usually considered a continuation pattern once confirmed.
This setup is validated once prices breach the triangle, especially if the move is in the direction of the prevailing trend. In the case at hand, GBP/USD might rally towards 1.2775 upon successfully clearing 1.2750. With continued strength, the focus could shift to 1.2830, followed by 1.3000.
On the other hand, if consolidation resolves to the downside and prices fall below support at 1.2600, the 200-day simple moving average will serve as the next line of defense against a deeper pullback. Shifting gaze downward, all eyes will be on 1.2455.
GBP/USD daily chart
 Source: TradingView
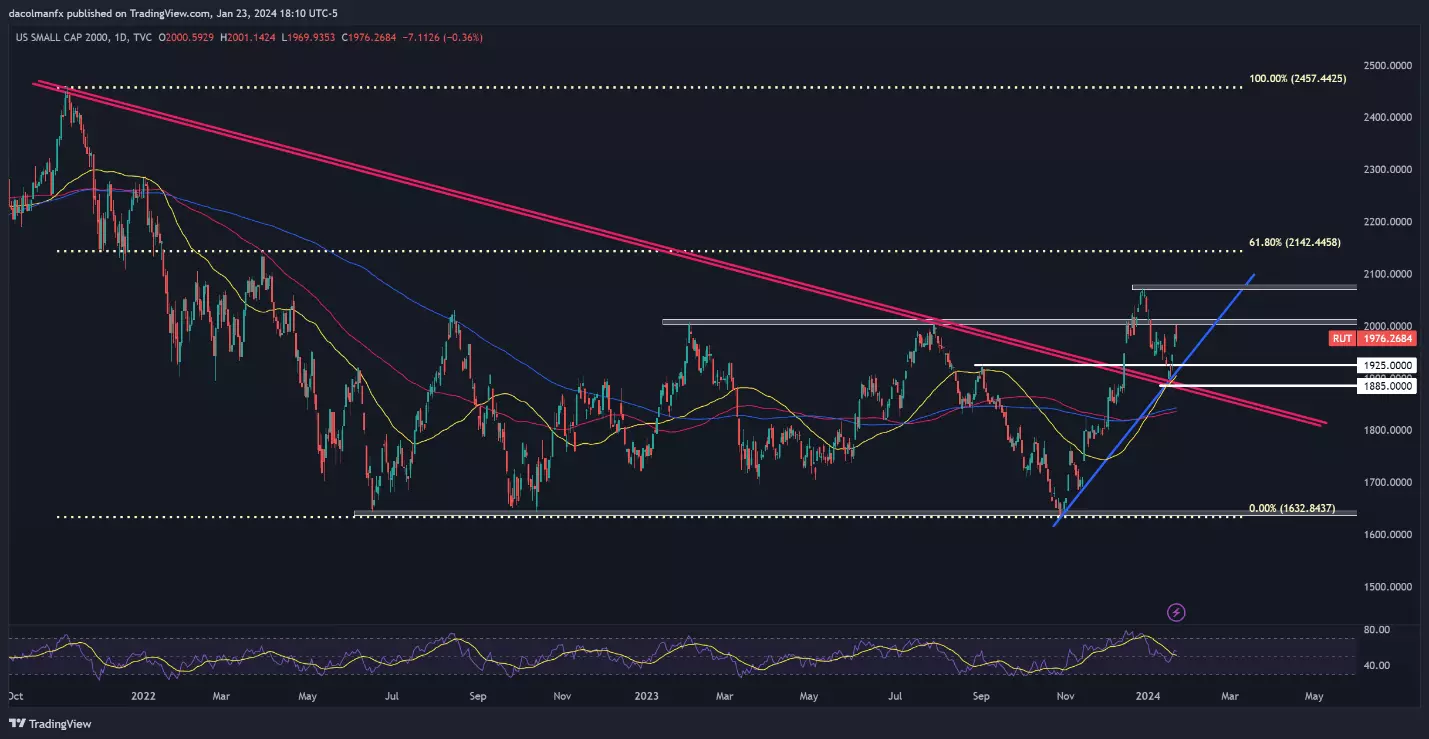
Russell 2000 technical analysis
Following a sharp selloff earlier this month, the Russell 2000 has rebounded recently, though it has encountered resistance near the psychological 2,000 level. The small-cap equity index's ability to surpass this hurdle remains in question, but if a decisive breakout occurs, a retest of last year’s highs near 2,075 could be around the corner. On further strength, a move towards 2,142 should not be ruled out.
On the flip side, if sellers return and regain decisive control of the market, prices could head back toward trendline support at $1,925. The Russell 2000 could bottom out around these levels during a retrenchment before staging a turnaround; however, a breakdown could intensify downward pressure, paving the way for a drop toward 1,885.
Russell 2000 daily chart
 Source: TradingView
This information has been prepared by IG, a trading name of IG Australia Pty Ltd. In addition to the disclaimer below, the material on this page does not contain a record of our trading prices, or an offer of, or solicitation for, a transaction in any financial instrument. IG accepts no responsibility for any use that may be made of these comments and for any consequences that result. No representation or warranty is given as to the accuracy or completeness of this information. Consequently any person acting on it does so entirely at their own risk. Any research provided does not have regard to the specific investment objectives, financial situation and needs of any specific person who may receive it. It has not been prepared in accordance with legal requirements designed to promote the independence of investment research and as such is considered to be a marketing communication. Although we are not specifically constrained from dealing ahead of our recommendations we do not seek to take advantage of them before they are provided to our clients.
-
3 hours ago, mamillion01 said:
Good morning does anyone has Bitcoin and Etherium analysis?
Hi @mamillion01
Check out Bitcoin analysis from @tradinglounge
All the best
MongiIG
-
Netflix earnings last night provided more support for bullish sentiment, after the streaming giant announced subscriber numbers that were well ahead of forecasts. While it missed on earnings expectations, Netflix did beat on revenues. Asian markets were more positive overnight, though the Nikkei 225 slipped back. Chinese markets made some headway after the proposed stimulus announcement yesterday, though enthusiasm was muted. Alibaba stock was supported by news that Jack Ma was actively buying shares in the retailer. Global PMI figures dominate the day in Europe and the US, while Tesla takes its turn in the spotlight as it reports earnings.

-
DAX rebounds despite ECB's unexpected hawkish stance. This week's meeting takes center stage for insights on rates and growth. Technical analyses for DAX and FTSE highlight key levels.
 Source: Bloomberg
Overnight, the German stock market, the DAX extended its rebound, driven by gains in the tech sector.
Its recovery in recent days has come despite ECB members sounding more hawkish than expected ahead of this week's meeting; despite evidence of slower growth and falls in underlying inflation.
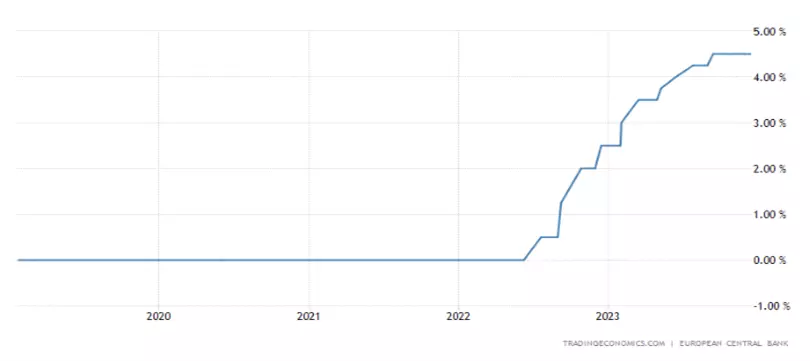
What is expected from this week's ECB meeting?
At its last meeting in December, the ECB kept its deposit rate on hold at 4.00%, as widely expected. The ECB noted that with interest rates at this level, it will make a "substantial contribution" to returning CPI to its 2% goal in 2025. Inflation data for December received in early January showed core inflation cooling to 3.4%, the lowest since March 2022, and headline inflation stayed below 3%.
While this shows that tighter monetary policy settings are winning the battle against high inflation, tighter monetary policy also impacts growth and activity data. Reflecting concerns that the European economy, led by Germany, will enter recession in 2024, the European rates market is pricing in 130bp of ECB rate cuts for 2024.
Nonetheless, in the lead-up to this week's meeting, ECB officials, including president Lagarde, have noted that aggressive pricing of rate cuts is not "helping our fight against inflation". As such, the ECB is expected to keep rates on hold this week and reiterate that rates will be set "at sufficiently restrictive levels for as long as necessary."
ECB deposit rate chart
 Source: TradingEconomics
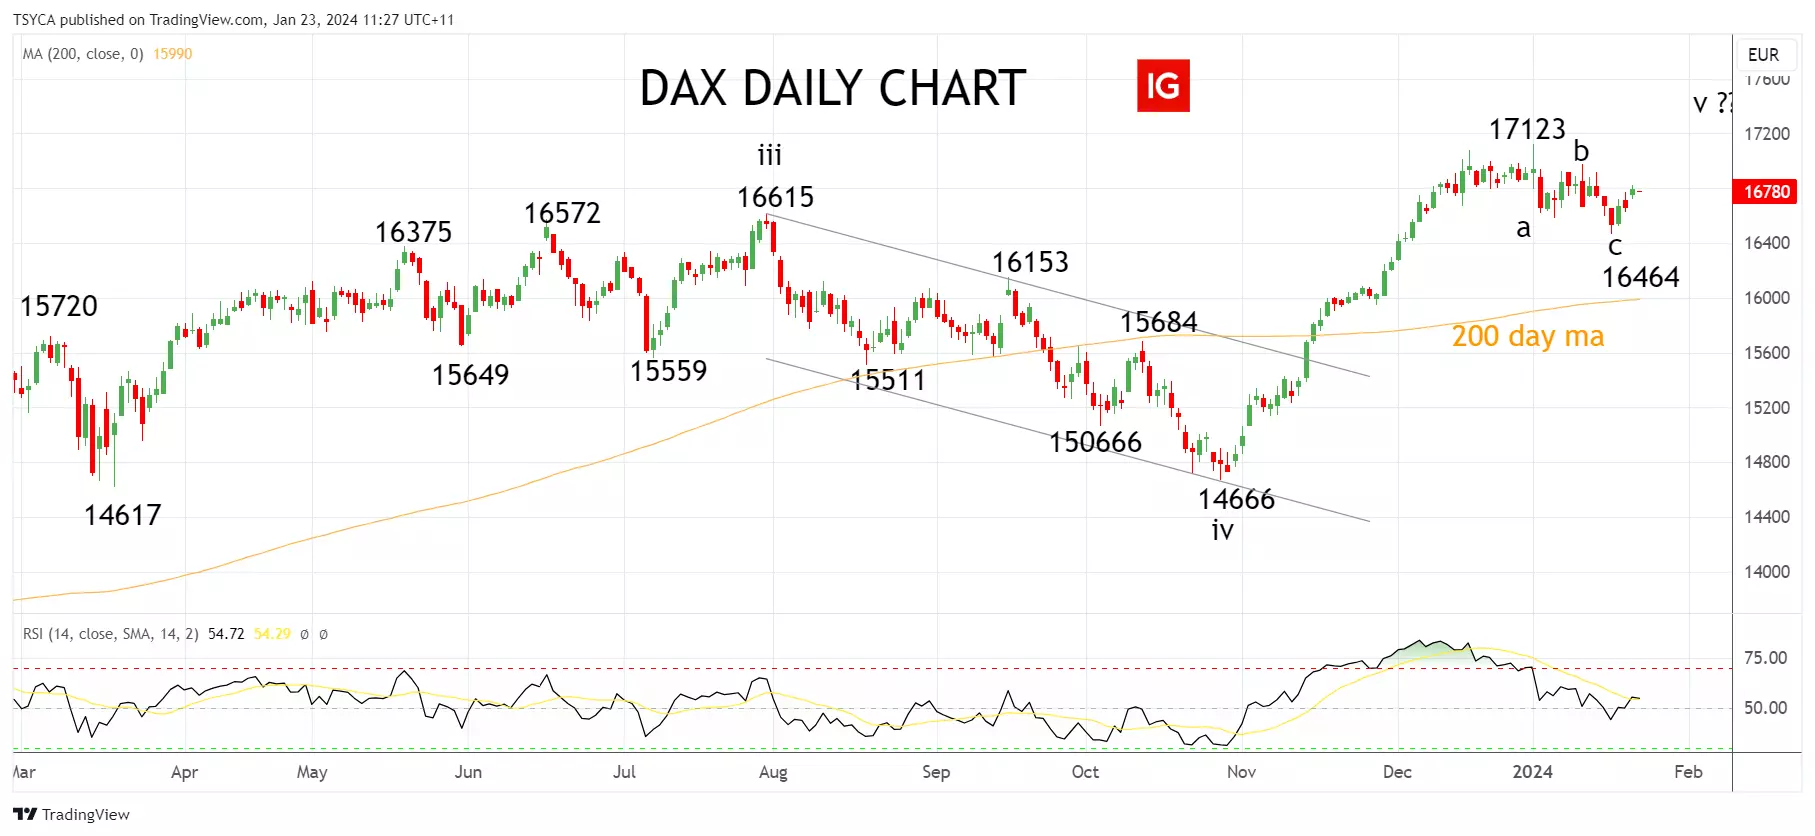
DAX technical analysis
In our last update, we noted that a sustained break below support at 16,600/500 would increase the chances that a medium-term high was in place in the DAX at the early January 17,123 high.
However, given the brief time that the DAX spent trading below the bottom of the support band and the three-wave nature of the decline, it is likely that the decline was a correction, and that the DAX can push to new highs in the 17,200/400 area.
In summary, providing the DAX holds above support 16450ish, we expect a retest of the January 7,123 high before a move towards 17,200/400.
DAX daily chart
 Source: TradingView
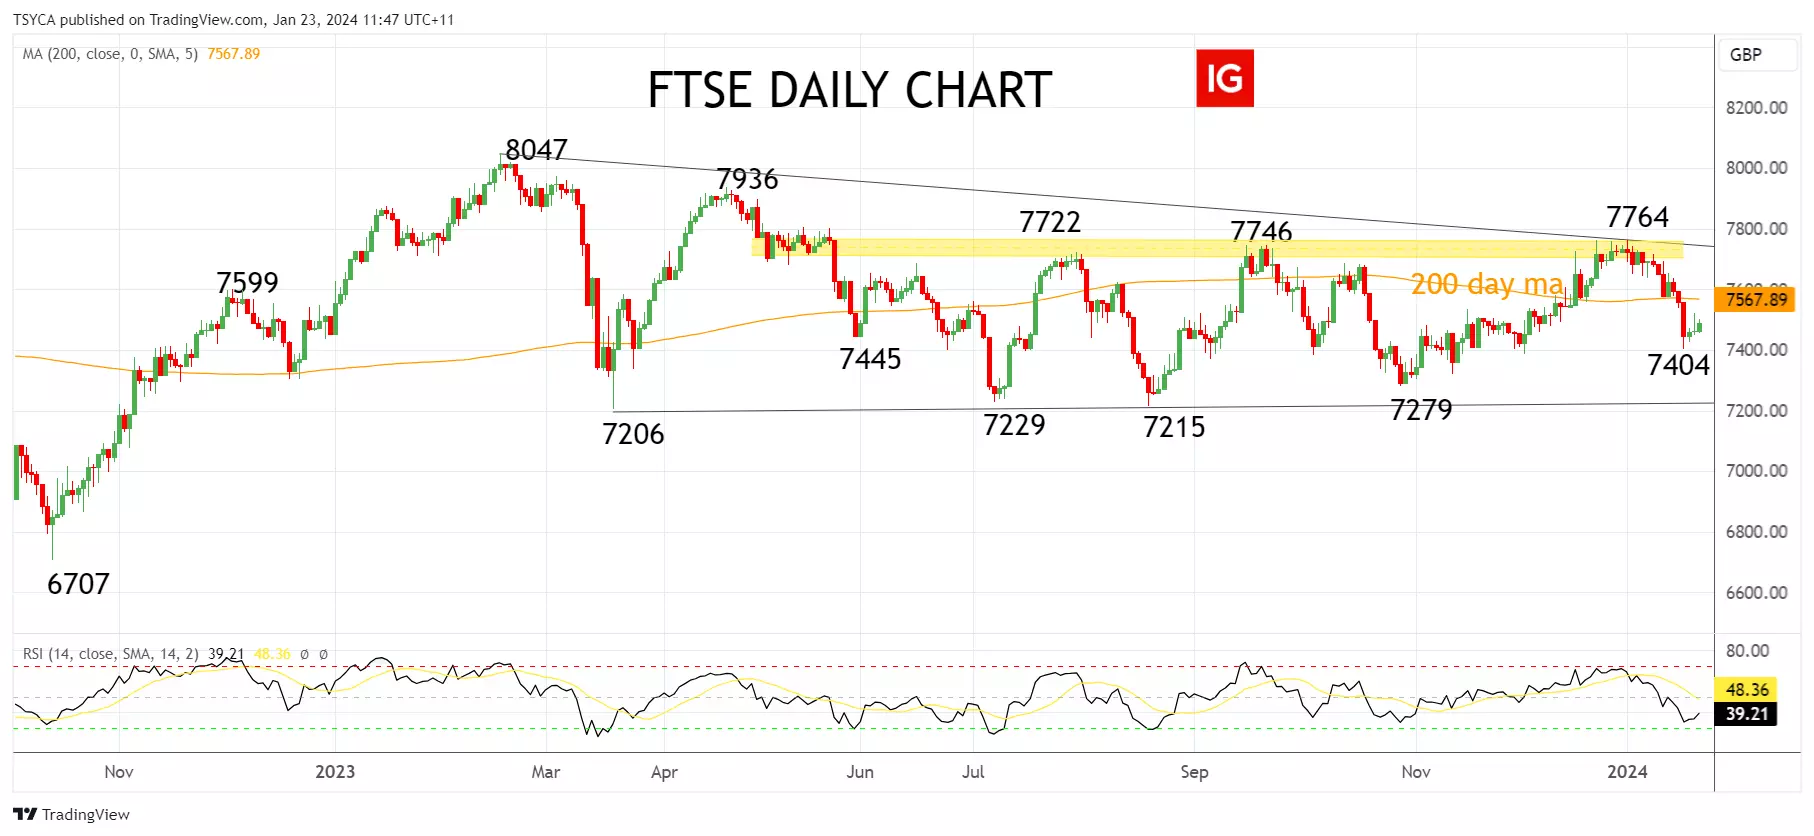
FTSE technical analysis
In the final weeks of December 2023, the FTSE broke higher above the 200-day moving average at 7570 before running into a cluster of horizontal resistance near 7750, highlighted on the chart below.
Since then, the FTSE has erased all of its December gains despite a favourable tailwind from US stock indices in recent days, which isn't a particularly encouraging sign.
As such, while the FTSE remains below the 200-day moving average at 7567 (sustained basis), the risks are for a deeper decline in the coming sessions towards range lows, 7300/7200.
FTSE daily chart
 Source: TradingView
- Source: TradingView. The figures stated are as of 23 January 2024. Past performance is not a reliable indicator of future performance. This report does not contain and is not to be taken as containing any financial product advice or financial product recommendation.
This information has been prepared by IG, a trading name of IG Markets Limited. In addition to the disclaimer below, the material on this page does not contain a record of our trading prices, or an offer of, or solicitation for, a transaction in any financial instrument. IG accepts no responsibility for any use that may be made of these comments and for any consequences that result. No representation or warranty is given as to the accuracy or completeness of this information. Consequently any person acting on it does so entirely at their own risk. Any research provided does not have regard to the specific investment objectives, financial situation and needs of any specific person who may receive it. It has not been prepared in accordance with legal requirements designed to promote the independence of investment research and as such is considered to be a marketing communication. Although we are not specifically constrained from dealing ahead of our recommendations we do not seek to take advantage of them before they are provided to our clients. See full non-independent research disclaimer and quarterly summary.
-
The Bank of Japan left policy unchanged at its meeting, noting that deflationary expectations were firmly entrenched in Japan. The next policy meeting is mid-March, but annual wage talks will still be in progress then, so markets are unlikely to see any movement in policy until 26 April at the earliest. The Hang Seng was was lifted by reports of a potential support package of around $278 billion from offshore accounts of state-owned enterprises, to buy shares on the Hong Kong exchange. Netflix becomes the first of the 'Magnificent 7' tech stocks to report earnings, and expectations are generally optimistic thanks to the moves to end password sharing and the start of paid sharing in key markets.

-
S&P 500 surges past 2022 highs on tech and sentiment boost. Key earnings and economic events ahead signal a pivotal week for US markets.
After a choppy opening three weeks of 2024, the S&P 500 showed its hand on Friday night, surging above the January 2022 4818 bull market high.
Precisely two years in the making, and with a 28% pullback in between, the push to new highs was supported by the tech sector buoyed by Taiwan semiconductors' better-than-expected earnings report and a broker upgrade for Apple.
A giddy mix of data within the University of Michigan's consumer sentiment survey also helped fuel the move. Consumer sentiment in January soared to 78.8 from 69.7 in December, the largest two-month increase since the recession of 1991 ended. Notably, inflation expectations for the year ahead fell to 2.9%, the lowest since 2020 from 3.1%.
This week, the drivers of US equity markets will be earnings reports from tech giants Netflix, Tesla, and Intel Corp, along with Johnson and Johnson, Procter and Gamble, Visa and American Express. The key economic events will be Flash PMIs for January, Q4 Advanced GDP, the Fed's preferred measure of inflation, and the Core PCE price index for December. The Fed speakers' blackout period has commenced before the Fed's January meeting.
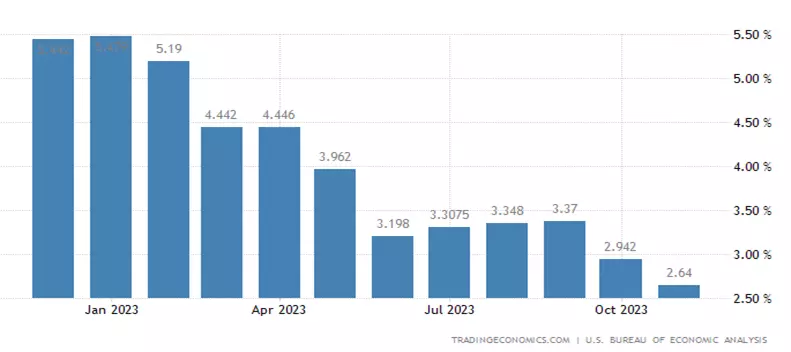
What is expected from the core PCE inflation report (Saturday, January 27th at 12.30 am AEST)?
Two months ago, annual headline PCE inflation eased to 2.6% from 2.9% prior. The Fed’s preferred measure of inflation, core PCE, cooled to 3.2% YoY, the lowest level since mid-2021, from 3.4% prior.
In December, headline PCE is expected to remain stable at 2.6% YoY and core PCE inflation is expected to fall to 3% YoY. On a six-month annualised basis, core PCE will remain at close to 2%. At 2%, monetary policy is too tight and will likely see the Fed cut rates several times in 2024.
Headline PCE price index chart
 Source: TradingEconomics
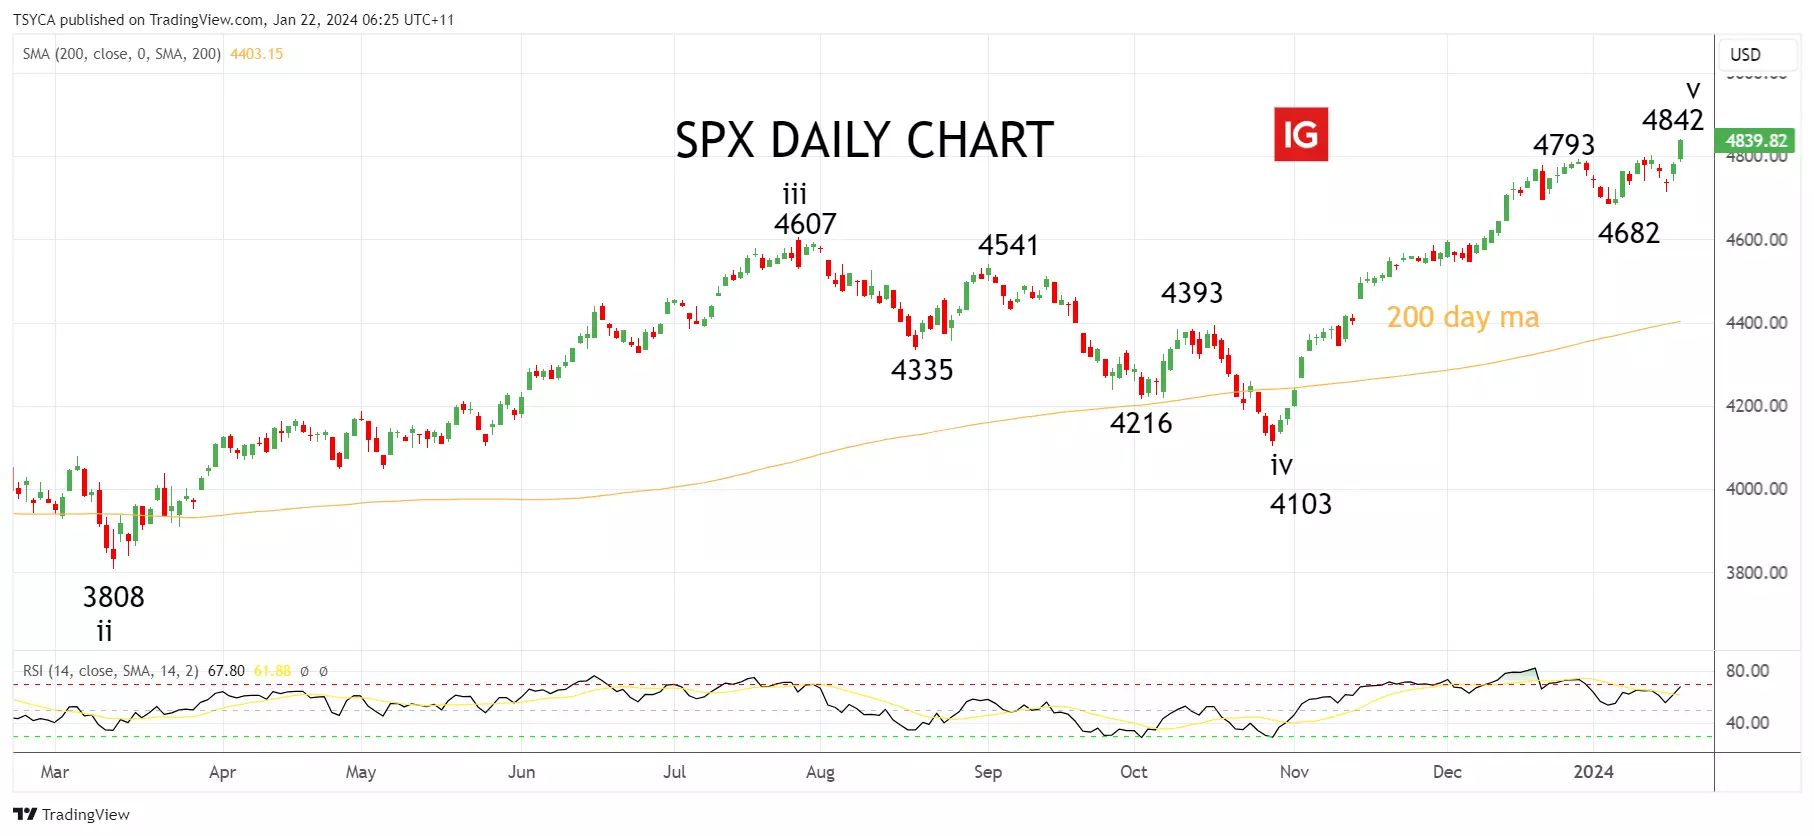
S&P 500 technical analysis
After a strong rally for the S&P 500 into the end of 2023, we started the New Year in a more cautious/neutral frame of mind.
While we would not be fighting Friday night's break higher, given the risk the rally overshoots, we remain of the view that the S&P 500 is in the final stages (Wave V) of its rally from the October 2023 low and note again the bearish RSI divergence. Bearish RSI divergence occurs when prices make new highs, but the RSI fails to make a new high.
As such, we remain patient, waiting for a pullback to develop in the coming weeks in the order of 5-8% - a pullback we will be looking to buy.
S&P 500 daily chart
 Source: TradingView
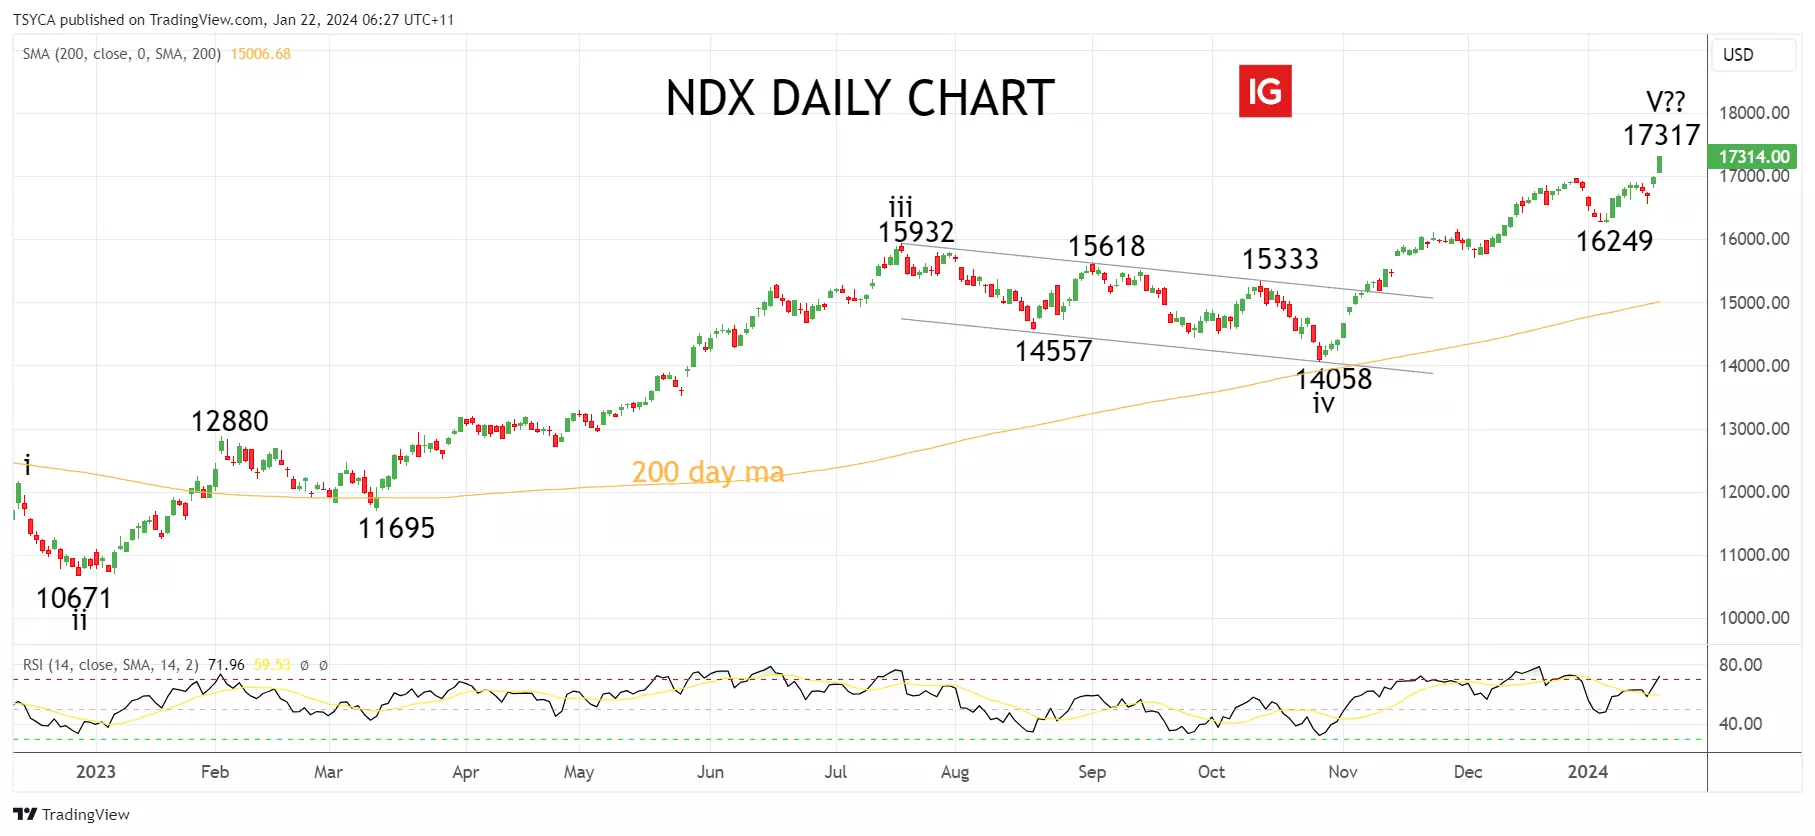
Nasdaq technical analysis
After a strong rally for Nasdaq into the end of 2023, we started the new year in a more cautious/neutral frame of mind.
While we would not be fighting Friday night's rip higher, we remain of the view that the Nasdaq is in the final stages (Wave V) of its rally from the October 2023 low and note again the bearish RSI divergence. Bearish RSI divergence occurs when prices make new highs, but the RSI fails to make a new high.
As such, we remain patient, waiting for a pullback to develop in the coming weeks in the order of 5-10% - a pullback we will be looking to buy.
Nasdaq daily chart
 Source: TradingView
- Source: TradingView. The figures stated are as of 22 January 2023. Past performance is not a reliable indicator of future performance. This report does not contain and is not to be taken as containing any financial product advice or financial product recommendation.
This information has been prepared by IG, a trading name of IG Australia Pty Ltd. In addition to the disclaimer below, the material on this page does not contain a record of our trading prices, or an offer of, or solicitation for, a transaction in any financial instrument. IG accepts no responsibility for any use that may be made of these comments and for any consequences that result. No representation or warranty is given as to the accuracy or completeness of this information. Consequently any person acting on it does so entirely at their own risk. Any research provided does not have regard to the specific investment objectives, financial situation and needs of any specific person who may receive it. It has not been prepared in accordance with legal requirements designed to promote the independence of investment research and as such is considered to be a marketing communication. Although we are not specifically constrained from dealing ahead of our recommendations we do not seek to take advantage of them before they are provided to our clients.


Intel’s stock price rally checked by weak earnings
in Shares and ETFs
Posted
The surge in Intel’s stock price was hit by a weak outlook in the latest earnings report, though the longer-term trend is still intact.
Intel drops in wake of earnings
Intel Corporation experienced a significant drop in its stock value, plunging over 10% during premarket trading after the semiconductor giant disclosed its fourth-quarter (Q4) results. While Intel surpassed earnings expectations for the quarter, its forward-looking guidance disappointed investors, signalling potential headwinds for the company.
Weak outlook pressures the shares
In a challenging market, Intel forecast Q1 adjusted earnings per share (EPS) of $0.13, a stark contrast to the $0.34 anticipated by analysts. Furthermore, projected revenue for the quarter is estimated to be between $12.2 billion and $13.2 billion, which is notably lower than the anticipated $14.2 billion.
This conservative outlook has raised concerns among traders and investors about the company's near-term growth prospects.
Despite the cautious outlook, Intel's Q4 performance was robust, with adjusted EPS of $0.54, ahead of the expected $0.44. Revenue was also higher than expected, at $15.4 billion.
Intel's Client Computing Group, however, reported a successful quarter with sales amounting to $8.8 billion, surpassing the $8.4 billion forecast by analysts and marking a 33% increase from the previous year. This performance suggests that Intel continues to hold a strong position in the personal computing market.
The company is also making strides in its strategic shift to become a foundry for other chipmakers. Although the Intel Foundry Services division fell short of analyst expectations, generating
$291 million in revenue as opposed to the predicted $ 43 million, this initiative represents a long-term investment in Intel's future as a diversified semiconductor industry leader.
Intel stock price – technical analysis
Following their solid rally over the past year or so, Intel shares have slid through their steep October-to-January uptrend line and trade back below their 200-week simple moving average (SMA) at $44.92 which now acts as resistance, together with the 55-day SMA at $45.01 and the late-November high and mid-January low at $45.34 to $45.65.
While this resistance area caps, downside pressure should be maintained with the December low at $41.17 representing a possible downside target.
For the bulls to be back in control, not only would Friday’s price gap need to get filled but a rise above Thursday’s high at $50.30 would also need to occur. This currently looks highly unlikely, though.
This information has been prepared by IG, a trading name of IG Markets Limited. In addition to the disclaimer below, the material on this page does not contain a record of our trading prices, or an offer of, or solicitation for, a transaction in any financial instrument. IG accepts no responsibility for any use that may be made of these comments and for any consequences that result. No representation or warranty is given as to the accuracy or completeness of this information. Consequently any person acting on it does so entirely at their own risk. Any research provided does not have regard to the specific investment objectives, financial situation and needs of any specific person who may receive it. It has not been prepared in accordance with legal requirements designed to promote the independence of investment research and as such is considered to be a marketing communication. Although we are not specifically constrained from dealing ahead of our recommendations we do not seek to take advantage of them before they are provided to our clients. See full non-independent research disclaimer and quarterly summary.