

MongiIG
-
Posts
9,899 -
Joined
-
Last visited
-
Days Won
41
Content Type
Profiles
Forums
Blogs
Events
Community Tutorials
Store
Posts posted by MongiIG
-
-
-
56 minutes ago, phillo said:

Thanks for tracking USD/CNH @phillo
-
The first Black Swan Battle between IG’s chief analyst Chris Beauchamp and South African analyst Shaun Murison is about the Dot-Com bubble.
What are your thoughts?

-
Stock markets hit an air pocket yesterday, dropping sharply after the run of gains made since the end of October. In Asia the Nikkei 225 led the fallers, losing 1.5%, while US yields ticked higher. Markets continue to keep a way eye on the Red Sea, where a US-led force is to begin escorting vessels to protect them from drone and missile attacks. Today's US initial jobless claims figures are the main event of the session, with just PCE price data tomorrow left before Christmas.

-
With 2024 now in the sights of traders and investors, we look ahead to the moments that matter in the new year – from earnings season to elections and from global conflict to IPOs.
2024 outlook
The video talks about what to look out for in 2024 when it comes to trading. It explains that profits for companies have been better than expected this year, and it is predicted that this trend will continue next year, which will help keep stock prices steady. The video also mentions that the Federal Reserve, which is like the boss of the US economy, is planning to lower interest rates a few times in 2024. This, together with the strong US economy, should be good news for companies and their profits.
In the UK, there will be a time called the ISA season starting from February where investors will need to consider different types of investments because interest rates will be going up. But even with these rising rates, stock prices are still expected to rise, and it might be a good idea to invest in companies that pay out a portion of their profits as dividends, like the top 100 companies in the FTSE stock market index.
The US election
Something else to keep an eye on is the US election happening in November 2024. President Donald Trump is running for re-election against Joe Biden, the current president. The video warns that this could cause some changes and instability in the US and global markets.
The Ukraine and the Middle East conflicts
There have also been conflicts in various parts of the world, including Ukraine and the Middle East. Although these conflicts have not had a big impact on the markets so far, they could cause some problems, especially when it comes to the price of oil. Interest rates have also been a hot topic over the past couple of years. Central banks around the world have been raising rates to control inflation. However, it seems that this trend may be reversing, with the Federal Reserve planning to lower rates in 2024. This is expected to be good news for the global economy and could result in more gains in stock prices.
Initial Public Offerings
Lastly, the video talks about Initial Public Offerings (IPOs), which are when a company sells its shares to the public for the first time. IPOs have been scarce in recent years, but there are a couple of companies, like Shine and Reddit, that might go public in 2024. This means there could be more opportunities to invest in new companies. Overall, the video gives an overview of important things to watch out for in 2024, like the earnings season, elections, global conflicts, interest rates, and potential IPOs. These factors could have an impact on trading and investing.
This information has been prepared by IG, a trading name of IG Markets Limited. In addition to the disclaimer below, the material on this page does not contain a record of our trading prices, or an offer of, or solicitation for, a transaction in any financial instrument. IG accepts no responsibility for any use that may be made of these comments and for any consequences that result. No representation or warranty is given as to the accuracy or completeness of this information. Consequently any person acting on it does so entirely at their own risk. Any research provided does not have regard to the specific investment objectives, financial situation and needs of any specific person who may receive it. It has not been prepared in accordance with legal requirements designed to promote the independence of investment research and as such is considered to be a marketing communication. Although we are not specifically constrained from dealing ahead of our recommendations we do not seek to take advantage of them before they are provided to our clients. See full non-independent research disclaimer and quarterly summary.
-
2023 has surprised many with fairly hefty gains for some stock indices, admittedly driven by an elite few big stocks.
There’s been a rise in gold to a new record high, driven in part by a relatively dovish Fed, pushing US 10yr yields down to levels not seen since the summer, but there’s also a rise in the recession risk unless central banks act outside their remit and start cutting rates to avoid a GDP contraction. IGTV caught up with IG’s Chris Beauchamp, Axel Rudolph, Nick Cawley and Richard Snow. After a look back at the year in the rear view mirror the discussion turned to what we should expect to be the main areas of interest in 2024. The discussion included an initial rise in stocks followed by a period of consolidation, the chances of a weaker USD continuing to drive gains in gold, the potential for gains in the crypto space, and how to trade the opportunity without any digital currency exposure.
(AI Video Transcript)
Global stock indices
The year 2023 was full of surprises in the trading world. Global stock indices like the Dow and the DAX reached record highs, thanks to big gains from companies like Nvidia, Microsoft and Apple. However, the dollar didn't perform as well and 10-year Treasury yields hit levels we haven't seen since June. People were expecting the Fed to cut interest rates, but the big question was whether or not we could avoid a recession. It was a rollercoaster ride of a year that caught many off guard.
The NASDAQ, S&P 500, and the DAX
Looking ahead to 2024, we're hopeful for a brighter outlook, but we should proceed with caution. There's a chance things could get volatile due to events like geopolitical conflicts and surges in inflation. In 2023, there were some successful trades in equity markets like the NASDAQ, S&P 500, and the DAX. Orange futures and sugar also performed well, although there were some unexpected ups and downs.
The foreign exchange market had a battle between what people expected and what the Fed was saying about interest rates. Going into 2024, it's predicted that the dollar will continue to weaken, which will be a relief for many markets. People are also keeping an eye on the dollar yen pair, as there could be a change in policy from the Bank of Japan that could cause a downward move in the pair.
The FTSE 100
The FTSE 100 hasn't been doing so great because major tech stocks are missing. Institutional flow has been weak and uncertainties about the UK economy and politics have scared some investors away. Cryptocurrencies and gold have shown potential for gains, but they've also been quite volatile. It all depends on things like ETF approvals and how the economy is doing.
The oil markets
The oil market has been worried about a possible recession and slow demand growth, but stability is expected in 2024 with potential supply cuts and changes. The Chinese economy was a letdown in 2023, with reopening efforts failing and concerns about deflation. We're not sure when things will turn around or if the Chinese government will provide stimulus.
Chinese markets
Chinese markets like the Hang Seng may see more declines and volatility in the coming months. Overall, it's important to be cautious and aware of the potential risks when looking at market performance and predictions for 2024.
This information has been prepared by IG, a trading name of IG Markets Limited. In addition to the disclaimer below, the material on this page does not contain a record of our trading prices, or an offer of, or solicitation for, a transaction in any financial instrument. IG accepts no responsibility for any use that may be made of these comments and for any consequences that result. No representation or warranty is given as to the accuracy or completeness of this information. Consequently any person acting on it does so entirely at their own risk. Any research provided does not have regard to the specific investment objectives, financial situation and needs of any specific person who may receive it. It has not been prepared in accordance with legal requirements designed to promote the independence of investment research and as such is considered to be a marketing communication. Although we are not specifically constrained from dealing ahead of our recommendations we do not seek to take advantage of them before they are provided to our clients. See full non-independent research disclaimer and quarterly summary.
-
FTSE 100 rallies on softer inflation, DAX 40 and S&P 500 also grind higher still
Outlook on FTSE 100, DAX 40 and S&P 500 as UK inflations surprises to the downside.
 Source: Bloomberg
FTSE 100 tries to reach its September peak
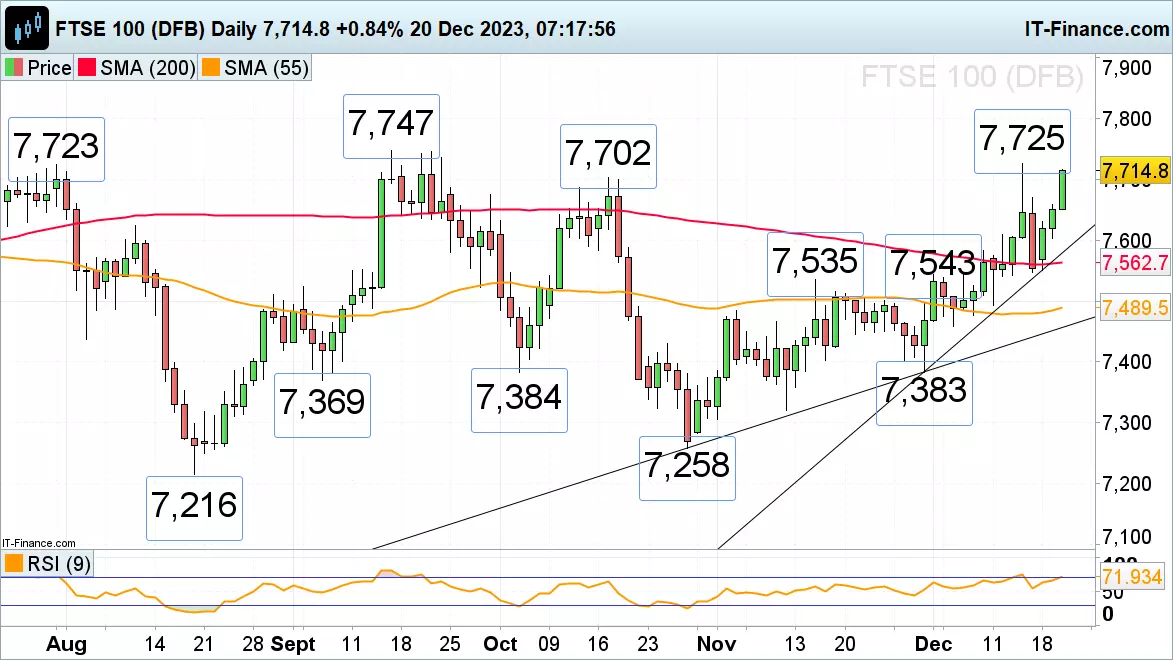
The FTSE 100 is on track for its third straight day of gains and has overcome its 7,702 October high while on its way to its near three-month high at 7,725 as UK inflation comes in much lower than expected in November at 3.9% versus a forecast 4.4% and 4.6% in October. Core inflation dropped to 5.1% versus a forecast 5.6% and a previous reading of 5.7%. Above 7,725 beckons the September peak at 7,747. Potential slips should find support around Friday’s 7,670 high and at Tuesday’s 7,658 high.
 Source: ProRealTime
DAX 40 consolidates below last week’s all-time record high
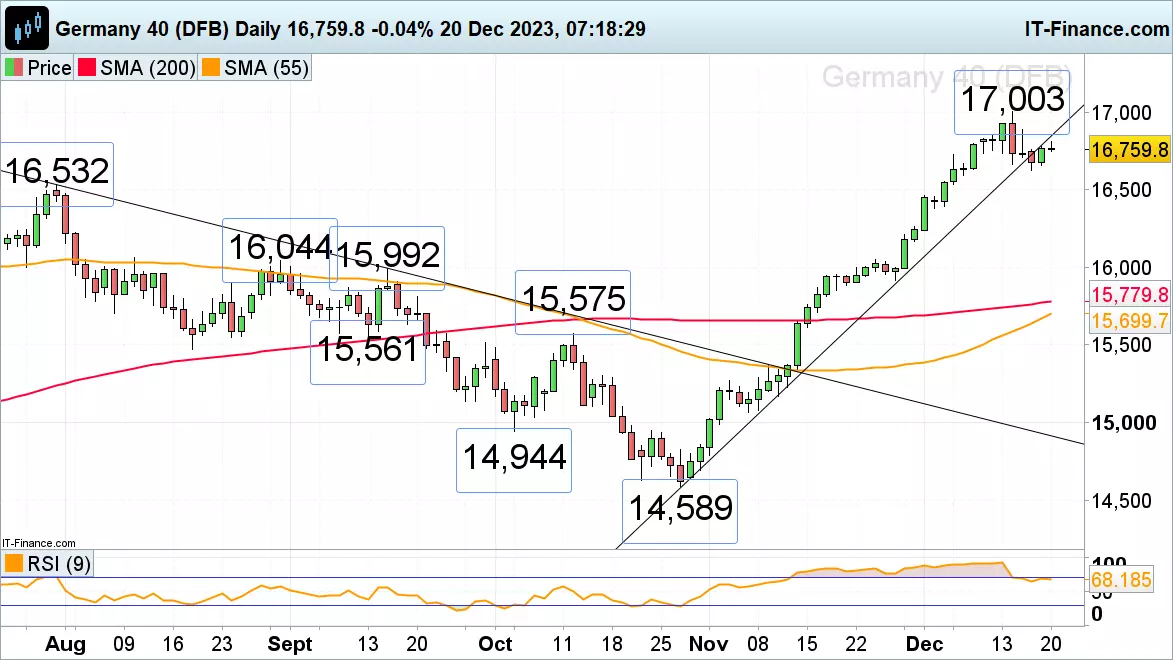
The DAX 40, which led the way to its record high at around the 17,000 mark last week, is taking a back seat and consolidates roughly between 16,700 and 16,800 as German GfK consumer confidence, though better than expected, remains at -25.1 and year-on-year PPI comes in worse than expected at -7.9%. The index now trades below the October-to-December uptrend line at 16,844 which, because of inverse polarity, acts as a resistance line. While it caps, this week’s low at 16,626 might be revisited. A fall through it would eye the July peak at 16,532. Resistance is seen around the 11 December high at 16,827 and at Friday’s 16,889 high ahead of last week’s peak at 17,003.
 Source: ProRealTime
S&P 500 grinds higher still and nears its all-time record high
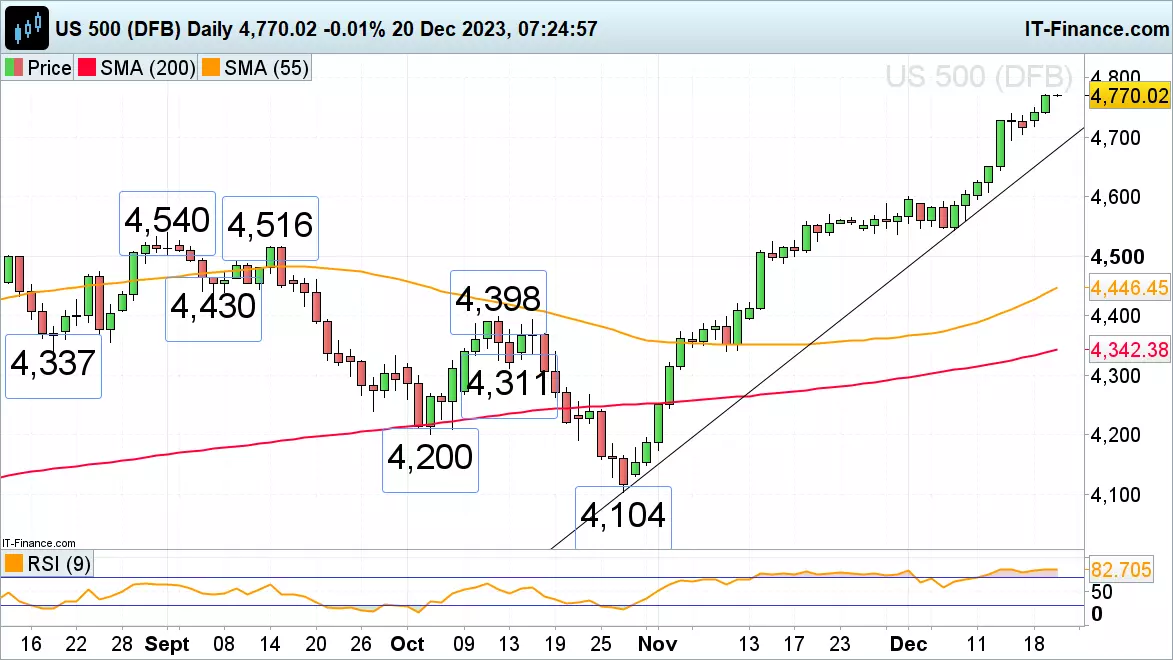
The S&P’s advance is ongoing with Atlanta Federal Reserve (Fed) President Raphael Bostic’s comment over the lack of "urgency" to remove the restrictive stance being ignored by the financial markets which instead focused on Richmond Fed President Tom Barkin’s comments that the US was making good progress on inflation. Now that the November and mid-December 2021 highs at 4,743 to 4,752 have been bettered, the S&P 500 is approaching its all-time record high made in January 2022 at 4,817. Minor support below Monday’s 4,750 high can be spotted at last week’s 4,739 high. Further down lies the 4,694 March 2022 peak at 4,637. While the last few weeks’ lows at 4,544 to 4,537 underpin, the medium-term uptrend stays intact.
 Source: ProRealTime
-
Brent crude oil price rise nears resistance while sugar bounces off nine-month low and corn slips
Outlook on Brent crude oil, corn and sugar futures ahead of the festive season.
 Source: Bloomberg
Brent crude oil on track for sixth consecutive day of gains
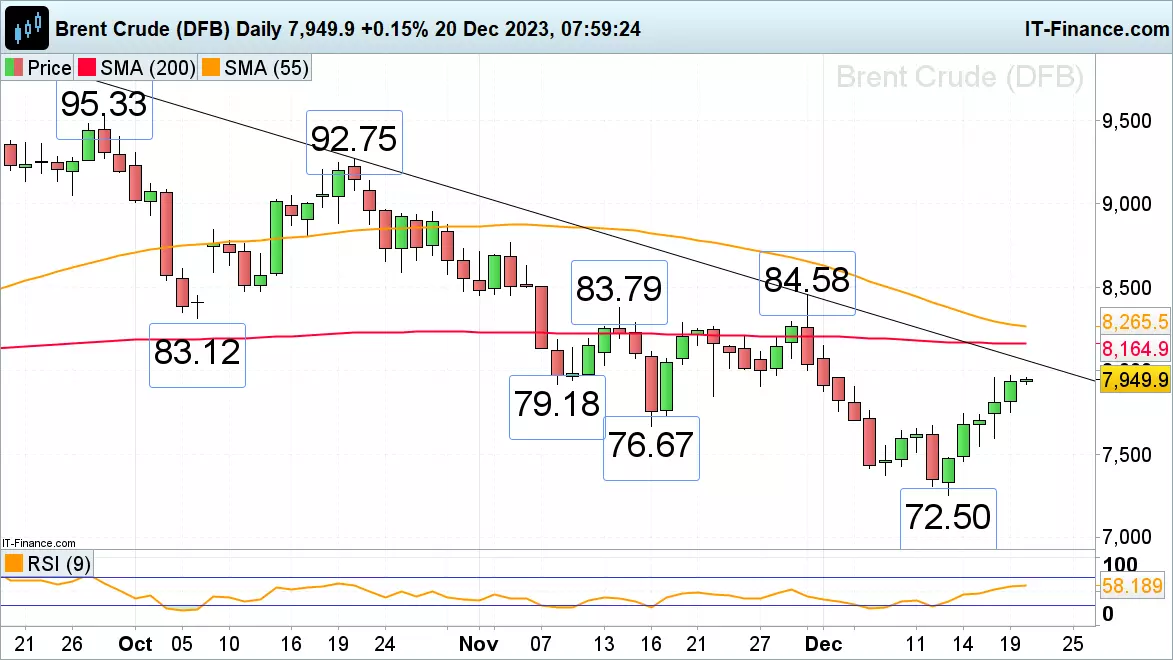
Brent crude oil futures have risen for five straight days as Red Sea shipping concerns unnerve traders and are heading towards the October-to-December downtrend line at 80.62. Further up meanders the 200-day simple moving average (SMA) at 81.64 which may also act as resistance. Support below the 79.18 early November low is seen around the 14 December high at 77.44.
 Source:ProRealTime
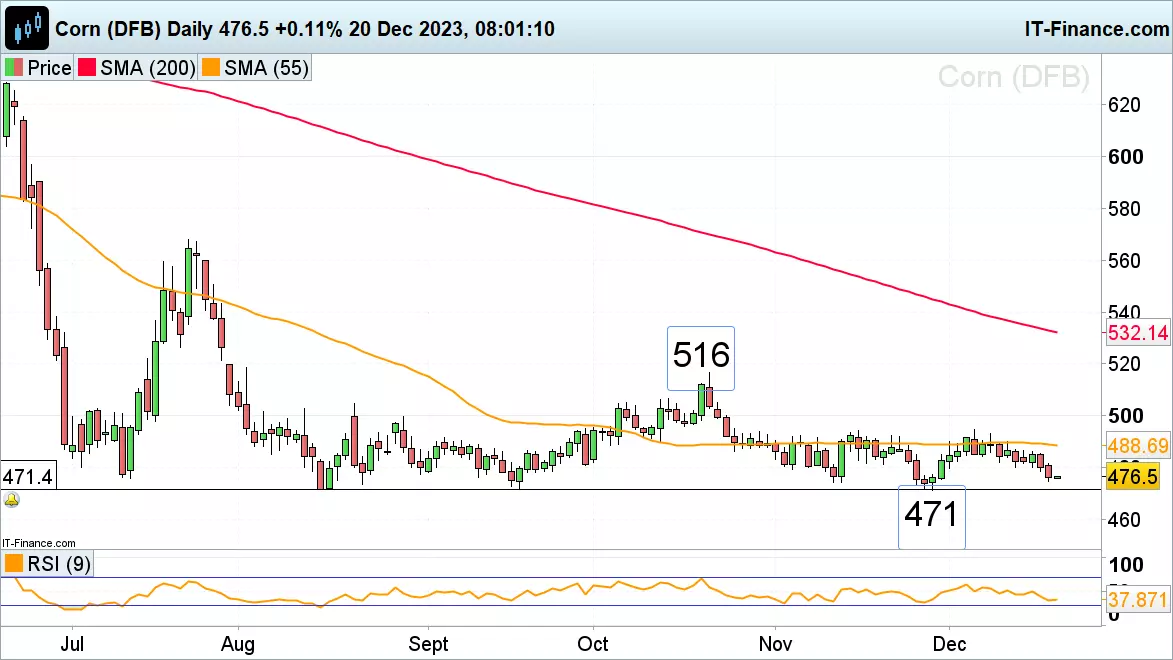
Corn price slips towards three-year low
Front month corn futures are slipping back towards their November three-year low at 471 as Brazil pulls ahead of the US as the biggest supplier of the commodity to China. A fall through 471 would engage the June 2019 high at 466.7 and mean that the major support zone which has held since August, has finally given way. Minor resistance above the 13 December low at 480 can be seen along the 55-day simple moving average (SMA) at 488.69.
 Source:ProRealTime
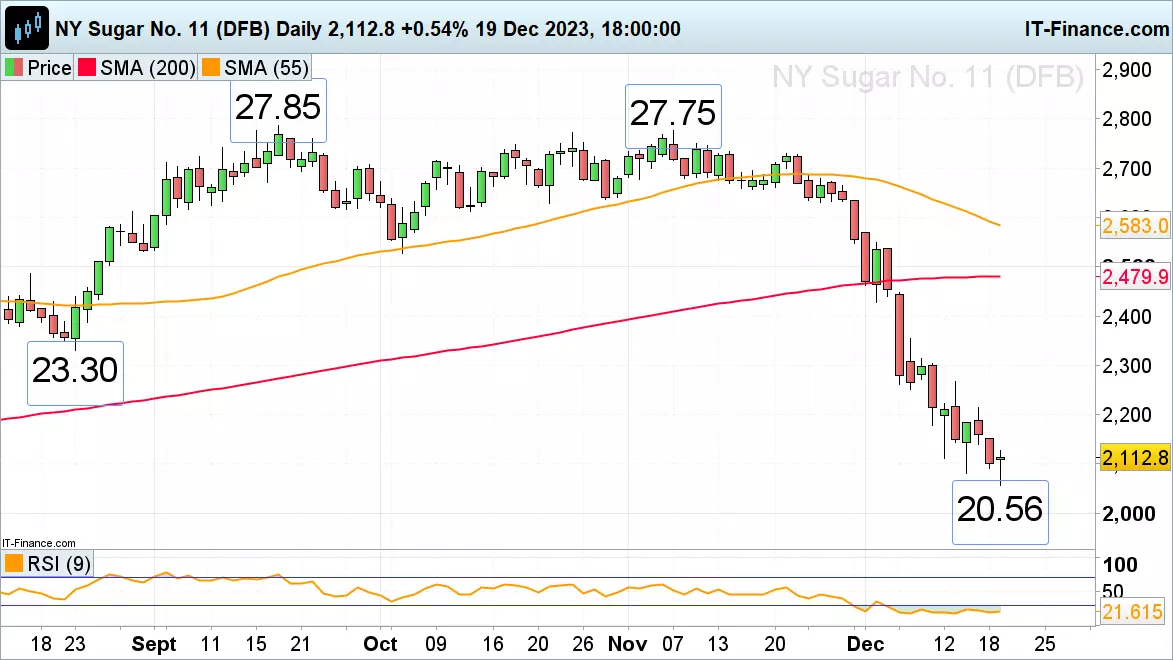
Sugar #11 recovers from nine-month low
Front month sugar futures prices plummeted from their 12-year high by over 25% over the past few weeks as supply concerns ease, dropping to 20.56, a nine-month low, before trying to regain some lost ground. Short-covering is taking the futures back to Friday’s low at 21.38. While Friday’s high at 22.14 isn’t overcome, though, the steep downtrend remains intact with the psychological 20.00 mark remaining in sight.
 Source:ProRealTime
 -
The US dollar extends its retracement as treasury yields push lower; meanwhile the greenback retains a bearish profile in the near term, meaning more losses could be around the corner.
 Source: Bloomberg
The US dollar, as measured by the DXY index, was a touch softer on Tuesday, down about 0.35% to 102.13, undermined by the pullback in treasury yields, which has continued this week following the Federal Reserve's pivot last Wednesday.
For context, the Fed took a more optimistic view of the inflation outlook at the conclusion of its December monetary policy meeting, admitting that discussions of cutting rates have begun, and signaling that it will deliver 75 basis points of easing in the coming year, a big shift from its previous stance.
With traders increasingly confident that the US central bank will prioritize economic growth over price stability and will slash borrowing costs numerous times in 2024, bond yields are likely to head lower in the near term, creating a hostile environment for the greenback.
Positive sentiment and market exuberance triggered by the FOMC’s dovish posture will also act as a headwind for the greenback, boosting riskier and high-beta currencies for the time being. Against this backdrop, we could see new lows for the DXY index before the end of 2023.
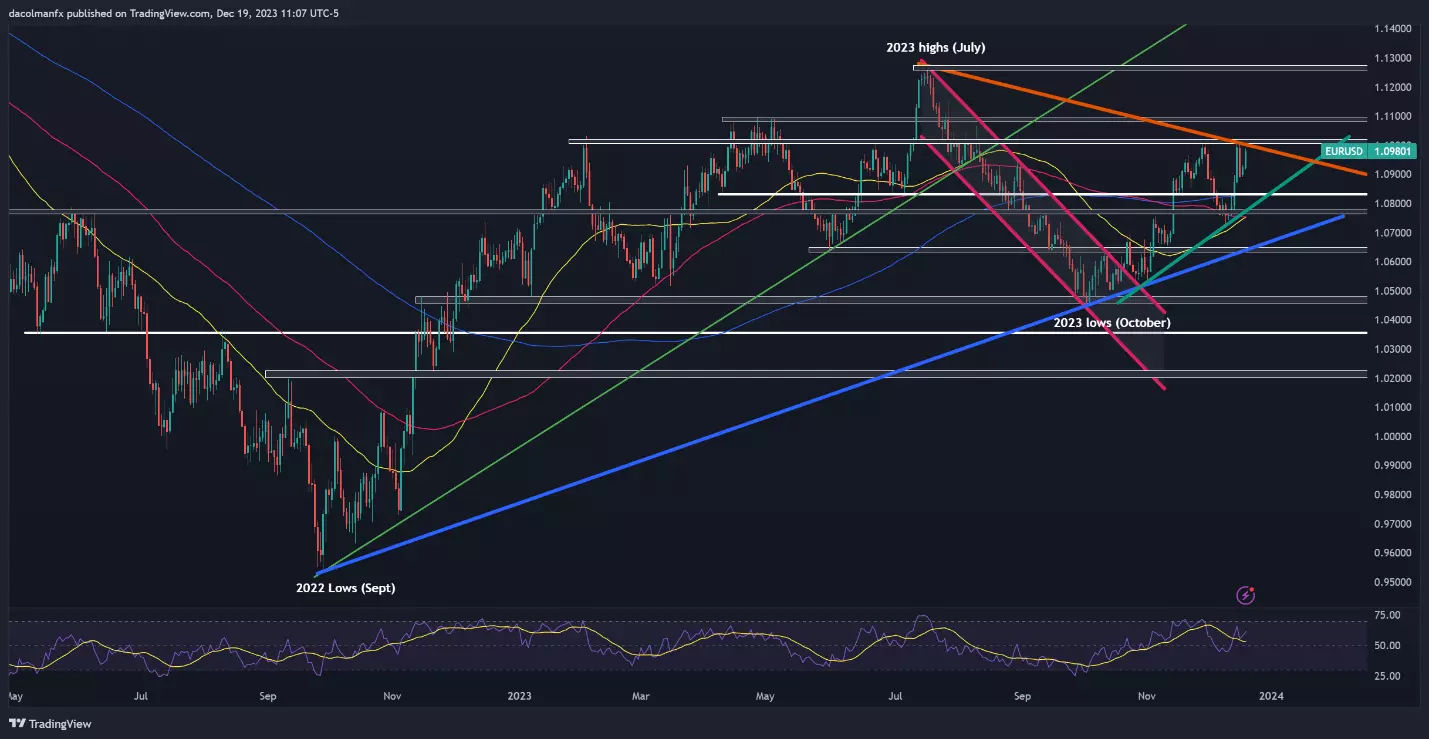
EUR/USD technical analysis
EUR/USD extended its advance and rose for the second straight day on Tuesday, pushing closer toward cluster resistance stretching from 1.1000 to 1.1015. Breaching this barrier may prove challenging for bulls, but a breakout could pave the way for a rally towards the 1.1100 handle.
Conversely, if bullish momentum fades and prices turn lower, the 200-day SMA near 1.0830 will be the first line of defense against a bearish assault. The pair is likely to establish a base in this region before staging a comeback, but if a breakdown occurs, a drop toward trendline support at 1.0770 could ensue.
EUR/USD daily chart
 Source: TradingView
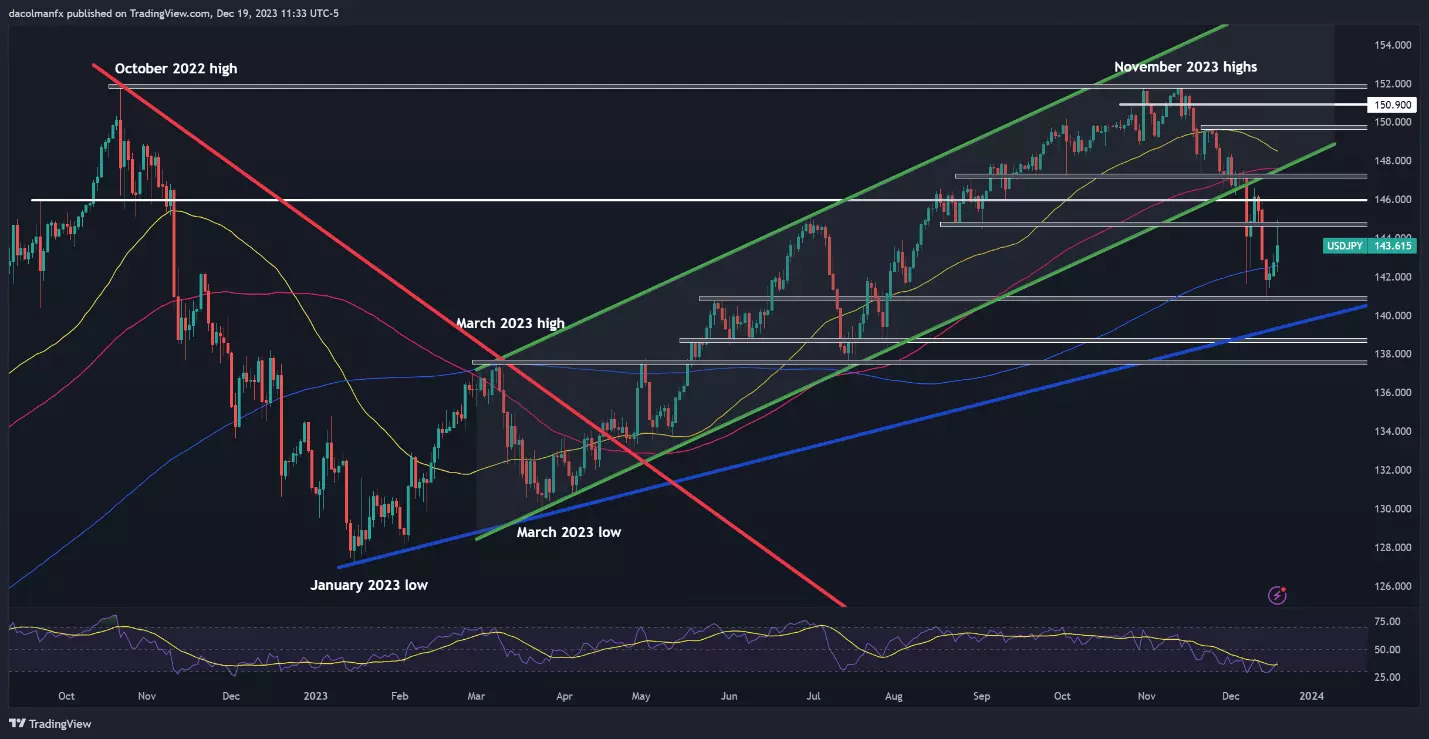
USD/JPY technical analysis
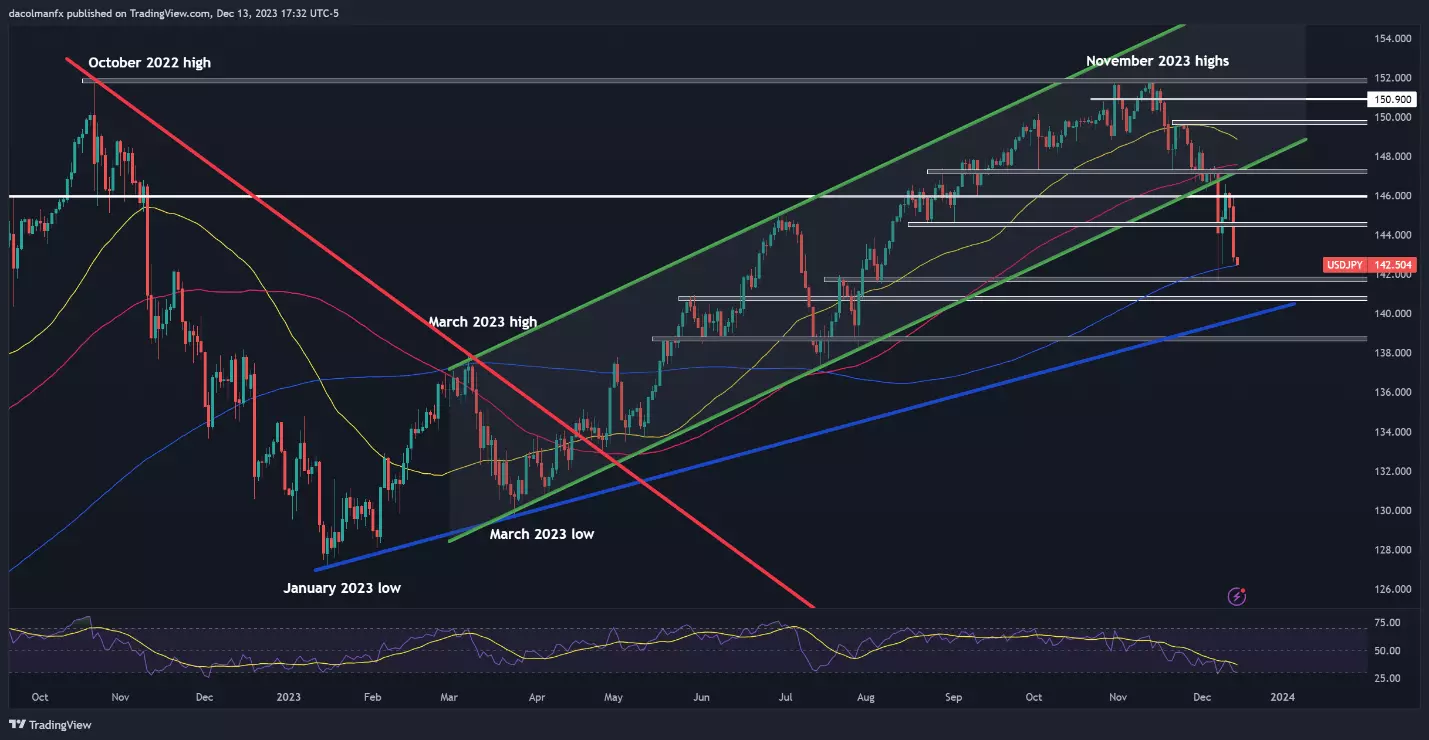
USD/JPY bucked the broader trend and rallied strongly, soaring more than 1% at one point after the Bank of Japan maintained its ultra-accommodative stance, indicating that it will be difficult to exit negative rates and that uncertainty about the outlook is extremely high. Despite this solid advance, the pair failed to push past resistance at 144.75, with sellers staunchly defending this barrier, as seen in the daily chart below.
Looking ahead, it is crucial to monitor price behavior around the 144.75 level, bearing in mind that a breakout could open the door for a move towards 146.00, followed by 147.30. Conversely, a firm rejection from 144.75 may trigger a retracement towards the 200-day simple moving average. On continued weakness, a retest of the December swing lows should not be dismissed.
USD/JPY daily chart
 Source: TradingView
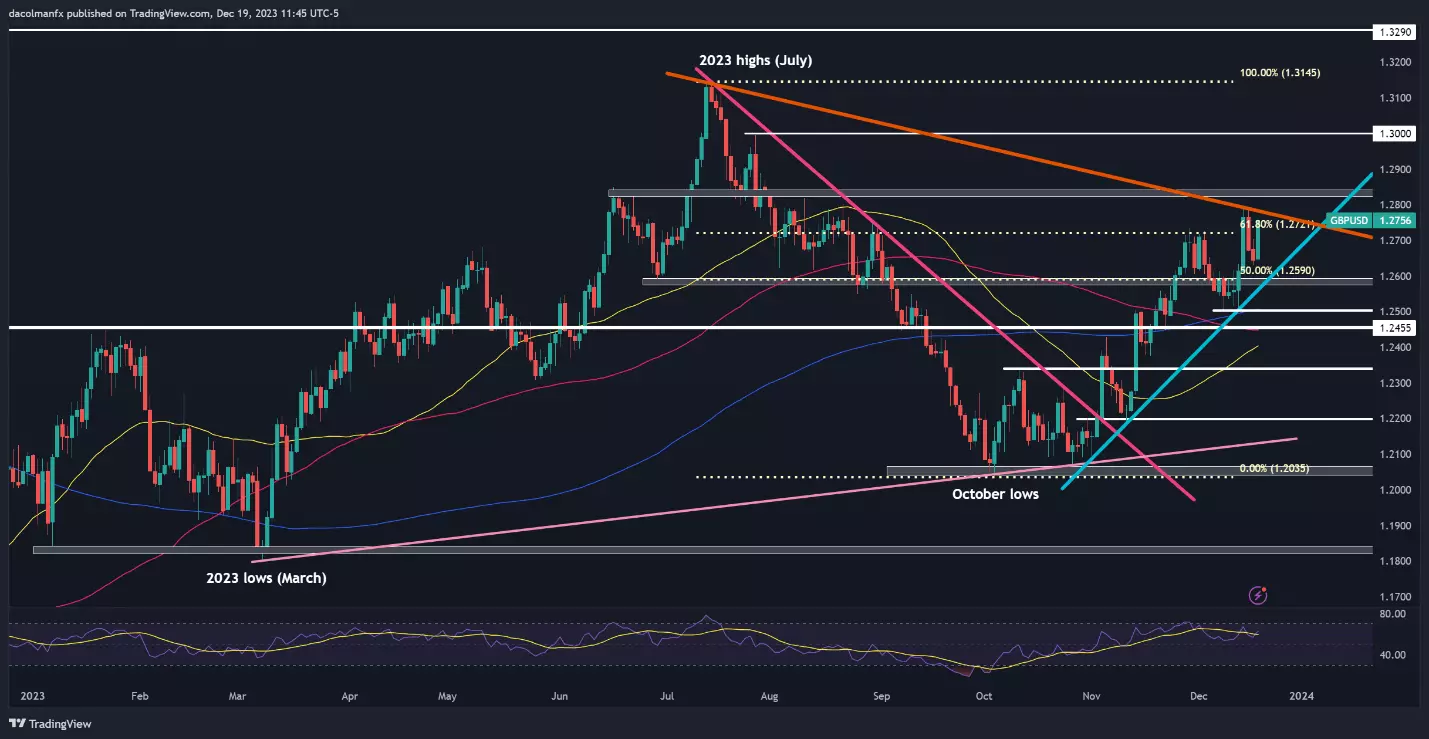
GBP/USD technical analysis
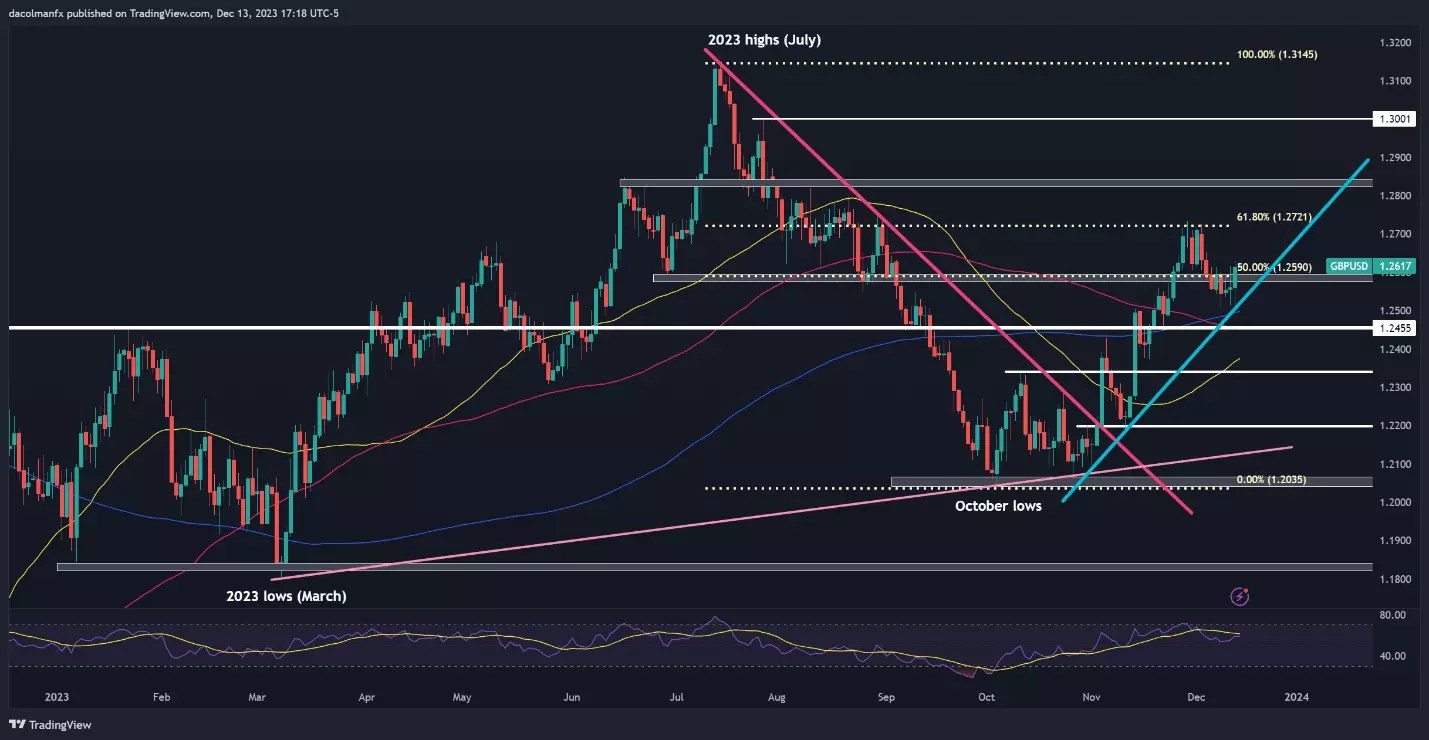
GBP/USD accelerated higher on Tuesday, breaching a key Fibonacci level at 1.2720 and pushing towards trendline resistance at 1.2780. This technical barrier must hold at all costs, failure to do so could propel prices above the 1.2800 handle. Should strength persist, the bulls may set their sights on the psychological 1.3000 threshold.
On the other hand, if sellers regain the upper hand and spark a bearish reversal, dynamic support is located at 1.2590, which corresponds to a short-term rising trendline extended off the November lows. This trendline should provide stability on a pullback, but in the event of a breakdown, a decline toward the 200-day simple moving average would emerge as the baseline scenario.
GBP/USD daily chart
 Source: TradingView
This information has been prepared by IG, a trading name of IG Australia Pty Ltd. In addition to the disclaimer below, the material on this page does not contain a record of our trading prices, or an offer of, or solicitation for, a transaction in any financial instrument. IG accepts no responsibility for any use that may be made of these comments and for any consequences that result. No representation or warranty is given as to the accuracy or completeness of this information. Consequently any person acting on it does so entirely at their own risk. Any research provided does not have regard to the specific investment objectives, financial situation and needs of any specific person who may receive it. It has not been prepared in accordance with legal requirements designed to promote the independence of investment research and as such is considered to be a marketing communication. Although we are not specifically constrained from dealing ahead of our recommendations we do not seek to take advantage of them before they are provided to our clients.
-
USD/JPY technical analysis
USD/JPY bucked the broader trend and rallied strongly, soaring more than 1% at one point after the Bank of Japan maintained its ultra-accommodative stance, indicating that it will be difficult to exit negative rates and that uncertainty about the outlook is extremely high. Despite this solid advance, the pair failed to push past resistance at 144.75, with sellers staunchly defending this barrier, as seen in the daily chart below.
Looking ahead, it is crucial to monitor price behavior around the 144.75 level, bearing in mind that a breakout could open the door for a move towards 146.00, followed by 147.30. Conversely, a firm rejection from 144.75 may trigger a retracement towards the 200-day simple moving average. On continued weakness, a retest of the December swing lows should not be dismissed.
USD/JPY daily chart
Source: TradingView
Diego Colman | Market Analyst, New York | Publication date:
-
-
On 18/12/2023 at 21:19, ModestInvestor said:
The New Year Gold Rush! Can it be that gold has seasonal trends? Will there be a New Year gold rush?
I looked at some figures I had from 2006 to 2016, calculated the average price and then plotted this on a graph. In fact in the period from 1st January until the end of February the average price increase was 5.75% and occurred in 9 out of 11 years.
I set out to further research and refine this trade:
The New Year Gold Rush (moneysandi.com)
$GOLD #gold
Thanks for sharing @ModestInvestor
-
 1
1
-
-
Gold rallies but stalls below $2,050/Oz; safe-haven interest could rise with ongoing Red Sea tensions. U.S. data, especially PCE, will impact the dollar and shape gold's week.
 Source: Bloomberg
IG Analyst | Publication date:
Source: Bloomberg
IG Analyst | Publication date:Gold prices found its legs in the US session rising back above resistance at the $2040/oz level. A slightly stronger US dollar kept gold bulls at bay in the European session, but ongoing comments from Fed policymakers around rate cuts continue to weigh on the Greenback.
Safe haven appeal and us dollar weakness
Geopolitical tensions have become a key driver this week following developments in the Middle East. The Red Sea has become breeding ground of uncertainty, and this seems as if it is only going to intensify. This leaves gold in the driver’s seat with more gains in store if no solution is found to the ongoing strife and tension in the Middle East.
The renewed US dollar weakness has also assisted gold hold the high ground and continue its advance. Federal Reserve policymakers have this week struck a dovish tone with most speaking about the amount of rate cuts needed in 2024; with very little push back besides the odd comment about monitoring data moving forward. The only push back in terms of comments came from policymaker Barkin saying that he thinks inflation is more stubborn than the average Fed official.
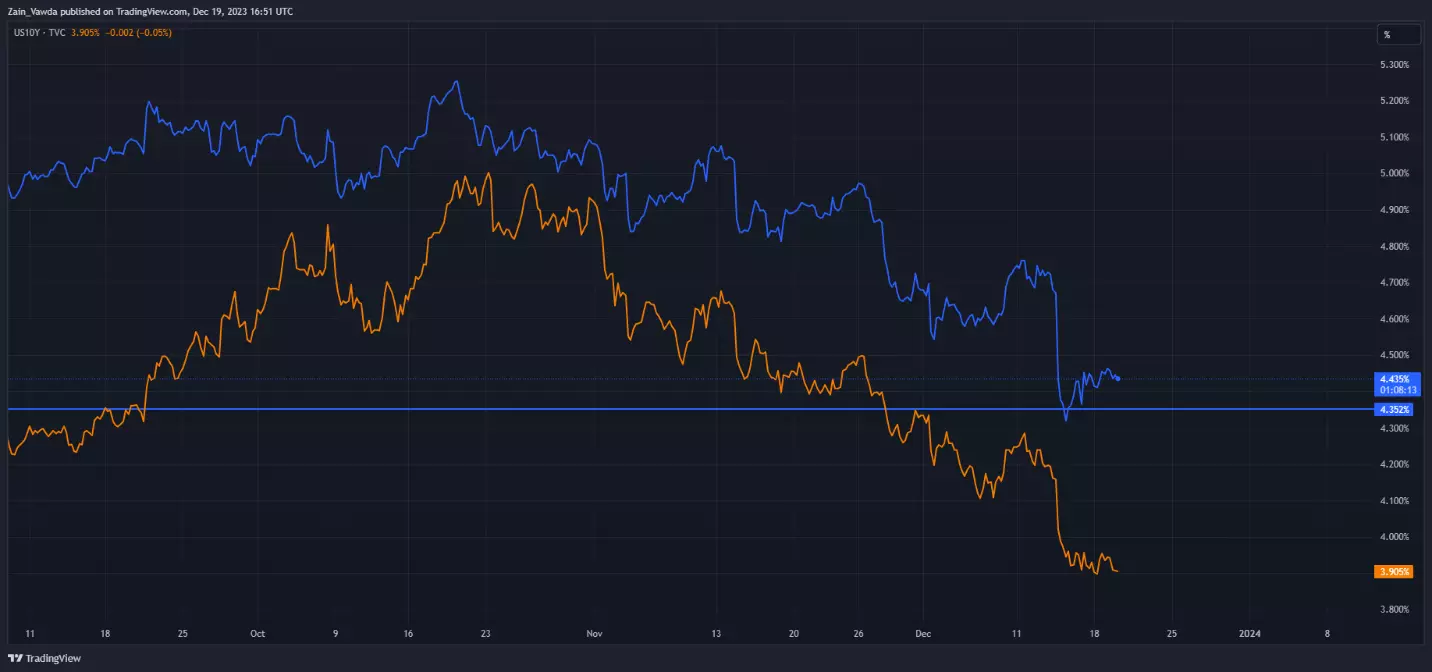
US treasury yields also continued their struggles today with both the 2Y and 10Y yield also benefitting gold.
US2Y and 10Y daily chart
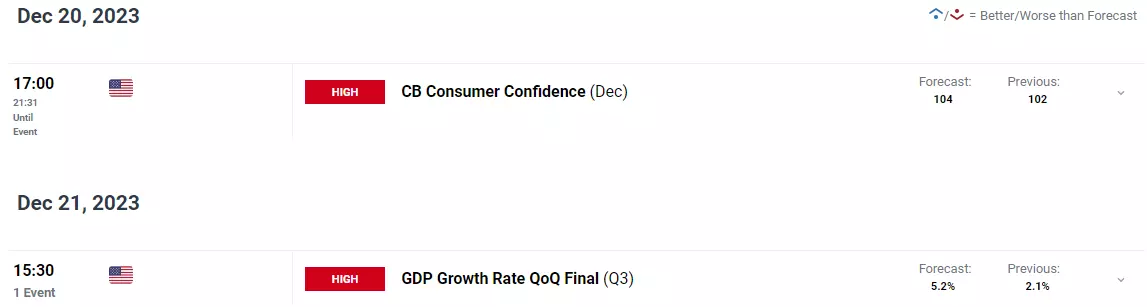
US data ahead
US data lies ahead with a key print being the US PCE data, which is due on Friday. This may have a significant impact on US rate expectations before the year is out, while we also have the final Q3 GDP number.
There is other "high impact" US data due with CB consumer confidence and the final Michigan Consumer Sentiment number, which should not have a material impact but rather short-term moves that could be erased toward the end of the trading session.
Economic calendar
 Source: DailyFX
Gold technical analysis
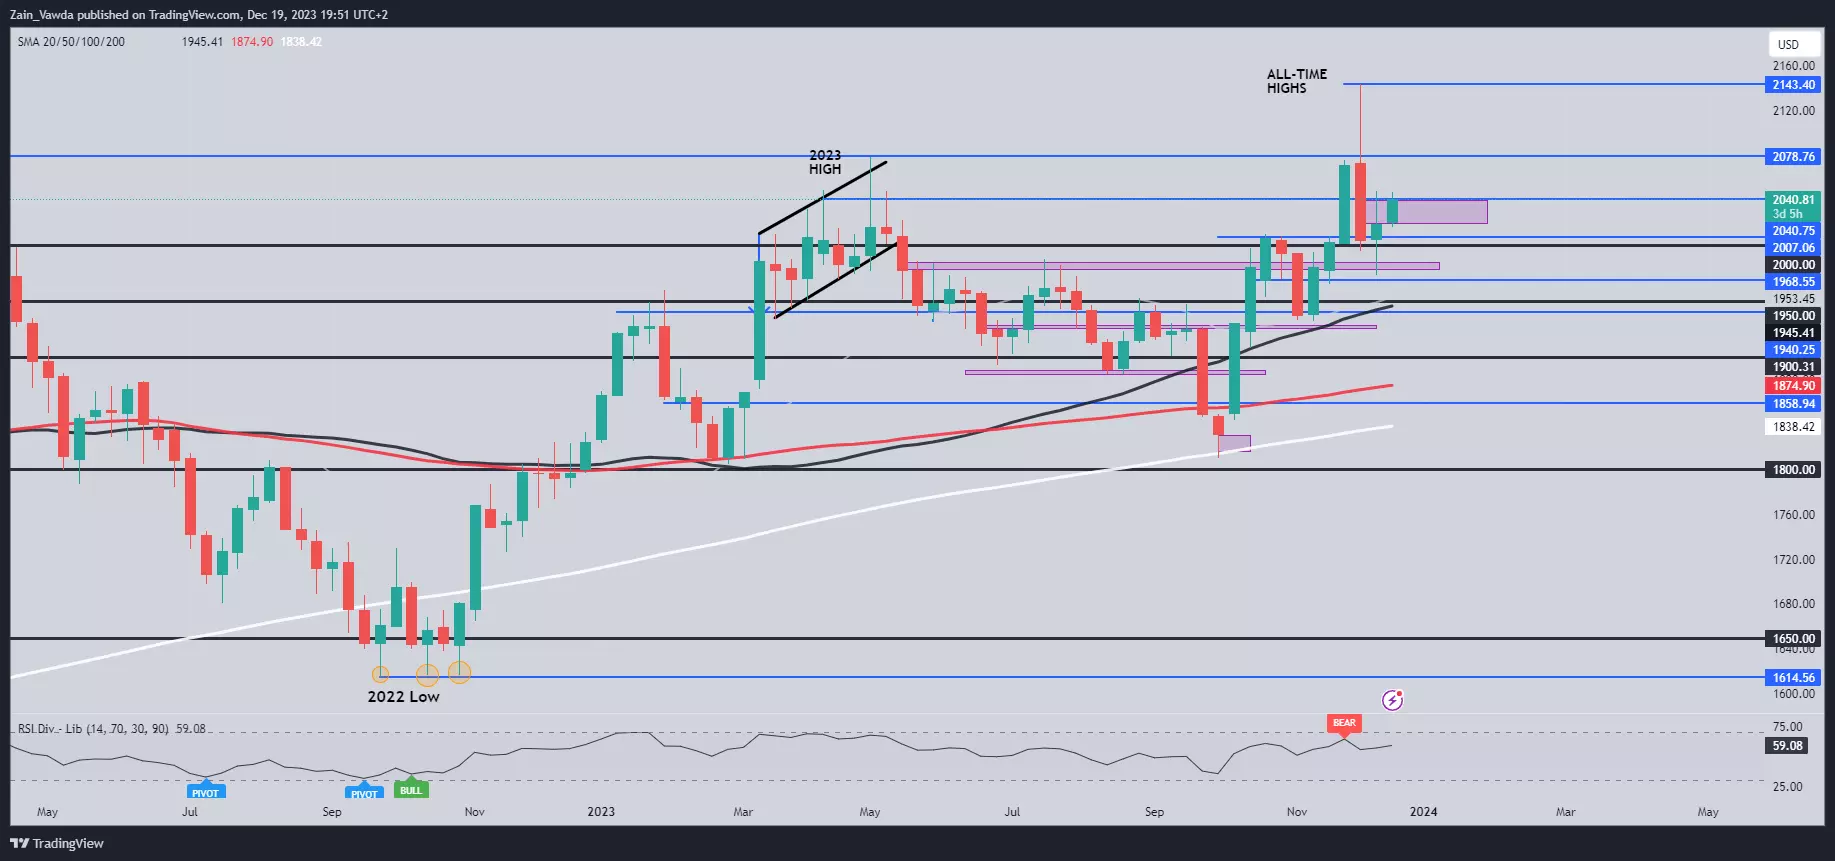
Form a technical perspective, gold is interesting following the recent selloff which stopped last week as gold printed an indecisive candle close. This should have given us a sign that we may get further upside this week which has come to fruition but further upside in my opinion appears limited.
As things stand, a daily candle close above the $2040 mark this could facilitate a run toward resistance at the $2050 mark and beyond with the fundamental picture supporting this narrative. However, I have a feeling that a retracement may come into play soon with a host of resistance area between the $2050 and $2078 handles which may prove to be a hurdle to far.
Key levels to keep an eye on:
Resistance levels:
- 2047.00
- 2058.00
- 2078.00
Support levels:
- 2030.00
- 2012.00
- 2000.00
Gold daily chart
 Source: TradingView
This information has been prepared by DailyFX, the partner site of IG offering leading forex news and analysis. In addition to the disclaimer below, the material on this page does not contain a record of our trading prices, or an offer of, or solicitation for, a transaction in any financial instrument. IG accepts no responsibility for any use that may be made of these comments and for any consequences that result. No representation or warranty is given as to the accuracy or completeness of this information. Consequently any person acting on it does so entirely at their own risk. Any research provided does not have regard to the specific investment objectives, financial situation and needs of any specific person who may receive it. It has not been prepared in accordance with legal requirements designed to promote the independence of investment research and as such is considered to be a marketing communication. Although we are not specifically constrained from dealing ahead of our recommendations we do not seek to take advantage of them before they are provided to our clients.
-
1
-
US stocks recorded fresh all-time highs yesterday, thanks to more gains for the Dow and Nasdaq 100, following on from dovish comments from the Richmond Fed president who said that the US was making good progress on inflation. The People's Bank of China left rates unchanged, though more easing is expected in the new year. The Nikkei 225 extended its gains and the yen lost more ground against the dollar, as the after-effects of the Bank of Japan meeting continued to make themselves felt. To cap all this, UK inflation came in below forecasts, rising only 3.9% over the year, and falling 0.1% on a monthly basis. Markets continue to price in expectations of Fed rate cuts in 2024, with March viewed as a high-probability event for an easing of US interest rates.

-
While the Hang Seng came under further pressure thanks to property and tech stocks, the Nikkei 225 was given fresh life by the Bank of Japan's decision to stick to ultra-loose monetary policy. The bank made no major changes, which resulted in a weakening of the yen after its recent strong run against the US dollar. The last big event of 2023 is now behind markets, but for now there is little sign of any real slowdown in the rally in risk assets. News that more shipping companies would avoid the Red Sea boosted oil prices, and could lead to problems in global supply chains, but the announcement of a US-led taskforce in the region to deal with attacks has limited the impact of the news.

-
Despite challenges, the AUD/USD rebounded from a dovish RBA decision, propelled by the Fed's stance on 2024 rate cuts.
 Source: Bloomberg
This time last week, the AUD/USD was in the doldrums due to a dovish RBA on-hold decision, a sub-par Australian Q3 GDP report, and a strong US jobs report which conspired to see it fall from a nineteen-week high.
The gloom lifted later in the week as the Fed rode to the rescue, validating expectations of rate cuts in 2024, sending the US dollar into a tailspin, and encouraging a new round of risk-seeking flows that supported the AUD/USD. The rebound leaves the AUD/USD just 100 pips below where it finished in 2022 at .6816, suddenly within touching distance of finishing 2023 in the green.
However, before it can cross that bridge, it must first withstand the minutes from the RBA’s board meeting in December.
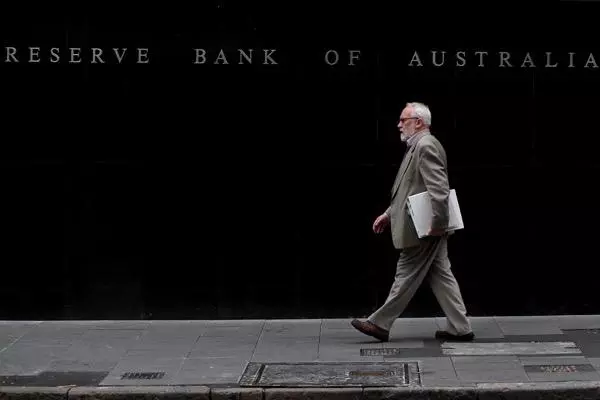
RBA meeting minutes (Tuesday, December 19th at 11.30 am AEDT)
The minutes from the Reserve Banks meeting in November are scheduled to be released Tuesday, December 19th at 11.30 am.
At its meeting in November, the RBA kept its official cash rate on hold at 4.35%, supported by a string of cooler-than-expected data across house prices, retail sales, and inflation. The RBA retained a tightening bias, using the same watered-down wording in the November statement:
"Whether further tightening of monetary policy is required to ensure that inflation returns to target in a reasonable timeframe will depend upon the data and the evolving assessment of risks."
The board meeting minutes will be closely scrutinised around what options the board considered at the meeting, the factors that would prompt the RBA to act on its tightening bias in 2024, including stubborn inflation and a tight labour market, and search for any clues that might suggest the RBA feels its tightening cycle is close to completion.
RBA cash rate chart
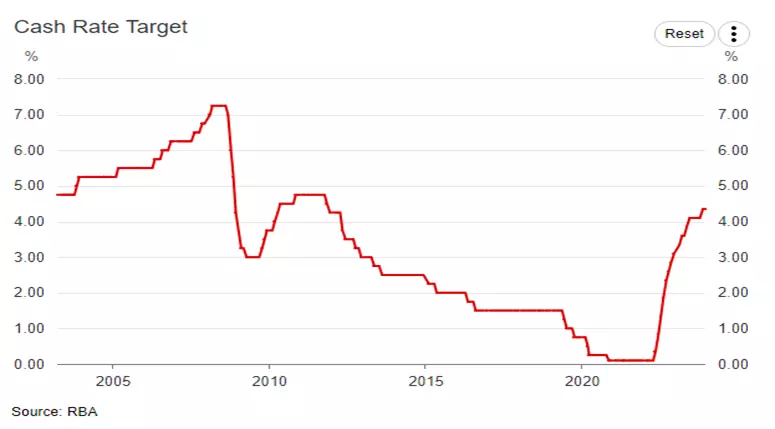 Source: RBA
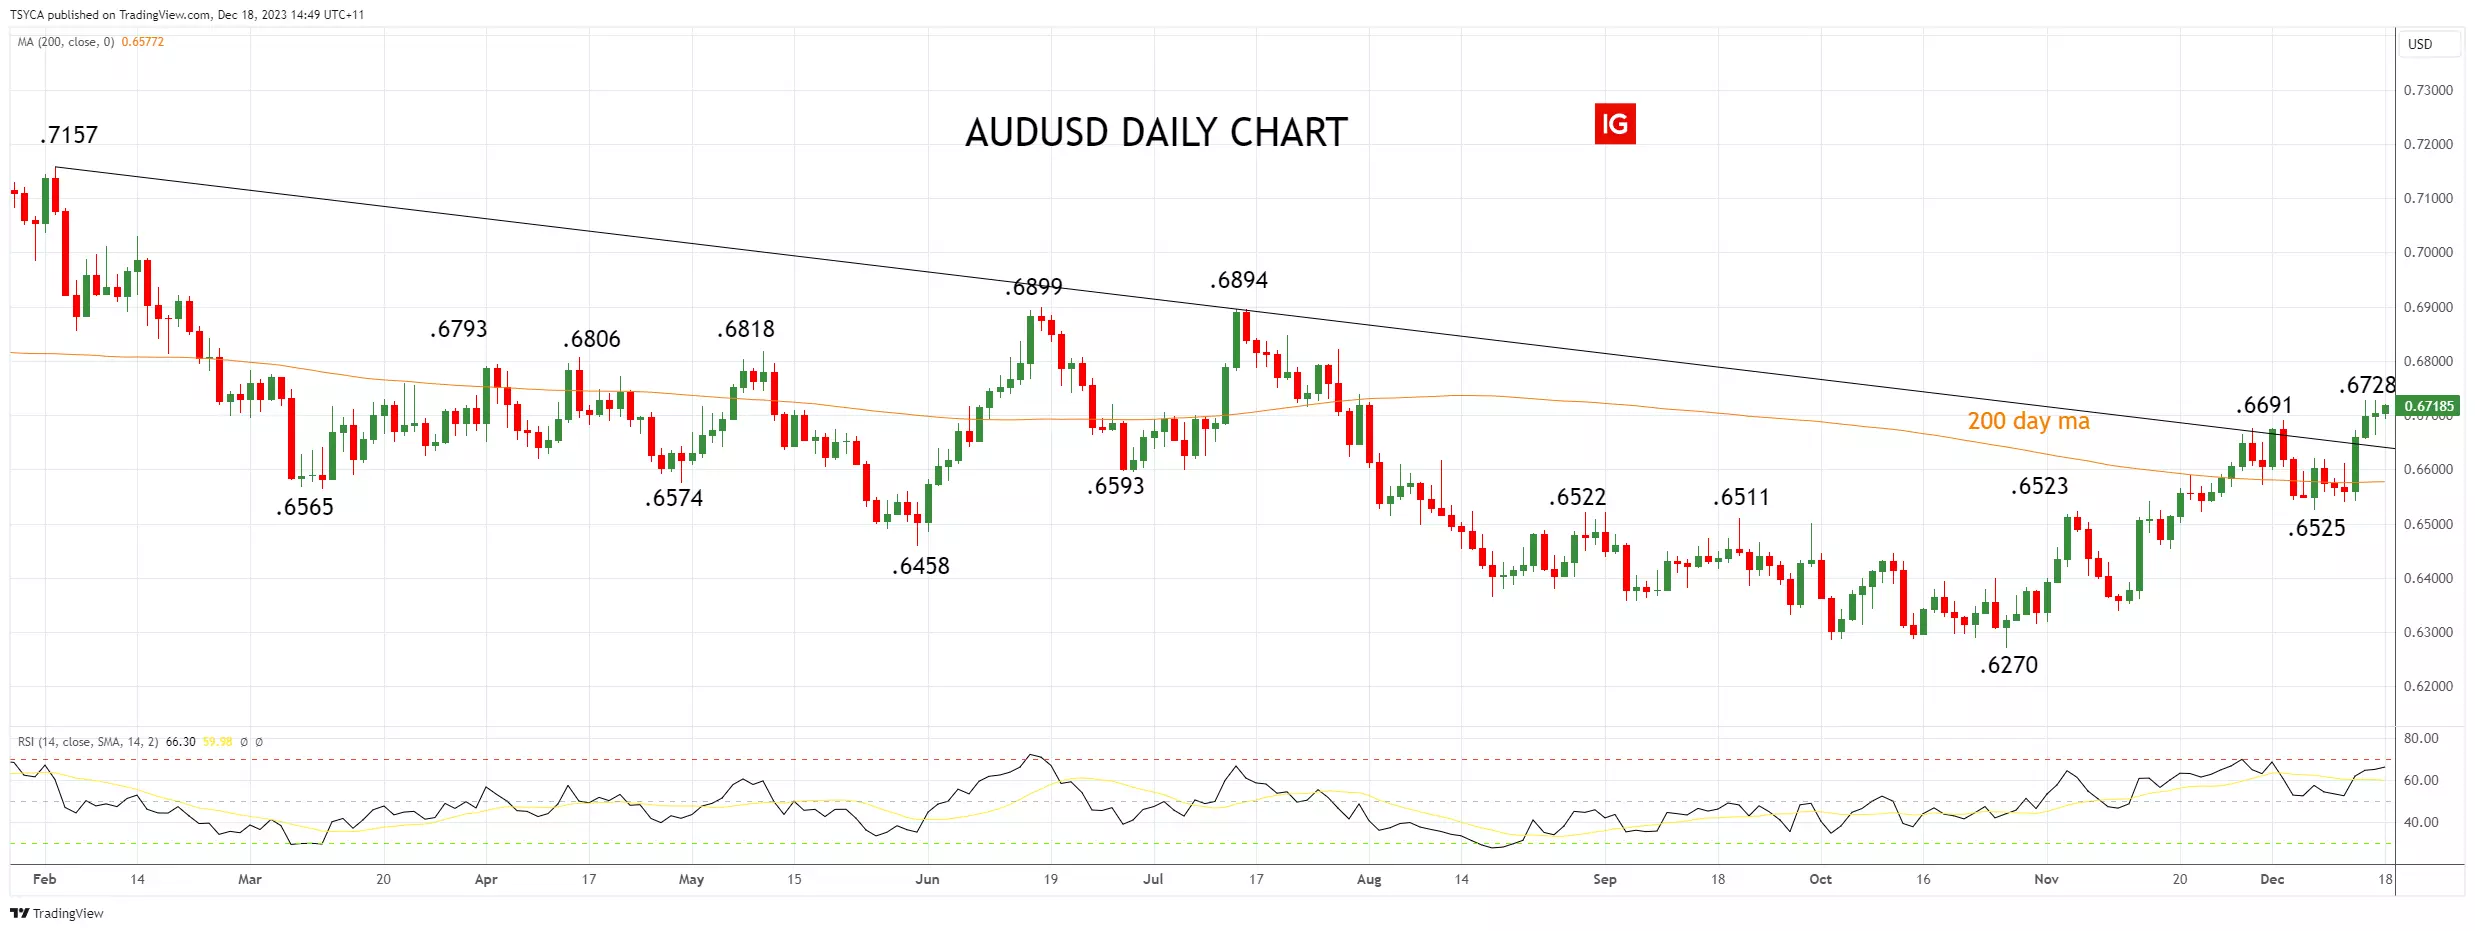
AUD/USD Technical analysis
Following last Thursday's dovish FOMC meeting, the AUD/USD springboarded from ahead of support at .6535/25, above the 200-day moving average at .6577 and downtrend resistance at .6650 from the February .7157 high.
While the AUD/USD holds above the three support points noted above, the AUD/USD could extend its rally towards the next layer of resistance at .6800/30, coming from highs between April and May of this year. Above here, resistance at .6900c comes from highs in June and July.
AUD/USD daily chart
 Source: TradingView
- Source TradingView. The figures stated are as of 18 December 2023. Past performance is not a reliable indicator of future performance. This report does not contain and is not to be taken as containing any financial product advice or financial product recommendation.
This information has been prepared by IG, a trading name of IG Australia Pty Ltd. In addition to the disclaimer below, the material on this page does not contain a record of our trading prices, or an offer of, or solicitation for, a transaction in any financial instrument. IG accepts no responsibility for any use that may be made of these comments and for any consequences that result. No representation or warranty is given as to the accuracy or completeness of this information. Consequently any person acting on it does so entirely at their own risk. Any research provided does not have regard to the specific investment objectives, financial situation and needs of any specific person who may receive it. It has not been prepared in accordance with legal requirements designed to promote the independence of investment research and as such is considered to be a marketing communication. Although we are not specifically constrained from dealing ahead of our recommendations we do not seek to take advantage of them before they are provided to our clients.
-
Markets are beginning to wind down for the year, though tomorrow's Bank of Japan meeting provides one last real hurdle for traders to navigate. Asian stocks were generally lower, with the Hang Seng leading the fallers. South Korean stocks were slightly pressured by news that North Korea had fired two ballistic missiles, including a long-range missile. The German IFO index is the only major piece of data on the calendar for the day. A weaker open is expected in Europe, but US futures are currently pointing to a positive start.

-
Dow, Nasdaq 100 and CAC40 all make strong gains
The dovish tone of last night’s Fed meeting has lit a fire under indices, driving the Dow above 37,000 to a new record high and pushing the Nasdaq 100 and CAC40 higher too.
 Source: Bloomberg
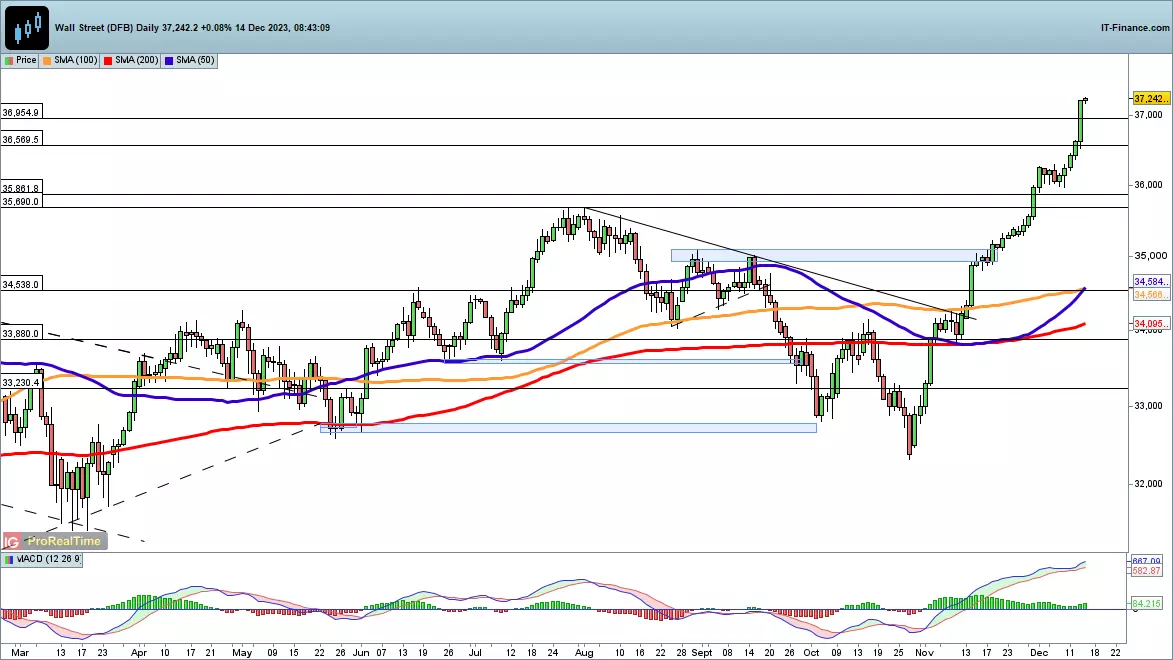
Dow surges through 37,000
The index shot to a record high last night, closing above 37,000 for the first time in its history. The dovish tone of the FOMC press conference provided fuel for the rally, capping a remarkable period for the index since late October. Momentum is a powerful force in markets, as we have seen since late October, and so while the price looks overextended in the short-term, we could see further gains as positive seasonality kicks in. A pullback might begin with a reversal below the previous highs at 36,954, and could then head back towards the summer highs around 35,690, but at present bearish momentum has yet to show its hand.
 Source: ProRealTime
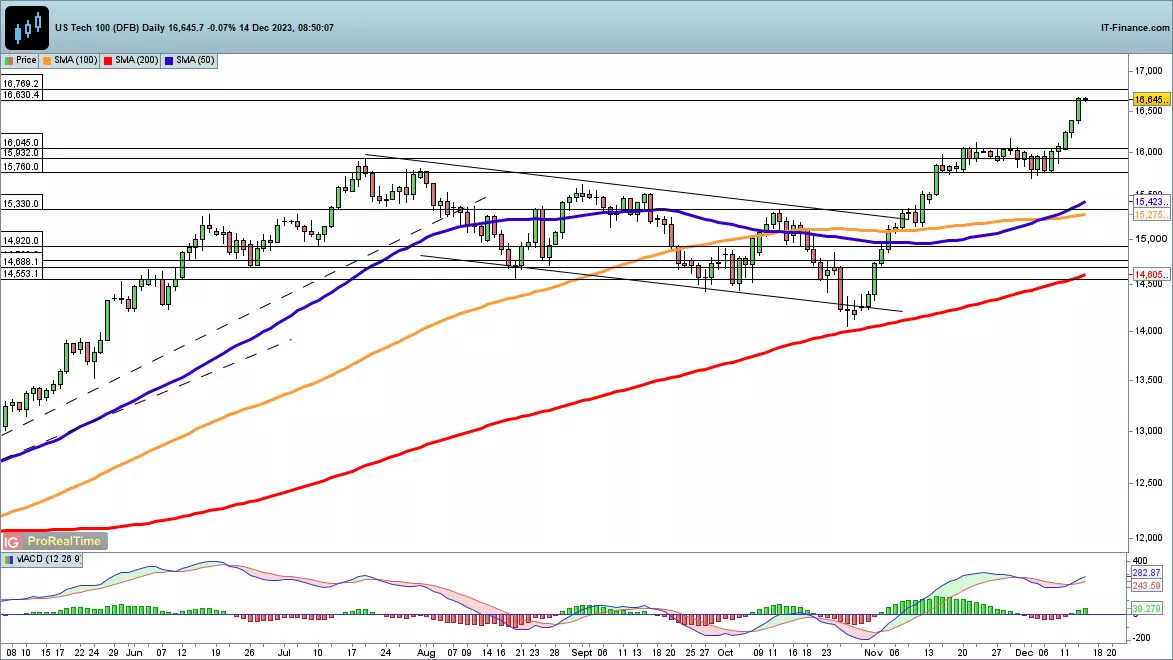
Nasdaq 100 targeting previous peak
For once the Nasdaq 100 is not the one leading the charge to new highs, but it has still enjoyed an impressive bounce over the past two months. It is now targeting the record highs at 16,769, with a move above this taking it into uncharted territory. As with the Dow, the index looks overstretched in the short-term, but there is little sign of a move lower at present. Some initial weakness might target 16,000, or down to the 50-day SMA (currently 15,423).
 Source: ProRealTime
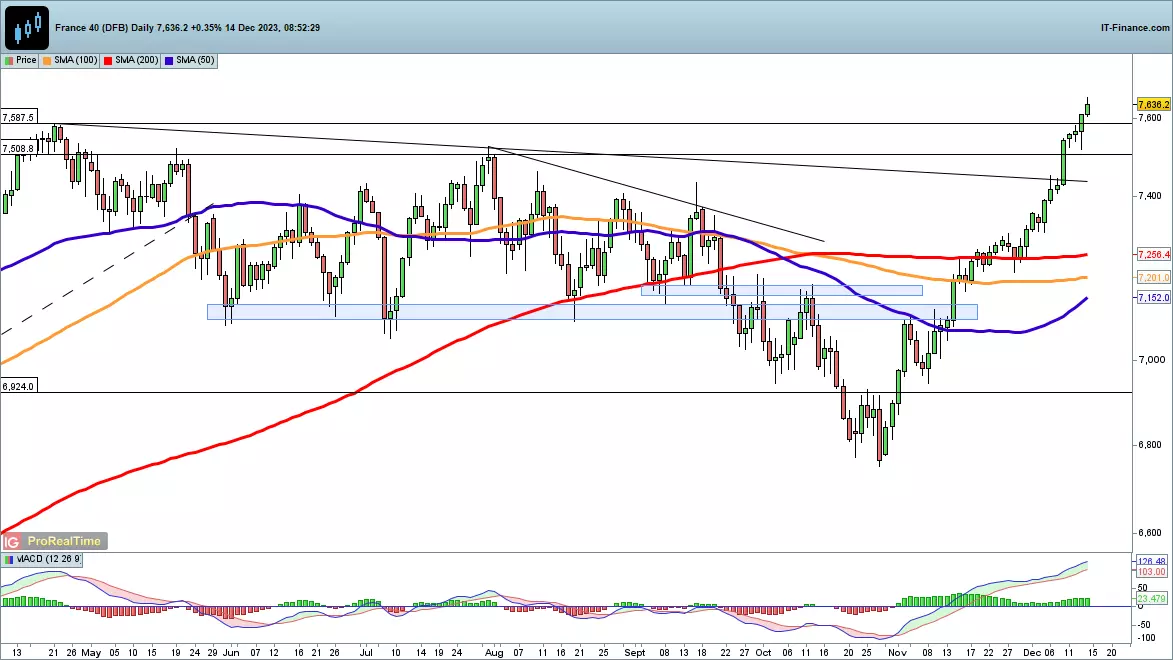
CAC40 hits new record
This index is pushing to new highs too, having cleared trendline resistance last week. The buyers have seized control over the past week, with any intraday weakness being seized upon as a buying opportunity. In the event of a pullback, the 7587 and then 7525 July highs would be the initial areas to watch for support.
 Source: ProRealTime
-
A record high on the Dow Industrials, a pull-back in the dollar, and US 10-year treasury yields down at levels not seen since July this year are all from a dovish Fed.
The commentary from Fed chairman Jerome Powell underscored the possible outlook for 2024 with rates expected by some to now start falling in the first half of the year.
(Video Transcription)
The Federal reserve
So it's all markets now fully expecting the Fed to cut interest rate next year. The green light certainly appears to have been switched on by the Fed. And 2024 certainly seems like the time when we could well see a reversal in some of these trends we've seen in some of the big central banks. It was certainly the case in the US yesterday where the Fed signaled it could start cutting interest rates next year if inflation continues to fall. It told the markets that the strong growth it wanted appears to be moderating. The labor markets coming back into balance, seeing inflation making real progress, according to Jay Powell telling reporters yesterday, these are the things we've been wanting to see. He said declaring victory would be premature.
But of course, the question is when would it become appropriate to begin dialing back in to some of the record high interest rates that we've seen in the Fed. It's between five and a quarter and five and a half percent in a forecast released by the Federal Reserve on Wednesday showed most policymakers expect lower key interest rates in 2024 after raising it to a 22 year high. So the Fed kept that target rate unchanged at between five and a quarter and 5.5%.
Now, Powell's comments rippled right the way throughout the markets. I want to begin first with taking a look at what's been happening of the dollar, because the dollar has risen to sort of pull back the dollar basket. Big declines yesterday, generating record highs on the Dow and gains across all of Wall Street yesterday. This is the effect on the currency markets pulling back below the 200 day moving average and indeed into the spike lower today. Trading at one point intraday in today's session at the low not seen since 11th of August this year. In amongst some of the other big market moves. Just a quick update on where we are in terms of some of the big moves including Japanese yen stronger against that US dollar the dollar pulling back to levels there at one point in today's intraday trade not seen since the 28th of July.
The US dollar
Now this pullback in the USD has meant that we've got money going into a lot of the dollar denominated commodities. Look at copper up about the 200 day moving average a big spike up in the session in today's trade. It's not just copper, it's also other areas. The market zinc up over 1% as well. Aluminum, another one where we've seen gains in today's session as a result of that pullback in the dollar.
And what this pullback in the dollar is also doing, it's hoping, traders are hoping that this will indicate that the potentially has the possibility of seeing some extra demand coming through in the market as well. Also, watch out as well in the London markets for some of the big mining companies. This is BHP gaining on the session in today's trading.
The Australian markets
The Australian markets up by a margin of almost 1%. It wasn't just that as well, it was things like Rio Tinto, another one where we've seen gains today. At one point Rio Tinto had closed this gap here that we heard back on the 5th of August 2021 to levels they're not seen since the beginning of August that year. So you can see that we've got a lot of money going into some of these base metals and it doesn't stop there either because we look at what's happening with some of the precious metals, big gains as well yesterday, the silver and we're building on that in today's session after the highs that we've seen that big pullbacks in recent because of concerns about the fact it was overdone but none of it. We've seen money continuing to go back into these markets. Spot gold, another one up above the 2000 level by some margin, 2030 as the markets bounce off this, 76.4% retracement.
Crude oil
And also what you what's happening with the price of oil, again, going back to what we've had in terms of some of the moves on expectations that we've got potentially extra demand coming through at one point yesterday that we saw a new six month low for the price of crude oil. This also coincided as well with the EIA crude oil inventory yesterday, talking about the fact that they've got this market, which is seeing some of the extra supplies being eaten up in the market. But oil on those not too far away from the recent lows, but nonetheless, oil benefiting from this swing lower in the US dollar on the back of that Fed interest rate decision.
This information has been prepared by IG, a trading name of IG Markets Limited. In addition to the disclaimer below, the material on this page does not contain a record of our trading prices, or an offer of, or solicitation for, a transaction in any financial instrument. IG accepts no responsibility for any use that may be made of these comments and for any consequences that result. No representation or warranty is given as to the accuracy or completeness of this information. Consequently any person acting on it does so entirely at their own risk. Any research provided does not have regard to the specific investment objectives, financial situation and needs of any specific person who may receive it. It has not been prepared in accordance with legal requirements designed to promote the independence of investment research and as such is considered to be a marketing communication. Although we are not specifically constrained from dealing ahead of our recommendations we do not seek to take advantage of them before they are provided to our clients. See full non-independent research disclaimer and quarterly summary.
-
Gold, silver rally on falling US dollar while US natural gas hits six-month low
Outlook on gold, silver and US natural gas amid a weakening US dollar.
 Source: Bloomberg
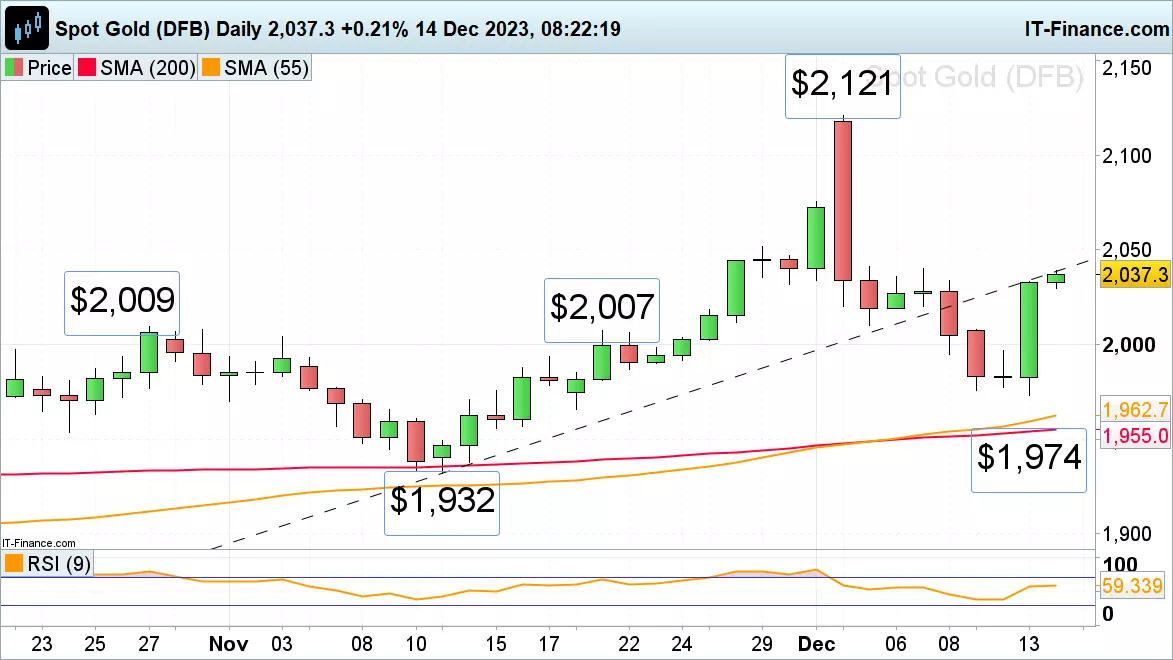
Gold shoots back up to $2,039 on dovish Fed
Spot gold rallied from this week’s low at $1,974 per troy ounce to $2,039 where the breached October-to-December uptrend line, now because of inverse polarity a resistance line, acts as short-term resistance, together with the 7 December high at $2,040. If overcome, the $2,050 zone would be next in line, ahead of the 2020, 2022 and May 2023 highs at $2,070 to $2,082. The December 5 low at $2,010, together with the late October high and the 21 November high at $2,009 to $2,007 should offer support.
 Source: ProRealTime
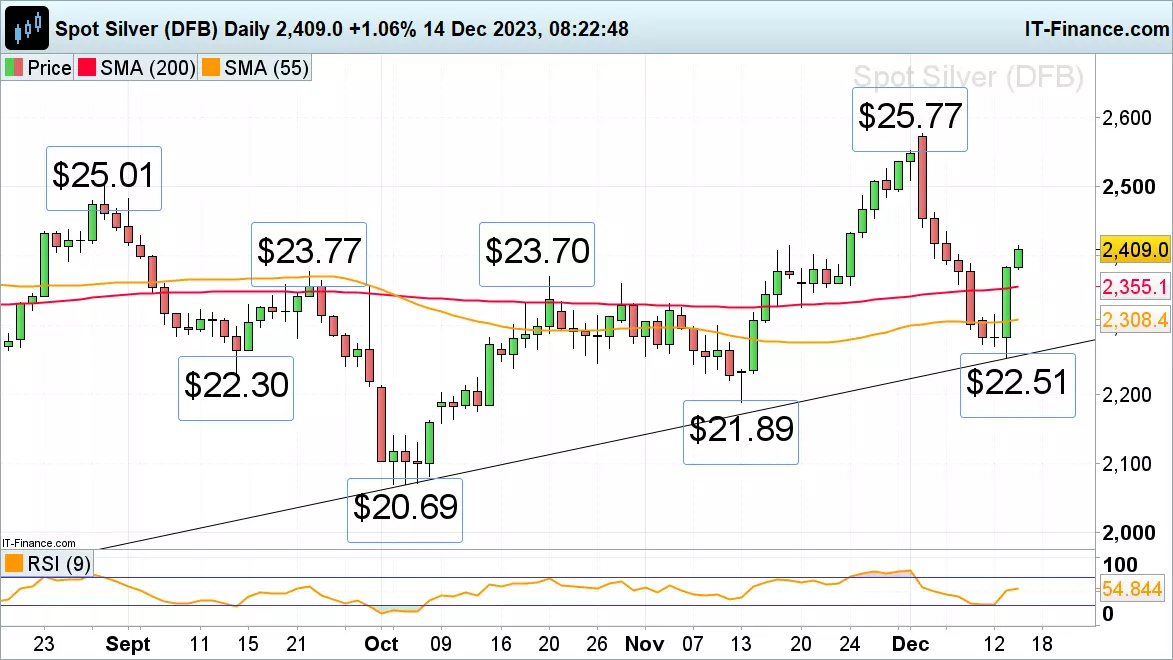
Silver swiftly reverses its descent
Spot silver’s decline from its current December peak at $25.77 per troy ounce, a near seven-month high, has been followed by a rapid drop to Wednesday’s $22.51 low. From there another swift rally is currently taking place on the back of a dovish Fed and falling US dollar. Now that the 22 September and 20 October highs at $23.70 to $23.77 have been overcome, the August peak at $25.01 is back in sight. Support below $23.77 to $23.70 is seen along the 200-day simple moving average (SMA) at $23.55.
 Source: ProRealTime
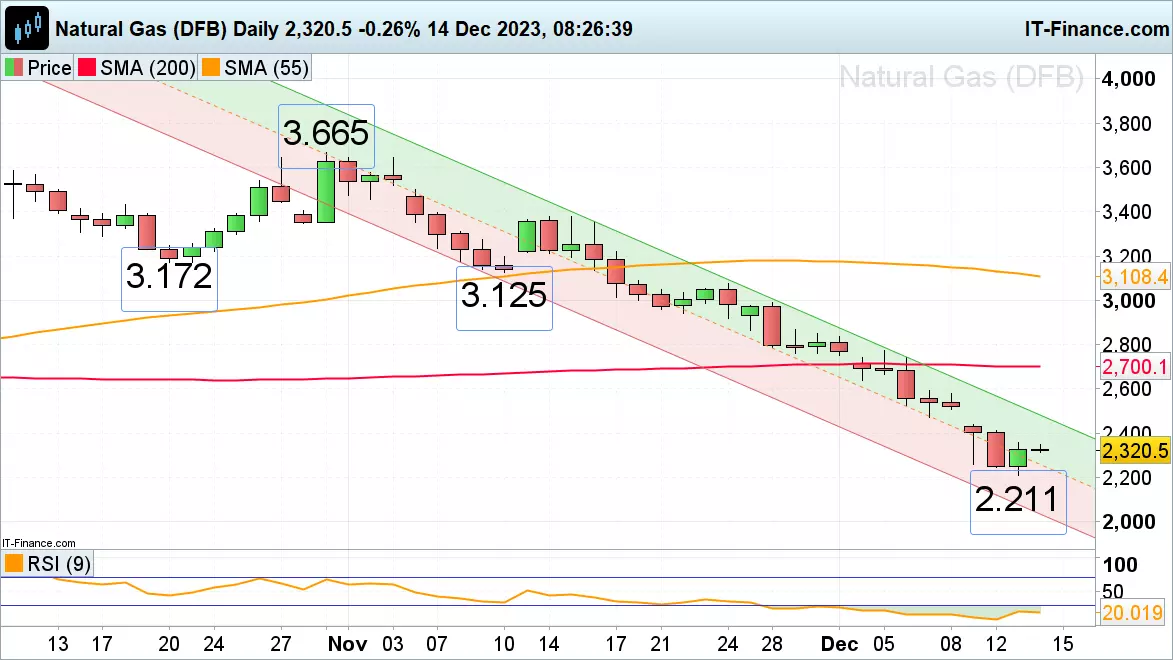
US natural gas futures prices try to hold above six-month low
US natural gas futures descent from their ten-month high at 3.665 in late October has taken these to a six-month low at 2.211 on Wednesday before recovering slightly amid a weakening US dollar. Good resistance can be spotted between the downtrend channel resistance line and this week’s price gap at 2.438 to 2.508. Were this week’s low at 2.211 to give way, the April-to-June lows at 2.158 to 2.063 would be in focus.
 Source: ProRealTime
-
Gold prices eyeing for a move back to retest key resistance
After failing to sustain a breakout above the US$2,074 level back on 4 December 2023, the yellow metal has found new signs of life overnight, with the green light on the rate-cuts narrative from the Fed. The overnight upmove has pared all of this week’s losses, with prices seemingly setting its sight for another retest of the US$2,074 level of resistance, which marked a crucial overhead resistance on multiple previous occasions (May 2023, March 2022 and August 2020).
For now, the broader upward trend remains intact, with prices trading after its Ichimoku cloud zone on the daily chart after an upward break in October 2023, alongside various MAs. A successful move above the US$2,074 level may pave the way towards the all-time high at the US$2,146 level next. On the downside, the daily Ichimoku cloud zone will serve as an area of support for buyers to defend.
-
1
-
-
-
On 12/12/2023 at 19:00, BillionaireFXTrader said:
What do you guys think will happen if the fed cuts rates?
-
The US dollar weakens across the board as the Fed signals numerous rate cuts for next year. The dovish policy outlook from FOMC is causing treasury yields to tumble. What is the technical outlook for EUR/USD, USD/JPY, and GBP/USD?
 Source: Bloomberg
The US dollar, as measured by the DXY index, plummeted nearly 0.9% on Wednesday, dragged lower by the massive plunge in US treasury rates after the Federal Reserve’s guidance surprised on the dovish side, catching investors, who were anticipating a different outcome, off guard and on the wrong side of the trade.
For context, the US central bank today concluded its last meeting of the year. Although policymakers kept borrowing costs unchanged at multi-decade highs, they gave the first signs of an impending strategy pivot by embracing a more benevolent characterization of inflation and admitting that talk of rate cuts has begun.
Fed's economic projections: accelerating policy shift and market impact
The Fed’s summary of economic projection reinforced the view that a policy shift is on the horizon, with the dot plot showing 75 basis points of easing next year, far more than contemplated in September. While Wall Street’s rate-cut wagers have been extreme, the Fed's forecasts are slowly converging toward the market's outlook – this should be bearish for the greenback and yields moving into 2024.
With the broader US dollar in a tailspin, EUR/USD soared towards the 1.0900 handle while GBP/USD jumped past an important ceiling near 1.2600. Meanwhile, USD/JPY nosedived, rapidly falling towards its 200-day simple moving average – the last line of defense against a larger retreat.
EUR/USD technical analysis
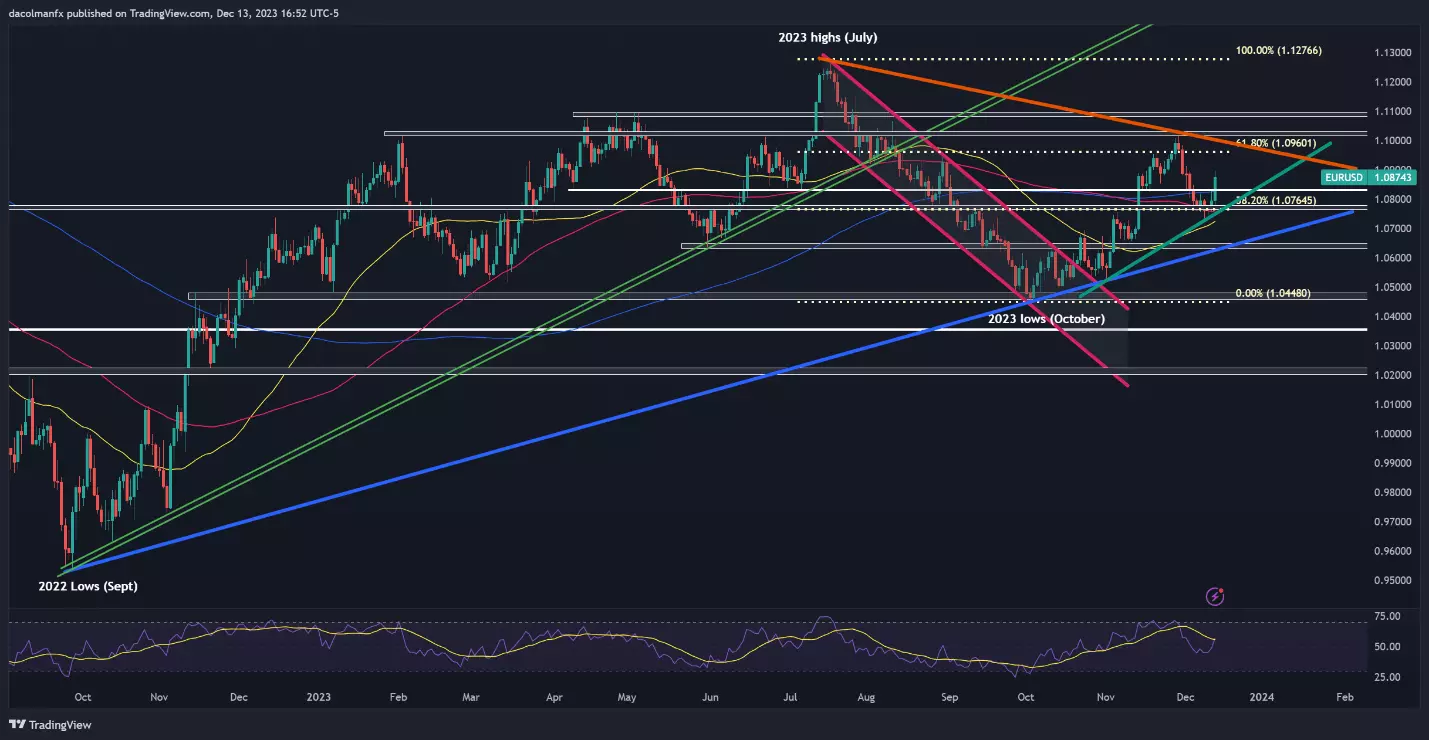
EUR/USD jumped on Wednesday, clearing technical resistance near 1.0830, corresponding to the 200-day simple moving average. If this bullish move is sustained in the coming days, the upside momentum could accelerate, setting the stage for a rally towards 1.0960, the 61.8% Fib retracement of the July/October decline. On further strength, attention would shift towards 1.1015, last month's high.
On the other hand, if the upward impetus fades and prices resume their descent, the first support to monitor is located at 1.0830, but further losses could be in store for the pair on a push below this threshold, with the next area of interest at 1.0765. Continued weakness might draw focus towards trendline support, currently traversing the 1.0640 region.EUR/USD technical chart
 Source: TradingView
USD/JPY technical analysis
USD/JPY saw an upward push earlier this week, but this ascent hit an abrupt halt on Wednesday when the Fed triggered a massive US dollar selloff. This drove the pair sharply lower, sending the exchange rate towards its 200-day SMA, the next major floor to watch. Bulls will need to staunchly defend this floor; failure to do so could spark a drop towards 141.70 and 140.70 thereafter.
Conversely, if USD/JPY resumes its rebound, technical resistance looms at 144.50. Buyers may have a difficult time breaching this barrier, but if they manage to drive prices above this ceiling, we could see a rally towards the 146.00 handle. On further strength, all eyes will be on 147.20.USD/JPY technical chart
 Source: TradingView
GBP/USD technical analysis
GBP/USD climbed and pushed past resistance at 1.2590 on Wednesday after bouncing off trendline support near 1.2500, with the advance reinforced by the broader US dollar downturn. If the pair manages to hold onto recent gains and consolidates to the upside little by little, we could soon see a retest of 1.2720 level, the 61.8% Fib of the July/October retracement. Further up, all eyes will be on 1.2800.
On the other hand, if sellers return and trigger a bearish reversal, initial support appears at 1.2590, followed by 1.2500, near the 200-day simple moving average. Looking lower, the focus turns to 1.2455. Cable is likely to stabilize in this region on a pullback before mounting a possible comeback, but in the event of a breakdown, a move down to 1.2340 becomes a plausible scenario.
GBP/USD technical chart
 Source: TradingView
This information has been prepared by IG, a trading name of IG Australia Pty Ltd. In addition to the disclaimer below, the material on this page does not contain a record of our trading prices, or an offer of, or solicitation for, a transaction in any financial instrument. IG accepts no responsibility for any use that may be made of these comments and for any consequences that result. No representation or warranty is given as to the accuracy or completeness of this information. Consequently any person acting on it does so entirely at their own risk. Any research provided does not have regard to the specific investment objectives, financial situation and needs of any specific person who may receive it. It has not been prepared in accordance with legal requirements designed to promote the independence of investment research and as such is considered to be a marketing communication. Although we are not specifically constrained from dealing ahead of our recommendations we do not seek to take advantage of them before they are provided to our clients.


IG Morning Call
in General Trading Strategy Discussion
Posted
Friday's post-NFP rebound for US markets failed to translate into a broader rally in Asia overnight, with the Hang Seng slumping once more. Investors have been noticeably reticent about pushing stocks higher after the strong gains of Q4, and this week's inflation data from around the globe, most notably the US, China and Japan, combined with the start of earnings season, means that risk appetite may well remain muted for the time being. While the calendar for the day is sparse, it will be worth watching the Dow this afternoon, to see how Boeing stock fares following the incident with a 737 aircraft over the weekend. Boeing stock has a 4.3% weighting in the Dow.