

THT
-
Posts
522 -
Joined
-
Last visited
-
Days Won
54
Content Type
Profiles
Forums
Blogs
Events
Community Tutorials
Store
Everything posted by THT
-
Right that's me for the summer, I'll update and finish the Market Education page but other than that I'll be back in September, so any comments/messages etc are unlikely to be looked at until then. You should have worked out that it is perfectly possible to be able to forecast the markets short-term direction by us of Indicators when used the right way - whether you make money is up to you As you can see from the mid-week update - the expected pullback was not much, this was then followed by a buy signal


-
Nasdaq100 Broken Feb high Double top or Higher?

-

Share Trading Vs Share ISA
THT replied to BASA's topic in Investments, share dealing, and Smart Portfolios
If you buys via the normal share dealing route then any gains are subject to capital gains tax - this tax year you can make gains of £12,300 the rest is subject to taxation at varying rates depending on your tax status - 10% for a basic rate tax payer and 20% for high rate tax status etc - see https://www.gov.uk/browse/tax/capital-gains You can buy the SAME shares and ETF's within an ISA - its exactly the same as share dealing but you don't pay capital gains 0 its a tax-free wrapper for investments Your first port of call should be an ISA, then one for your spouse if you have one, then share dealing - Then every year use the share dealing account to fund new ISA(s) contributions I haven't bought a share or ETF outside of my ISA for the past 10 years - doesn;t make sense tax wise -
Right - so we've got the KEYS to SUCCESS nailed down in the previous posts - If you set the right money management, risk and applied those strict rules then you could trade a simple coin toss - I remember testing this method back in 2012, the rules were: Every Full or New Moon (YES!) I would toss a coin and go long if heads came up and short if tails did I used a % of ATR (Average True Range) for the stop and a preset target of 3 times risk (3R) The system either worked or it didn't You couldn't live of the off the system, BUT it did have a positive expectancy and ended the year in profit A good idea is having this experiment on a chart for a year just to see how a simple toss of a coin (50% probability) can work in the markets Before I show you a couple of simple trading methods, I just want to explain a couple of things about the markets There's ONLY 3 things a price bar can do - go UP, DOWN or end the period neutral Markets display mathematical points of force at the major turning points - I just cannot believe that people with a Scientific or Engineering background don't dominate this industry - My swing file is just but a simple VECTOR! So How do you view the markets? UP, DOWN, SIDEWAYS? You're FORCED to - all you can view a price chart on is a 2 Dimensional chart - which shows price action moving in a UP/DOWN or SIDEWAYS fashion When I understood this - things for me fell into place ( you might not be able to see it) - what if price action is actually 3 Dimensional and forced onto a 2D viewing platform - it explains why things aren't linear and exact Take the big weekly chart of the FTSE100 Index in the charts above - Imagine that from 2000-2003 and 2007-2009 price was coming towards you and from 2003-2007 price was moving away Look at the chart below - TRIANGLES show up often - Anyone with a high school education (debatable for some people though!) knows that Triangles are the building blocks of geometric platonic solid structures Price reaches the bottom and then reverses - If we could "twist" our view of the action, we would see it clearer Notice the Triangles, there are NOT square on to our view, they are twisted - this is what causes uneven/unequal time between lows I'll leave this for your own research if Interested - but it is perfectly possible to trade highly successfully without knowing this - but it does help to explain those times when your stop is just hit and then prices reverse as you intended! Bonus Trade example: The chart below is a zoomed in view of the chart immediately above, as it shows a highly profitable trading chart formation - the chart is the WEEKLY chart of the FTSE100 Index Guess What? As per WD Gann - this method came from the 1930's / 1940's period! All details are on the chart - This trade worked straight away, for the RR even at the 1 app target I'd of been prepared to be stopped out 5 times for those sorts of returns Load of old Bull????? Here's the DAILY FTSE100 Chart from 2010, showing similar formation, but the ratios are slightly different because of the 3D nature on a 2D chart - again this one would have offered you a min of 8R return: In the next post I'll show you a couple of other high probability trading methods (basic skill level trades), which will complete this THT Market Education (I've only skimmed the surface there's lots more methods and techniques that work in the markets - but the key thing is the EXPECTANCY and RISK aspects) Wishing you well on your trading journey


-
I was yep
-
Again another great call by THT
-
Do stops lead to fewer profitable trades?
THT replied to u0362565's topic in General Trading Strategy Discussion
Larry Connors did a study on this in the 90's (using stops or not) I use stops - I just add a point or 2 to cover spreads etc The markets are mathematical points of force, the laws of probability and probabilistic returns apply to trading - most people never get in sync with that hence the high failure rate Dr. Van Tharps book "Trade your way to financial freedom" details probability, statistical returns, win distribution and risk brilliantly. Hope it helps and good luck on your trading journey -
This was written 111 years ago - 99% of it still applies today - Ignore #1 Gann had a win rate of 90%+ he could afford to take huge gambles per trade and the fact could time the market. It's my belief that if you stick to theses rules you'll be virtually there as a trader, the only missing part is a method that works and produces returns W.D. GANN'S MOST IMPORTANT MONEY MANAGEMENT RULES * Divide your capital into 10 equal parts and never risk more than 1/10th of your capital on any one trade. This applies to all remaining capital as well. * Always use stop loss orders to protect your trade and place it immediately after entering a position. * Never overtrade by taking large positions. This would violate your capital rule. Remember " safety first." * Never let a profit run into a loss. When the market moves in your favor and you have a profit that is double the amount of risk you were willing to take, move your stop loss order so that you will have no loss of capital if hit. * When in doubt, stay out or get out. * Trade in active, liquid markets. * Don't close your trades without a good reason. Follow up the position with stop loss orders to protect your accumulating profits according to the rules. * Accumulate a surplus of capital. This rule is very important. After you have made a series of successful trades, put some money into a surplus account to be used only in emergency or in times of panic. * Never average a losing position. This is one of the worst mistakes a trader can make. * Never get out of the market just because you have lost patience or get into a market because you are anxious from waiting. * Avoid taking small profits and large losses. * Never cancel a stop loss order after you have placed it when entering a trade. * Avoid trading too frequently, getting in and out too often. * Be just as willing to sell short as you are to buy long. * Never change your position without a good reason based on set rules. * Avoid increasing your trading activity after a long period of success or a series of profitable trades.
-
Thought as much - Forums are full of idiots like you - which is why the TA is generic, I have absolutely no Interest in improving your bank balance - T"£$s like you are grabbers - stalking forums pretending to be the big I am's, whilst in the background trying to pinch other more successful traders ideas For crying out loud you seem to trading a MACD strategy - good luck with that one - might be one of the reasons you're not doing very well Before I started this post - people like you were in my mind - you've proved me right and I'm so glad that my TA hasn't helped you, because it was designed to do just that, to test the forum for jerks, without giving too much away
-
DMEDIN - Do you trade for a living? Because some of your other posts - I might get them and copy the text you've typed, suggests you're desperate to BE a trader, but can't quite get there If you're doing much better than me how come I trade for a living and you seem to not to? You have absolutely no idea what I've done this year - and how do you know that I'm showing on a public forum a great trading system? Muppets like you, are highly likely to nick it You really are pathetic -what an absolute ****
-
Possible Buy signal has flashed on the FTSE250 Index RSI has Ticked UP above 50% level - Bullish Obviously no trade is guaranteed, but everything about this says long trade is on Couple this to the Individual stocks that make up the FTSE250 Index and lots of them are flashing buys on my charts from todays price action - All I know is that as a trader another buy signal has been given in conjunction to the other buy signal that flashed 8 trading days ago

-
And when you take price action away the swings become even more clearer

-
OKAY - I'm assuming that you'll read those books, understand about expectancy, risk, position sizing etc as it's absolutely vitally Important - It's a massive reason that most people fail You need to treat trading as a BUSINESS, most people can't run a business either, so you have the double whammy of people failing to run a business properly, sticking to rules, techniques, trades when they show up (discipline basically) and a complete lack of understanding for risk and position sizing If you end up blowing up an account It's most likely going to be because you've ignored running your trading business as a business (discipline and/of following a plan of rules), position sizing, risk, trade management or the method your trading just does not work and has a negative EXPECTANCY! You now need to MASTER the charts - I'm a 100% chartist / Technical Analysis Trader - I do NOT look at economic activity, information or analysis - the chart reflects all that in past price data We will be basically "reading" a chart - It will be how I read the chart, that might differ from yours - there's multiple ways to read a chart - just remember, we're looking to be able to make money fast from it - we don't need to know why something happened Chart below is the WEEKLY Time Frame of the FTSE100 Index In this chart we're using an ultra simple method of defining the trend - It's NOT perfect though what about the times when UP transfers to DOWN, Isn't that hugely Important? Of course is it - Buying in a down trend isn't a profitable route to take for a short-term trader But for some this exceptionally simple and easy method could help them to see through the 'fog' Some Use Moving Averages and Indicators to confirm/determine trend (The MA's are: 10 Period Simple Moving Average of the H-L price bar, 21 Exponential Moving Average of the H-L (EMA), 55 EMA and 89 EMA) Whatever works for you the chart below is the same FTSE100 WEEKLY chart of a 10 period Simple Moving Average of the High-Low, projected 10 bars into the future No one method is perfect - You just HAVE to find out what suits you and you're style/personality Or you can show the swings of the market did you know that W.D. Gann waaaaaaaay back in 1909, 111 years agoooooo - wrote trading courses that showed swing trading with the swings I've shown above and in the chart below - 111 years ago! Psst! Shush - Don't tell anyone, but his methods still work today, in today's markets - Anyone using swings, swing highs and lows and 50% price retracement levels, are using the same methods he used over 100 years ago! Did I tell you just how much of a genius that man was? Some of my most treasured trading methods were borrowed from his works Now it is true Gann used Astrology in his analysis - I've never found that it has usable use in the markets - If I'm going to use some method then for me it has to massive out perform a coin toss and from the limited Astrology I've looked at it's not better than 50% Anyway we digress! What I use: Well I use a combination of things - I use the chart that shows the multiple MA's and the DTF Indicator and I use the swing chart above and the one below The swings in the charts below are determined by the software i use and they use market volatility and a special filter based on price action to move from up to down etc - There's nothing wrong with setting the Blue swing line at say 10% and the Red/Green swing file at say 5% - this means that once price has moved up or down 5% then it will change, so in the chart below we see the swing low point in March 2020, the swing line colour was Red, that switched to green once price had risen by X% and the Blue line in the chart above would have altered its up/down swing once price exceeds 10% For the Time being just focus on seeing their value as a trend line identifier (We'll look at swings later on as they have much much more use than just identifying trend direction) Now my charting software allows me to analyse all those individual swings too - So for any market I look at I can tell you the min-max and average swing size, BOTH the BLUE ones and the RED/GREEN ones - one use of this could be to identify the times of the year the biggest swings happen in, the day of the week with the biggest moves happen on, I could project a price rhythm zone on the chart to show me the price range the next swing up/down should conform to, I can do the same with TIME too - for a trader KNOWING the zone a low or high should arrive in can be exceptionally highly advantageous and guess what? - It throws the laws of probability massively into OUR favour Zoomed in view of the 2014 to present section of the chart above But typically I'm looking for a visual quick confirmation of Rising swing lows and rising swing highs for an UPTREND and lower swing lows and lower swing highs for a DOWNTREND go through the charts I've shown you and satisfy yourself of this fact, higher highs and lows etc Also as W.D. Gann said 111 years ago - When a reactionary swing is greater in BOTH Time and Price than the other reactionary swings in a trend then watch out for the trend to potentially change - its not 100% certain but its another good heads up When price action ventures into the range of the previous swing, then it muddies the water and that's when trading ranges can form Remember you can use whatever suits you to determine trend - I'm just showing you what I've found most useful - Remember "We're here to make money from the markets, and that MEANS being RIGHT" I mentioned swing file analysis - this the the SP500 Index swing file since 1962 - Used in the right way you can us the stats to trade from to your advantage! I have NOT tweaked the swings, I've just let the software select them, so there'll be a couple that you could refine to make the data more accurate - but for the purposes of this example, we don't need to - it's good enough as an example. All about having the right tools to trade with as you wouldn't expect your builder to build your house with a tea spoon and knife! As you can imagine it takes time to produce these posts so I won't be posting for a while - as you enough to digest for the time being Stay Safe!


-
It would help if I posted the DAILY chart - apologies Here it from Sat's analysis:

-
Not for me - had a fantastic four figure profit banked in 5 trading days
-
Trouble is when you sell courses or methods, you have to deal with the ignorance of stupidity of the public and especially traders desperate to succeed, but don;t have what it takes to make it - Which is exactly why I've no plans to get involved in that side - You could teach some idiots a method that makes 140% profit a year and they'd still find fault with it and say "It doesn't work"!! If you get trading right - you put all the advantage on your side, and you're exactly right, hence why I waited until I had sufficient reserves so that I didn't put the family at financial risk - common sense really No one makes money from the markets without betting on a preconceived idea of which direction it's going to move in and that is why everyone who takes a trade position is gambling - everyone
-
There's always 1! It is perfectly possible to make a living from trading off Daily charts, yes it helps massively with big cash reserves as the risk gets less and less to produce the same monetary amount - That's the point of doing it! I didn't have big cash reserves - and I quit being an adviser in 2010 as trading conflicted with advice I was able to give to customers and I was earning more from trading daily charts that I was as an IFA, so rather than working 12-16 hour days as a IFA, the smart decision was to quit and spend it with my family. When you start as an adviser at the age of 21, buy a house, get married and then have 2 children - there's not that much money sloshing around Swing/Position trading is TRADING - Investing is buying and holding and I would not risk my money for <10% per annum returns Your mindset is obviously only day traders can trade for a living, that isn't the case and the smart decisions are to trade what works for you - I prefer the daily charts, they free up my time to enjoy life - Square pegs into round holes and all that The stock Indexes "swing" many times per year, offering high end double-triple figure returns per YEAR - you'd have to be an absolute Muppet not to consider taking the easy route for profits and building an account - why would you be stupid to toil away on Intra-day charts stuck at the screen waiting for the next trade, when all you have to do is spend an hour an evening looking at end of day data, enjoying the rest of your day for whatever pursuits you wish Trading of ANY form - Day, Swing, Position - Is ultra hard, not all are up to the job or cut out for it, hence the exceptionally high failure rate, but they are all still TRADING I don't buy and hold (Invest) not for well over a decade Let's get 1 thing clear - I don't trade for the money, yes the money is required to live, but I don't trade to become filthy rich, Once I reach a level, I then trade and give the profits to charity or I stop trading for the rest of the year, leaving my money sat in cash earning peanuts Plonker
-
If you really really really want to be able to trade effectively for a living then you HAVE no choice but to follow the rules - BUT, there are some "rules" that can be ignored! That does not mean doing absolutely everything that you read about in the guides, manuals or books - Hell man, the ONLY time I've had a Trading "Journal" was when i was back testing and testing a presumed trading method - so that I could work out expectancy etc - I do NOT keep a trading journal, I know from the trades I've taken whether I'm up or down - I KNOW my methods work because i went through the pain of testing them years ago and I know that if i trade them over the year I'll come out on top - I just have utter faith in the techniques and methods I use and I don't see the value in wasting minutes recording the trades, into something that I'll never look at Take this week - SB on IG platform resulted in a £40 loss as I'm testing a couple of things on Intra-day charts, but in my ISA (with another provider) I've made and banked a £5,000 profit on the FTSE250 ETF (MIDD) - I don't need a trading journal to tell me that I'm up - also if you've not read my FTSE250 INDEX Market Analysis page then you missed my expectation of the market rising last week, because that £5k profit came from that analysis - one of my trading methods gave a buy signal and I bought. You'll as we go forward that when i take a trade I type all the relevant info i want onto the chart window so its there in my face whilst the trade is LIVE, but once the trade is over I'll delete the info We'll get into the nitty gritty from now on
-
This thread is to help those that are struggling to WIN and to BEAT the markets, it will also help you to look at the markets differently and understand what is going on from a technical analysis point of view Now this WON'T be what you're used to - I don't use much TA that you find inside of all the trading books Let's get a few things cleared up right now: I'm a Professional Trader - I trade my own money for a living - I prefer to trade daily charts as I don't need to be stuck glued to a screen all day I've done it for over 10 years, yes I've had bad periods, we all do, but I learnt from losing I do have a high intelligence of finance as I was a qualified Financial Adviser for 15 years - HOWEVER, NONE and I mean NONE of that experience or knowledge is used in my trading - apart from knowing that my SIPP, ISA and Spread betting accounts are tax-free vehicles Is it possible to forecast the markets? Yes it is, but NOT the daily or Intra-day price or time levels - my last 2 100% accurate, dead on forecasts were the 18th August 2015 plunge and the Feb 2020 highs - Both of these forecasts were made YEARS In advance of them occurring - happy to provide the evidence/proof, but NOT the cause If you are new to this thread, read it slowly and from the top down - it is ALL RELEVANT I'm writing this as i go along - it will depend on my will and time available as to how often i update this thread and add to (that includes answering Q's) I am open 100% to questions - ask away - but I don't want to be answering questions on various trading methods I'm NOT going to show you my best methods - I spent years developing and tweaking them, but I will show you some You do NOT have to be Intelligent or clever to win If you can follow rules, stick to plan of action and execute that plan of action without messing/tweaking or changing things along the way, then you have what it takes! - I think this is what all the textbooks call DISCIPLINE I'll keep things as simple as I possibly can - there are some things though that require complication I will not accept responsibility for any trades you take - you don't have to listen to me or take or apply whats in this thread - you and only YOU are 100% responsible for every trade that you take or try out - i would make sure you are 100% clued up before pulling the trigger My direct writing style might not suit your reading style - there's hundreds of people out there that will tell you what you want to hear - I tell it straight in this game as it's a win or lose environment I'm going to tackle this from the small account point of view to grow the account - see why in point #6 below I'm also assuming that you have a certain level of knowledge - I won't be covering the basics, just the essentials I'm covering a lot of stuff here and there will be typos' incorrect calculation etc - mistakes are bound to happen - I'll try my best to make sure not too many and I'll correct incorrect info when discovered (the aim is for that not to happen in the 1st place, but I'm a trader not a author) I can't think of anything else to add So Let's get into it: KEY point to note = MOST of the **** out there on trading DOES NOT WORK - Its why you're not making much money from this That's right most of the junk you're taught in manuals, courses, books and online - just does not work well enough for you to make money from it properly You'd probably be just as well off using a moving average cross over method (I'll show my favourite MA XOver method later on) Its most likely one of the main reasons why 95% of those that try to trade fail and lose their account - I'm guessing here as I don't know for certain and I have no plans to spend time Investigating - I'd rather watch paint dry than waste my time doing that. FIRST POINT Do you KNOW the EXPECTANCY of your trading method? If you don't know or don't know what Expectancy is - you need to STOP right now and go look it up, digest it, swallow it and be able to recite it in your sleep - it is CRITICAL to you're success If your trading method has a NEGATIVE Expectancy - you are going to lose and you may as well just buy and hold/Invest I would recommend a sample of 100 trades or more to arrive at your expectancy figure SECOND POINT Get a copy of Dr. Van Tharps "Trade your way to Financial Freedom" because you NEED to UNDERSTAND the LAWS OF PROBABILISTIC RETURNS and probability His book also covers POINT ONE above too! THIRD POINT (There's going to be lots of points!) There's a lot of boring stuff before we get to the good stuff I'm afraid! If your method results in a negative expectancy - DUMP IT FIND A METHOD THAT ACTUALLY WORKS The Turtles had a very very successful trading method but it only worked 30-40% of the time - the system had a positive expectancy but you'd lose on 60-70% of trades take, this leads on to POINT FOUR FOURTH POINT You NEED to use and find a trading method that suits YOU, but more importantly your PERSONALITY I love to beat the market, I love having one over on the market, I love finding the lows and trading them (Yes it can be done) But, I'm also a very very very very (how many can I write?) bad loser - I hate it when I lose, I've managed to learn how to handle it - but I hate losing So I HAVE to have a high win rate system/method as it helps me to cope with fewer losing trades Now If you've read Dr. Van Tharps book I mentioned in POINT #2 - Then you will know that to have a high win rate system comes at the price of not having a higher R profit return - for me this is perfectly fine - as my main personality type for trading purposes is to WIN Now in real life away from trading, I could not careless about winning - I don't need money or things to make me happy and I certainly don't need to be the best or most popular, but when i trade I need to win often It would also be worth your while reading Mark Douglas's "Trading in the zone" too if you're reading Dr. Van Tharps book as the content is crucial to your success believe it or not. FIFTH POINT When I have a losing trade - I throw something, swear at the chart/screen, swear some more and that's it If I have a loss when the market just, just, just nips my stop loss and then goes on to do what i was expecting - then I lose it for 5 mins and I'll go for a walk But ultimately I realise, accept and understand that I AM 100% RESPONSIBLE FOR MY TRADING AND EVERYTHING THAT GOES WITH IT If you don't accept responsibility you will blame everyone but yourself and when the game is simply win or lose if you can't accept that walk away - if something is not perfect trading wise, you HAVE to come up with a solution yourself SIXTH POINT RISK - this is huge - You need to understand RISK - again Dr. Van Tharp's book mentioned above covers all the risk permutations - all aspects of trading are Important We'll cover risk management of a trade later on but for now this is mine: I risk between 0.50%-2% per trade (Depends how many positions i have on, my total overall outstanding risk in the market etc) That 2% is of my trading account - so if my account is £10k then I risk £50-£200 per trade - end of story, simple as that I class this 0.5-2% risk as 1R (1 x risk) Trading this way lets you live many many days until the fund is gone Here's a theoretical example: I find a set-up, the ENTRY is 100p, I work out where my stop is going, at say 85p - 15p is at risk (I call this my range of risk) so this 15p is 1R So this 15p range of risk is 1R - on this trade I want to commit and risk £200 or 1R of my trading capital of £10k - £200 divided by £0.15p (15 points) = 1,333 shares to be bought or £13.33 per point spread bet I can place (if margin permits) That's it - if I'm wrong (barring a gap or slippage) if I set that trade in like that I'll lose £200 if my guess, bet, gamble of direction of the trade is wrong and as I KNOW some of my trades will NOT work I'm prepared for this and happy to risk that amount of money We'll look at where stops should be placed later on Someone asked me if I'm so confident on a trade why I don't bet 5 or 10% - I DO go to 5% risk, not 10% though, but only on certain trades where I'm happy with the risk level, these tend to be buy and hold positions that I plan to hold for weeks and to get into the position that sort of stop is required You HAVE to MASTER RISK too - if you're risking 10% per trade then 10 consecutive losing trades and you're out of the game - at 2% you need to lose 50 times to be out of the game The above risk assessment is simple, but very valuable REMEMBER - We ARE Gambling You need to minimise risk and maximise potential I'm coming at this series from a small account point of view to grow it - Based on the above, when you have a £100k trading account then, it's very easy to hit the following figures: Risk only 1% = £1,000 To make a 2R profit return = £2k Now most people could live off that, so people could if they wanted to reduce risk to obtain a decent income - its why I mentioned risk of 0.5%-2% - up to you, the bigger an account gets the less risk you can afford to take It is definitely possible to make 1R per week net profit, which if this is at 1% risk then its a 40% profit year, if you trade a 40 week year - which smashes out of the park buy and holding, even getting half this amount smashes buy and hold over the long term - remember this interest is compound as well The pressure is off This does not mean that every week you make 1R profit or whatever, you might make 10R profit on a trade and no other trades show up until the 11th week - When we get into it, you'll see that I trade what the market gives, not what I want from it SEVENTH POINT We ONLY trade when our method shows up The rest of the time we do something else - we do not trade, ONLY when our method or methods (I have multiple methods I trade) (that we know works because we've worked out the EXPECTANCY) shows up on a chart - we ONLY trade once we are 100% certain the set-up/method is in place We make sure that our methods have the deck of the cards stacked in OUR favour and not the houses - which is perfectly possible in trader land More to come in the weeks that follow - it will give you chance to read those books! WATCH THIS SPACE..........
-
Its a massive journey - I posted the other week a couple of methods that work - I don't post for fun, I KNOW how hard it is to trade, I post to be helpful and informative as much as my time permits - I learnt the most when I flew to Las Vegas to attend the Traders Expo in Nov 2010, to speak in person to some of the worlds leading traders - If you buy them a coffee and doughnut they open up MOST Methods out there do NOT work - They just do not work in the real world, they work perfectly on paper though! mmm maybe I should write a book.... Trading is a GAME of PROBABILITY - the laws of probabilistic returns therefore dictate your results Have you read "Trade your way to Financial Freedom" by Dr. Van Tharp? If not, you need to and you need to make sure you nail down Expectancy, THEN go find a method and test it based on those parameters I use Indicators - again most Indicators don't work unless they are set correctly - also you need to know how to use them for them to work - how many books on Indicator use have you read? What TYPE of market conditions does the Indicator you use fail to work properly in? Are you trying to trade the Indicator in the wrong market type? The reason I don't reveal everything is because it will be a complete waste of time, effort and typing as 99% think they know better, argue with you or don't bother to read it, as well as the fact that I've probably invested hundreds if not thousands of man hours in a method. I've been debating with myself whether to produce a series of tuition on here to help people who are struggling - This might be something that I do going forward Just REMEMBER - we are GAMBLING on the direction of the market on the right hand side of the chart that no-one can see
-
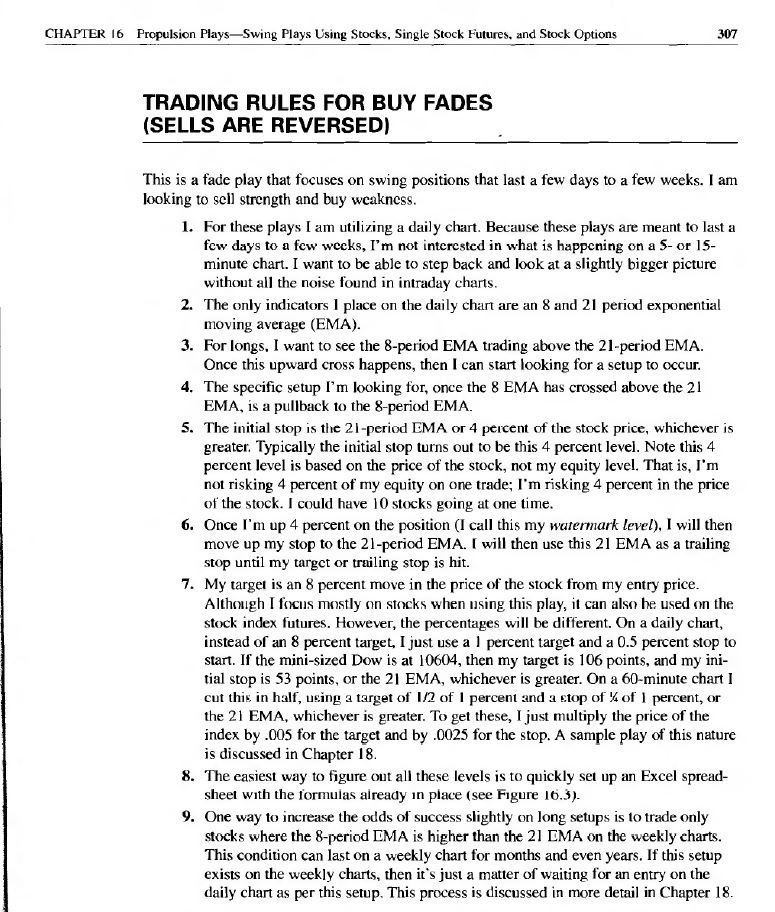
The % stops and targets i mention above are for DAILY charts - you need to reduce them accordingly for the time-frame you trade - I also just use a 10SMA and 21EMA for the trade and it works perfectly fine Here's JC's rules:
-
This is basically John Carters Propulsion trade set-up that he published in his book "Master the Trade" in the 2000's - Although the original method enters at the 8EMA with a 4% stop and 8% target for stocks and 1% stop and 2% target for Index/forex The money management is a little skewed in the video - It would make just as much sense getting out in full at T1, rather than selling 50% at T1 and the rest @ T2 as it's much easier to hit T1 than it is T2 for the same return If it was me (and I DO trade this Propulsion set-up) I would trade in 2 units - sell 1 unit @ T1 and then trailing the remaining unit at a 2 or 3 trailing bar low as mentioned as it doesn't make sense selling at the 2 target levels he mentions as T2 is not always hit
-
What to do at weekends when trading dries up?
THT replied to dmedin's topic in General Trading Strategy Discussion
I plan the next weeks set-ups, market direction and then get away from the screens -
Hi - I would take the Sentiment readings with a pinch of salt - it would be better if a quick survey was taken when placing positions as 95% of those trades/position could be trading short-term intraday directional trades If one of my methods shows up on a chart I trade it, regardless of sentiment readings


