

ArvinIG
-
Posts
1,728 -
Joined
-
Last visited
-
Days Won
23
Content Type
Profiles
Forums
Blogs
Events
Community Tutorials
Store
Everything posted by ArvinIG
-

Share Dealing, where does one start, 1st time on IG...
ArvinIG replied to Rawnuk7's topic in New to IG Community
Hi @Rawnuk7, Thank you for your post and welcome to IG Community. On the Community there is all types of traders and different level of experience, beginners are more than welcome. Feel free to go through the the IG Academy it might gives you some information on share trading, it is a free educational tool provided by IG: https://www.ig.com/au/learn-to-trade/ig-academy You can also have a look at the page below, it contains several articles that you might need useful. https://www.ig.com/uk/trading-need-to-knows If you have specific questions feel free to post on the IG Community. All the best - Arvin -
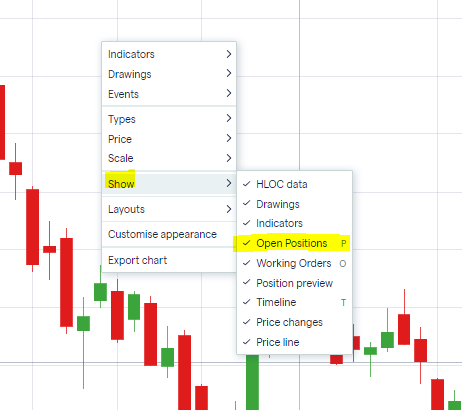
Hi @Marius1, Thank you for your post. Please ensure that chart is setup to show your positions by right clicking on the chart > Show: If your open positions are still not showing please reach out to helpdesk.za@ig.com. Thank you - Arvin
-
Please see the expected dividend adjustment figures for a number of our major indices for the week commencing 27th June 2022. These are projected dividends and likely to change. IG cannot be held responsible for any changes made. Dividends highlighted in red include a special dividend, therefore some or all of the amount will not be adjusted. Amount in brackets is the expected adjustment after special dividends excluded (where shown on major indices). Dividend adjustments due to be posted on a bank holiday will usually be posted on the previous working day. If you have any queries or questions on this please let us know in the comments section below. For further information regarding dividend adjustments, and how they affect your positions, please take a look at the video. NB: All dividend adjustments are forecasts and therefore speculative.A dividend adjustment is a cash neutral adjustment on your account. Special Dividends Index Bloomberg Code Effective Date Summary Dividend Amount N/A Special Div How do dividend adjustments work? This information has been prepared by IG, a trading name of IG Markets Limited. In addition to the disclaimer below, the material on this page does not contain a record of our trading prices, or an offer of, or solicitation for, a transaction in any financial instrument. IG accepts no responsibility for any use that may be made of these comments and for any consequences that result. No representation or warranty is given as to the accuracy or completeness of this information. Consequently any person acting on it does so entirely at their own risk. Any research provided does not have regard to the specific investment objectives, financial situation and needs of any specific person who may receive it. It has not been prepared in accordance with legal requirements designed to promote the independence of investment research and as such is considered to be a marketing communication. Although we are not specifically constrained from dealing ahead of our recommendations we do not seek to take advantage of them before they are provided to our clients. See full non-independent research disclaimer and quarterly summary.
-
Hi @Thoughtsofmoog, Once the market is open on the deal ticket you should be able to change the order type to stop order: Could you please advise which stock you are after? Thank you - Arvin

-
Crude oil prices may fall as world growth outlook deteriorates, OPEC+ output rises
ArvinIG posted a blog entry in Market News
Crude oil prices are on pace for the worst month since November. Global growth expectations for 2022 are falling as OPEC+ continues restoring supply. Is more pain ahead for WTI? Source: Bloomberg Commodities Petroleum Price of oil OPEC WTI Inflation WTI on course for worst month since November as fundamental drivers decay After six months of consecutive gains, WTI crude oil is on pace to weaken by over nine percent this month. That would be the worst performance since November 2021 if it holds. In fact, on Wednesday the commodity closed at its lowest since early May. Is there more scope for energy prices to weaken ahead? Or will this translate into another bounce in the coming weeks? Broadly speaking, WTI has been on an impressive rally that has its beginnings going back to when prices found a bottom in 2020. Then, a global pandemic destroyed travel demand, plunging oil prices to lows not seen in decades. Since then, recovery from a period of lockdowns, plentiful government stimulus and geopolitical tensions in Europe have worked in unison to bolster prices. Things are seemingly turning. Some of the highest global inflation in decades has resulted in central banks around the world tightening monetary policy. To bring down rising prices, they must slow down growth by raising interest rates and ending government asset purchases. Unsurprisingly, real 2022 global growth estimates have been falling. On the chart below, growth is now seen at 3.2% y/y versus 4.5% expected back in late 2021. This is a clear downside risk to oil amid rising recession concerns. Meanwhile, the Organization of the Petroleum and Exporting Countries and allies (OPEC+) have been gradually restoring supply – see chart below. By August, the last of the production cuts made back in 2020 is expected to be rolled back. Barring an escalation of tensions between Russia and the West, it seems that the tide may be turning for crude oil. With that in mind, what are key technical levels traders should watch for? Crude oil fundamental drivers – global growth, OPEC output Source: TradingView Crude oil technical analysis Crude oil prices have broken under a key rising trendline from December – red parallel lines in the chart below. A confirmatory secondary close below could open the door to reversing more of the 100% rise from the end of last year through late February. Below, the 92.95 – 95.11 support zone will be key to watch as the 200-day Simple Moving Average nears. Clearing the latter opens the door to retesting the 85.38 inflection point. Otherwise, a turn back above the trendline could hint at uptrend resumption. Daily chart Source: TradingView Daniel Dubrovsky | Currency Analyst, DailyFX, San Francisco 23 June 2022 This information has been prepared by DailyFX, the partner site of IG offering leading forex news and analysis. In addition to the disclaimer below, the material on this page does not contain a record of our trading prices, or an offer of, or solicitation for, a transaction in any financial instrument. IG accepts no responsibility for any use that may be made of these comments and for any consequences that result. No representation or warranty is given as to the accuracy or completeness of this information. Consequently any person acting on it does so entirely at their own risk. Any research provided does not have regard to the specific investment objectives, financial situation and needs of any specific person who may receive it. It has not been prepared in accordance with legal requirements designed to promote the independence of investment research and as such is considered to be a marketing communication. Although we are not specifically constrained from dealing ahead of our recommendations we do not seek to take advantage of them before they are provided to our clients. -
Is the BP share price dip an excellent FTSE 100 opportunity?
ArvinIG posted a blog entry in Market News
BP shares have fallen sharply in recent days as the FTSE 100 oil major recalibrates its investments. Source: Bloomberg Indices Shares Commodities BP Petroleum Price BP's (LON: BP) share price has fallen by 9% in just five days. But while this steep fall appears worrying, BP shares are also up 19% over the past year. By comparison, the FTSE 100 has remained essentially flat. While this volatility is partially down to the sliding value of Brent Crude, and fears of an upcoming global recession, investors are also reassessing the FTSE 100 oil major’s prospects. BP share price: oil changes In November, CEO Bernard Looney famously proclaimed BP a ‘cash machine,’ at a time when Brent Crude was trading at $74. Accordingly, 2021 full-year profits struck an eight-year high of $12.8 billion, while Q1 2022 underlying profits more than doubled to $6.2 billion as Brent hit multi-year highs. Of course, oil prices are unlikely to remain this high forever. Longview Economics thinks that ‘if oil prices remain at current levels, there will be a significant supply response over the coming 12-18 months which will generate a global supply surplus /rising oil inventories in 2023.’ But with bumper profits, BP plans to spend 60% of the excess on share buybacks while average energy bills are expected to close on £3,000 by autumn. Accordingly, Chancellor Rishi Sunak has announced an additional 25% ‘energy profits levy’ on North Sea gas and oil operators, until ‘normal’ prices return or until the end of 2025. However, he included a ‘super-deduction’ from this additional tax, worth 91p on every £1 of investments in the North Sea. Linda Cook, CEO of Harbour Energy, the biggest oil and gas producer in the North Sea, has criticised the windfall tax as ‘seriously flawed,’ as it is ‘disproportionately large compared with the projected impact on major oil companies such as BP and Shell.’ But Looney has also been critical, arguing that it ‘is not for a one-off tax – it’s a multi-year proposal. Naturally, we will now need to look at the impact of both the new levy and the tax relief on our North Sea investment plans.’ BP was planning to invest £18 billion into the UK over the next eight years, despite not having opened an exploratory well since 2018. Source: Bloomberg The FTSE 100 operator has also taken a $24.4 billion hit from exiting its 19.75% stake in Rosneft. A third of BP’s oil came from Russia last year, as well as a significant chunk of its income. BP has also quit the Canadian oil sands, after selling its 50% stake in the Sunrise project to Cenovus Energy in a $1 billion deal, which will also see BP receive acreage off the east coast of Canada to explore and develop new oil and gas fields. BP explained the deal ‘will shift its focus to future potential offshore growth,’ while Starlee Sykes, senior vice-president of the Gulf of Mexico and Canada, argues it ‘will position BP Canada for strong future growth.’ Exploratory drilling will last until 2026, with strong demand likely from both Canada and the USA as Russian oil remains off the market. FTSE 100 stock: renewable plans While rapidly changing its oil-producing mix, BP has a long-term ambition to hit net zero by 2050. Accordingly, it’s agreed to buy a 40.5% stake in the 6,500 square kilometre Asian Renewable Energy Hub in Pilbara, Western Australia, for an undisclosed sum. The project, which will cost more than $30 billion to develop, counts Intercontinental Energy, CWP Global and Macquarie as partners. BP argues it has ‘the potential to be one of the largest renewables and green hydrogen hubs in the world,’ hoping to develop 26GW of solar and wind power and 1.6 million tonnes of green hydrogen a year. Executive vice-president of gas and low-carbon energy Anja-Isabel Dotzenrath contends that ‘AREH can be a cornerstone project for us in helping our local and global customers and partners in meeting their net zero and energy commitments.’ And encouragingly, the VP expects it to represent ‘a material contribution’ to BP’s plans to corner 10% of the global hydrogen market. The FTSE 100 company projects that low-carbon hydrogen will make up 15% of the global energy mix by 2050, and will account for 40% of BP’s capital expenditure by 2030. The oil major will become the development’s operator from 1 July, subject to Australian regulatory approval. The FTSE 100 supermajor has also appointed veteran Felipe Arbelaez to lead its new hydrogen unit, which plans to take on 100 more employees through 2022. Arbelaez thinks ‘the desire to progress the hydrogen market is really accelerating across all nations and particularly in Europe, Asia and the United States,’ augmented by the wish for ‘security of supply of energy, particularly in the European context on the back of the Ukrainian conflict.’ This leaves BP’s share price dip as a potential FTSE 100 buying opportunity. Charles Archer | Financial Writer, London 23 June 2022 -
Australian dollar eyes BRICS summit after mixed PMI data
ArvinIG posted a blog entry in IG Community Blog
Australian dollar falls against US dollar as markets shift to risk-off; the 2022 BRICS Summit set to kick off today in virtual format and AUD/USD looks set for further weakness above key trendline support. Source: Bloomberg Forex United States dollar Australian dollar BRICS United States Australia Thursday’s Asia-Pacific outlook Asia-Pacific markets may fall today after traders went risk-off overnight during the New York trading session. Recessionary fears were brought back into the fold after Federal Reserve Chair Jerome Powell clarified that rate hikes may cause a recession. Mr. Powell, speaking before Congress, said, “it’s certainly a possibility.” US stock indexes responded by trimming early gains and finishing the day with losses. The risk-sensitive Australian dollar fell against the US dollar. This morning, Australia’s global manufacturing PMI flash index rose to 55.8 for June, up from 55.7 in May, according to S&P Global. The services sector component fell to 52.6 from 53.2. It was the euro, and not the dollar, that benefited from the risk-off flows in the currency market. The Greenback’s strength was stifled by strong bond-buying across the short-end of the Treasury curve, with yields broadly falling across maturities as well. The USD-sensitive 5-year Treasury rate fell to its lowest level since June 10. Bond investors’ appetite extended throughout bond markets in the APAC region, with government bond yields falling in Australia and New Zealand. Energy markets were another victim of the increased confidence in an impending recession. WTI crude prices fell nearly 4% to the lowest levels traded at since early May. The Fed’s signaling over the possibility of a recession benefits their policy in this regard, as lower oil prices are likely to help cool inflationary pressures. President Joe Biden called on Congress to suspend the federal gasoline tax through September. The US President is under growing political pressure with gasoline prices at or near record highs across much of the US. Elsewhere, the BRICS Summit is set to kick off in its virtual format. The leaders of Brazil, Russia, India, China, and South Africa will discuss economic and political cooperation, among other matters. It will also be the first time Russian President Vladimir Putin publicly joins other leaders since the invasion of Ukraine. There may also be some talk about further shifting away from the US dollar system. Notable events for June 22: Japan – Foreign Bond Investment (18/June) Japan – Jibun Bank Manufacturing PMI Flash (June) Thailand – Balance of Trade (May) Philippines – Interest Rate Decision Indonesia – Interest Rate Decision AUD/USD technical forecast AUD/USD reversed its gains from earlier this week after prices fell close to trendline support before trimming some losses. That trendline may continue to underpin prices. The Relative Strength Index (RSI) and MACD oscillators remain weak, offering little sign of a turnaround in momentum in the short term. To the upside, the psychologically imposing 0.7000 level may provide resistance if prices turn higher. AUD/USD daily chart Source: TradingView Thomas Westwater | Analyst, DailyFX, New York City 23 June 2022 This information has been prepared by DailyFX, the partner site of IG offering leading forex news and analysis. In addition to the disclaimer below, the material on this page does not contain a record of our trading prices, or an offer of, or solicitation for, a transaction in any financial instrument. IG accepts no responsibility for any use that may be made of these comments and for any consequences that result. No representation or warranty is given as to the accuracy or completeness of this information. Consequently any person acting on it does so entirely at their own risk. Any research provided does not have regard to the specific investment objectives, financial situation and needs of any specific person who may receive it. It has not been prepared in accordance with legal requirements designed to promote the independence of investment research and as such is considered to be a marketing communication. Although we are not specifically constrained from dealing ahead of our recommendations we do not seek to take advantage of them before they are provided to our clients. -
IG New account creation
ArvinIG replied to ANYCAST666's question in IG Technical Support - Platform and App Help
Hi @ANYCAST666, Thank you for your post. Once your documents are received and verified you should allow few more business days before you can deposit funds and trade. The Account opening team or your account manager will be in touch with you. All the best - Arvin -
Hi @LiamWhite, Thank you for your request. It has been submitted to the dealing desk to be added. All the best - Arvin
-
EUR/USD has recovered from a test of the lows; yen depreciation sees EUR/JPY eyeing new highs and momentum might be the key but can EUR/USD break higher? Source: Bloomberg Forex Shares EUR/USD Market sentiment Euro EUR/JPY EUR/USD technical analysis EUR/USD appears to be content to trade sideways for now after failing to break lower last week, hitting a low of 1.0359. That move challenged last month’s low of 1.0349, which was above the January 2017 low of 1.0340. These levels may provide a support zone in the 1.0340 – 1.0360 area. That move has also set-up a potential Double Bottom that might signal a reversal. The price has moved above the 10-day simple moving average (SMA) but remains below the 21-, 34-, 55-, and 100-day SMAs, which could suggest bearish momentum is pausing. A move above the nearby 34-SMA would further support this. All period SMAs have a negative gradient that is working against bullish momentum for now. A move back below the 10-day SMA might suggest a resumption of bearish momentum. There is a cluster of resistance above the price with the 21-, 34- and 55-day SMAs among a previous high, a break point and a descending trend line. These all sit between 1.0580 and 1.0660. A break above 1.0660 could be significant. Source: TradingView EUR/JPY technical analysis Bullish momentum appears to have resumed for EUR/JPY after breaking the top side of a Pennant formation last month. At that time, the price re-asserted bullish momentum by moving above the 10-, 21-, 55- and 100-day simple moving averages (SMA). Since then, it has gone on to make an 8-year high at 144.25 earlier this month and this could be a level of resistance. The 21-, 55- and 100-day SMAs have positive gradients but the 10-day SMA has recently rolled over to negative. An uptick to the 10-day SMA could support further bullish momentum. The subsequent pullback tried to break below an ascending trend line but was unable to follow through. Support may remain at the trend line, currently dissecting at a break point of 140.00. Further down, support could be at the break points of 139.00, 138.32 and 136.79. Source: TradingView Daniel McCarthy | Strategist 22 June 2022 This information has been prepared by DailyFX, the partner site of IG offering leading forex news and analysis. In addition to the disclaimer below, the material on this page does not contain a record of our trading prices, or an offer of, or solicitation for, a transaction in any financial instrument. IG accepts no responsibility for any use that may be made of these comments and for any consequences that result. No representation or warranty is given as to the accuracy or completeness of this information. Consequently any person acting on it does so entirely at their own risk. Any research provided does not have regard to the specific investment objectives, financial situation and needs of any specific person who may receive it. It has not been prepared in accordance with legal requirements designed to promote the independence of investment research and as such is considered to be a marketing communication. Although we are not specifically constrained from dealing ahead of our recommendations we do not seek to take advantage of them before they are provided to our clients.
-
GOLD, XAU/USD, SILVER, XAG/USD, TECHNICAL ANALYSIS, RETAIL TRADER POSITIONING - TALKING POINTS Fundamental analysis hints gold, silver may continue falling Retail trader bets offer upside view on gold, downside for silver How are technicals aligning with the fundamentals, positioning? Gold and Silver prices have been struggling to find upside momentum in recent weeks amid global efforts from central banks to tame high inflation. This is making for a difficult fundamental environment for these anti-fiat precious metals. How have retail traders been positioning themselves in XAU/USD and XAG/USD amid recent price action and what could that mean for the road ahead? For a deeper dive into the analysis, check out this week’s webinar recording above. GOLD SENTIMENT OUTLOOK - BULLISH The IGCS gauge shows that about 81% of retail traders are net-long gold. IGCS tends to function as a contrarian indicator. As such, the fact that traders remain net-long hints prices may continue falling. However, short bets have climbed by 2.2% and 20.32% compared to yesterday and last week respectively. With that in mind, recent changes in sentiment warn that gold could reverse higher. XAU/USD DAILY CHART On the daily chart, XAU/USD remains in a downtrend since early March, but recent price action is looking neutral. The yellow metal appears to be consolidating between resistance (1869 – 1879) and support (1787 – 1810). In fact, it seems that gold could form a Bearish Rectangle. Breaking under the range of support could be a sign of downtrend resumption. That would place the focus on lows from December. Otherwise, pushing above resistance could shift the outlook increasingly bullish. Chart Created in Trading View SILVER SENTIMENT OUTLOOK - BEARISH The IGCS gauge shows that roughly 95% of retail investors are net-long silver. Since nearly the absolute majority of traders are positioned to the upside, this is a sign that prices may continue falling. Downside exposure has been falling recently, declining by 12.79% and 33.92% versus yesterday and last week respectively. With that in mind, the combination of current readings and recent changes in IGCS hint that Silver may remain biased to the downside. XAG/USD DAILY CHART Similar to gold, silver prices have been in a downtrend since early March. Recent price action has been looking neutral as well. A Bearish Death Cross remains between the 20- and 50-day Simple Moving Averages (SMAs), offering a downside bias. Key support seems to be the May low at 20.46. Clearing the latter exposes the midpoint of the Fibonacci extension at 19.63. Otherwise, clearing resistance (22.20 – 22.51) opens the door to a bullish technical outlook. Chart Created in Trading View *IG Client Sentiment Charts and Positioning Data Used from June 21st Report Daniel Dubrovsky, Strategist for DailyFX.com 22 June 2022 To contact Daniel, use the comments section below or @ddubrovskyFX on Twitter DailyFX provides forex news and technical analysis on the trends that influence the global currency markets. DISCLOSURES
-
How to set up a demo share trading account
ArvinIG replied to LordStewart1963's question in IG Account Support - MyIG Help
Hi @LordStewart1963, Thank you for your post. There is no Share dealing Demo account, only CFD and Spread Betting. Thank you - Arvin -
Hi @User2022, Thank you for your post. You will need to reach out to the Helpdesk with your registered email address. Did you open an account recently and are waiting for your account to be activated? Thank you - Arvin
-
AT&T and Warner Bros. Discovery merger in April 2022
ArvinIG replied to ChristianJS's question in IG Trading Support - Dealing Questions
Hi @ChristianJS, Apologies for the confusion, you will need to set the book cost to the price you initially paid the stock. If you initially paid USD 100 for the stocks for example, you will need to set the book cost at 100. Thank you - Arvin -
AT&T and Warner Bros. Discovery merger in April 2022
ArvinIG replied to ChristianJS's question in IG Trading Support - Dealing Questions
Hi @ChristianJS, On the system the Corporate action team need to sell and buy stock at the price of 0 to go through. You will need to edit your book cost for the P/L to display correctly. you can find the steps on how to edit your book cost here: https://www.ig.com/au/help-and-support/investments/share-trading/how-do-i-edit-my-book-cost I hope that it helps ! All the best - Arvin -
Hi @Hedge99, Thank you for your post and welcome to the IG Community. Effectively, you do not need hold a Crypto wallet to trade on Cryptos with IG. You are betting on price changes. Something you may consider is the overnight funding: "Our daily overnight funding rate is currently 0.0347% (12.5% per Annum) for bitcoin, 0.0417% for the Crypto 10 Index and 0.0556% (20% per Annum) for all other cryptocurrency markets. At present, clients with a long position will pay this overnight funding rate, while clients with a short position will receive on the overnight funding rate. In addition, a 7.5% per-annum IG admin fee will also apply for both long and short positions." https://www.ig.com/uk/help-and-support/spread-betting-and-cfds/products-markets-and-trading-hours/what-are-igs-bitcoin-spread-bet-product-details IG will hedge your exposure in the underlying market,so our interests are aligned with yours. you won't be exposed to IG exposure. I hope that it helps ! All the best - Arvin
-
Source: Bloomberg Forex United States dollar Currency Bank of Japan Pound sterling Federal Reserve Global financial markets moved diligently to price in the latest action from the Federal Reserve last week when Mr. Powell’s FOMC raised the US benchmark rate by 75-basis-points. The jumbo rate hike tempered inflation expectations, and perhaps returned some credibility to the institution. However, the impact on equity markets was undeniably bearish. The Dow Jones Industrial Average (DJIA) fell over 4% to its lowest level since November 2020. The US dollar benefited from the safe-haven flows despite an immediate reaction to the downside. The DXY index was up around 0.50% going into the weekend. However, there are technical signs across major crosses, such as EUR/USD, GBP/USD, AUD/USD and USD/CAD, that show the dollar’s ascent is perhaps at or near a critical juncture. The Bank of England remained in a relatively dovish stance, hiking its benchmark rate by 0.25%. The dollar advanced against the pound, but trimmed some of those gains in the second halve of the week. Oil prices plummeted on Friday as traders baked in growing fears over a Fed-induced recession. That comes amid the summer driving season, which typically sees higher demand for fuels persist into the fall months. Natural gas prices found relief in the United States after an LNG terminal suffered a catastrophic failure, likely to take months to repair. European prices, however, skyrocketed. The development is likely to keep prices in Europe elevated, further complicating Europe’s inflation outlook. Speaking of energy prices, Canada is set to report inflation data for May on Wednesday. The country’s consumer price index (CPI) is expected to cross the wires at 7.5% on a year-over-year basis. That would be up from April’s 6.8% y/y increase. A hotter-than-expected print would likely inspire already-aggressive Bank of Canada rate hike bets, potentially bolster the CAD. Japan is also slated to release inflation data for May. The Bank of Japan held firm in its dovish stance last week against a market that appeared to be trying to force the BoJ’s policy stance. That didn’t happen. The mantra of 'don’t fight the Fed' seems to be just as appropriate for the Bank of Japan. The yen fell versus the dollar last week, although the pace of losses started to cool. A hotter-than-expected CPI print out of Japan may actually see USD/JPY fall. Source: TradingView Thomas Westwater | Analyst, DailyFX, New York City 20 June 2022 This information has been prepared by DailyFX, the partner site of IG offering leading forex news and analysis. In addition to the disclaimer below, the material on this page does not contain a record of our trading prices, or an offer of, or solicitation for, a transaction in any financial instrument. IG accepts no responsibility for any use that may be made of these comments and for any consequences that result. No representation or warranty is given as to the accuracy or completeness of this information. Consequently any person acting on it does so entirely at their own risk. Any research provided does not have regard to the specific investment objectives, financial situation and needs of any specific person who may receive it. It has not been prepared in accordance with legal requirements designed to promote the independence of investment research and as such is considered to be a marketing communication. Although we are not specifically constrained from dealing ahead of our recommendations we do not seek to take advantage of them before they are provided to our clients.
-
Printing Statements
ArvinIG replied to ians33's question in IG Technical Support - Platform and App Help
Hi @ians33, Thank you for your post. To access your yearly statements you will need to go on My IG > Live accounts > Statements: Please ensure that in the 'You are viewing' section at the top, you are looking at the right account. You will find you previous statements if you received dividends in the past. You can download the statements and print them. I hope that it helps All the best - Arvin
-
Do you first close unopened orders after margin call?
ArvinIG replied to Profanello's topic in New Client Trading Questions
Hi @Profanello, Thank you for your post. Your positions will be closed on a First in First out (FIFO) basis, meaning we will close the position by order not all of them. We will not close your open orders, otherwise you will miss out on opening position on markets you wanted too. You will receive warnings as explained in the link below. You can close your open orders if you like to avoid closing open positions. What is margin call? | IG UK I hope that it helps ! All the best - Arvin -
Hi all, Unfortunately, you can only add stops on existing position with leveraged accounts like a CFD account. You will need to place the stop/limit when placing the deal. I hope that it helps. All the best - Arvin
-
Hi @EmilyD, Thank you for your post. You will need to open opposite trades in on same market and quantity. $5 contracts and 1$ respectively. Make sure that you are using force open and not net off, otherwise it will close your existing position to open a new one: More information on Force open here: https://www.ig.com/au/glossary-trading-terms/force-open-definition#:~:text=What is force open%3F,position on the same asset. I hope that it helps. All the best - Arvin

-
Hi @Skyfall77, You can use the ETF Screener to go through the different ETFs available: https://etfscreener.ig.com/?cols=AssetClass,Currency,NetAssets,PrimaryExchange,ReturnM12&filters=GlobalSector,ISA,LeveragedFund,UCITS&map=null&page=1&sortCol=NetAssets&sortDir=-1 I hope that it helps. All the best - Arvin
-
Account showing 0 Balance, holdings disappeared
ArvinIG replied to discodisco200's question in IG Account Support - MyIG Help
Hi @discodisco200, Thank you for your post. It is possible that your balance was showing the wrong amount as during weekends IG performs backups. The maintenance usually ends at 1pm AEST. Please let us know if it is showing properly now. Thank you - Arvin -
Hi @JohnD22, Thank you for your post. Cryptocurrencies markets close at 10pm on Friday night (UK time), then reopen on Saturday at 8am (UK time). On weekends IG performs backups, it is possible that some maintenance are longer that other, hence delays. I hope that it helps. All the best - Arvin
-
New to the community…..HELLO
ArvinIG replied to ChrisHewlett's topic in General Trading Strategy Discussion
Hi @ChrisHewlett, Thank you for your post and welcome to the IG Community ! All the best - Arvin


