

ArvinIG
-
Posts
1,728 -
Joined
-
Last visited
-
Days Won
23
Content Type
Profiles
Forums
Blogs
Events
Community Tutorials
Store
Everything posted by ArvinIG
-

How do we display Charges on "Position" tab
ArvinIG replied to PRAVIN_BAKRANIA's question in IG Technical Support - Platform and App Help
Hi @PRAVIN_BAKRANIA, Could you please clarify what you mean by charges? Do you mean commission per deal? On the position tab you can add filters, see below: I hope that it helps - Arvin
-
Where next for Target shares after worst plunge since 1987 crash?
ArvinIG posted a blog entry in Market News
Target’s 25% share price fall, the worst one-day decline since 1987’s Black Monday, dragged other retailers down and hit the broader market. Source: Bloomberg Shares Price Target Corporation Retail Inventory Warehouse Target widely misses estimates The US behemoth retailer Target widely missed analyst estimates as a surge in costs squeezed margins in the first quarter (Q1). When the company cut its profit forecast it triggered the sharpest one-day decline in its share price since the Black Monday 1987 crash. Target’s supply chain constraints, rapidly rising fuel, and freight costs in Q1 amid a shift in consumer shopping habits which led to a sharp slowdown in apparel and home goods sales, led the company to mark down bloated inventories and lower its forward guidance. The retailer stated that it would have to spend $1 billion more on freight in 2022 than it expected to at the start of the year as widespread Covid lockdowns in China created congestion at Asian sea ports, and rising petrol prices have driven up the cost of trucking. Added to that, Target ordered too many bulky home goods which US consumers bought less of, and which are especially costly to ship and store because of their size and weight, forcing the company to rent additional warehouse space in the tightest warehouse market on record to store its excess inventory before selling it off at highly discounted prices to free up storage space. All of the above led to Target’s net income dropping by 52% in the first quarter of 2022 compared to the same period in 2021 and a near 25% drop in its share price on Wednesday. Where to next for Target’s share price? Year-to-date the Target share price has declined by 30%, the majority of which yesterday, with it falling to the 61.8% Fibonacci retracement of the 2020-2022 bull market at $155.22 before consolidating in the short-term. Source: ProRealTime Over the next few days this year’s decline is expected to continue with the August 2020 high at $152 representing the first downside target, followed by the October 2020 low and the 200-week simple moving average (SMA) at $146.90 to $144.83. In this area the share price may find support. On the daily chart a huge gap has been formed between Tuesday’s low at $209.27 and yesterday’s high at $167.77 which is not expected to get filled for several months at the very least. Source: ProRealTime In case of the share price stabilising in the short-term, the 50% retracement of the advance from the March 2020 pandemic low and the November 2020 high at $176.40 to $177.43 may act as initial resistance. If not, the next higher February low at $183.07 is likely to be more solid resistance and is expected to cap, if reached at all. Axel Rudolph | Market Analyst, London 19 May 2022 -
AUD/USD Rebound Takes Shape Ahead of Australia Employment Report
ArvinIG replied to ArvinIG's topic in Foreign Exchange (FX)
(UPDATE) Australian dollar steady after jobs data amid risk off sentiment The Australian dollar was steady after jobs data was largely inline; today’s data is against a backdrop of a strong domestic economic outlook and the RBA are validated for raising rates. Will more hikes boost AUD/USD? Source: Bloomberg Forex Inflation Australian dollar United States dollar Unemployment AUD/USD The Australian dollar held its ground after the April unemployment rate came in at 3.9% as forecast and against 4.0% previously. This is the lowest Australian unemployment rate since the 1970s. The overall change in employment for the month was 4k instead of 30k anticipated. Full time employment increased a whopping 92k, while part time jobs decreased 88k. With uncomfortably high inflation, today’s number opens the way for the RBA to continue to hike rates and potentially accelerate the lifting cycle to rein in loose policy. However, domestic factors appear to be sidelined for the exchange rate for now. The Aussie was pummelled overnight in a classic risk off trading environment after the reality of steep monetary tightening globally became apparent to a seemingly complacent equity market. When it comes to growth versus inflation, central banks have erred on the side of fostering growth at the expense of living with high inflation. This is born out of the 1970-80s period of high inflation. At that time, US Federal Reserve Chair Paul Volker got the backing of two successive administrations, from both sides of the aisle, to get inflation under control. He did so through several highly restrictive policies. One of these was a move to very high interest rates. The cost of this policy was two severe recessions in the 1980s. The market appears to have woken up to this stark reality for the current situation. Cheap money of this era is being consigned to history at a rapid rate of knots. With central banks focused on fighting inflation, risk assets that rely on cheap funding now have their business models questioned. As an example, special purpose acquisition companies (SPAC), once the darlings of the recent free-money environment, are facing difficulties raising cash - if they can at all. More concerning has been the recent disappointing reporting results from real economy companies in the US. This backdrop leads to growth linked currencies like the Aussie coming under pressure, while perceived safe-haven currencies like the US dollar, Japanese yen and Swiss franc attract inflows. Movements in the USD (DXY) index seems to be driving AUD/USD for now. Source: TradingView This information has been prepared by DailyFX, the partner site of IG offering leading forex news and analysis. In addition to the disclaimer below, the material on this page does not contain a record of our trading prices, or an offer of, or solicitation for, a transaction in any financial instrument. IG accepts no responsibility for any use that may be made of these comments and for any consequences that result. No representation or warranty is given as to the accuracy or completeness of this information. Consequently any person acting on it does so entirely at their own risk. Any research provided does not have regard to the specific investment objectives, financial situation and needs of any specific person who may receive it. It has not been prepared in accordance with legal requirements designed to promote the independence of investment research and as such is considered to be a marketing communication. Although we are not specifically constrained from dealing ahead of our recommendations we do not seek to take advantage of them before they are provided to our clients. Daniel McCarthy | Strategist 19 May 2022 -
As 2022 heads towards a seemingly inevitable recession, some of the larger US tech stocks are becoming ever more reasonably priced. Source: Bloomberg Like the 2020 covid-19 pandemic crash, and the financial crisis of 2008 preceding it, 2022 is gearing up to be a financial bloodbath. The Nasdaq Composite fell 4.73% yesterday alone, and is down nearly 28% year-to-date. Of course, this is a very different crisis; one of supply chain shocks, sky-high inflation and labour shortages. And while the UK’s oil and bank heavy FTSE 100 is perfectly positioned to take advantage of record commodity highs and rising interest rates, the opposite is true of the US’s Nasdaq Composite. The high-growth index is packed with technology stocks that rely on being watered with the nectar of loose monetary policy. But those days are gone. The US Federal Reserve, in common with many western central banks, is moving to clip its $9 trillion balance sheet and increase interest rates to potentially as high as 2.9% says the Economist Intelligence Unit. Meanwhile, former Goldman Sachs CEO Lloyd Blankfein has warned the risk of recession is ‘very, very high.’ This leaves NASDAQ stocks with high debt, or in the early stages of growth, in peril. The likes of Peloton, Zoom and DocuSign have already collapsed from their share price highs. Of course, they could deliver exceptional returns if they successfully weather the oncoming storm, but this is by no means guaranteed. On the other hand, the NASDAQ Composite also includes market titans that have been hit by the shotgun spread of negative market sentiment, despite boasting strong balance sheets, defensive qualities, and continued growth in the face of the 2022 recession. 2022 recession: 5 top NASDAQ sell-off stocks to watch 1) Amazon (NASDAQ: AMZN) Amazon, the largest e-commerce stock in the world, saw net sales rise by 22% to $469.8 billion in 2021. And it still delivered growth in Q1 2022, despite online sales dropping slightly. Further growth potential can be found in its AWS cloud computing platform, which has grown 34% annually over the past two years. AWS is now the cloud market leader, with 33% of global market share according to Finbold, more than Microsoft’s Azure and Google’s Cloud offerings combined. And with new CEO Andy Jassy spearheading a $10 billion share buyback scheme and 20-for-1 stock split, Amazon’s share price remains down 37% year-to-date. 2) Alphabet (NASDAQ: GOOGL) The Google and YouTube owner saw revenue grow by an impressive 23% year-over-year to $68 billion in Q1. Despite representing ten times the Q1 revenue of 2010, it’s still a slowdown compared to pandemic breakthroughs. However, Google search revenue grew by $8 billion to $39 billion, demonstrating its stranglehold in the search arena. And Insider Intelligence data indicates that Google will capture a colossal 29% of total global online ad spend in 2022. While YouTube is seeing revenue increases slow as TikTok steals market share, Google Cloud’s 43% growth was highlighted as ‘strong’ by CEO Sundar Pichai. Like Amazon, it’s proposing a 20-for-1 stock split in the summer and has its own share buyback scheme of $70 billion. While ad spending could decrease in the 2022 recession, the giant’s dominant market position makes it defensively resilient, despite being down 23% year-to-date. 3) Microsoft (NASDAQ: MSFT) Microsoft is the computer company that changed the world. When David Letterman asked Bill Gates what the internet was back in 1995, the audience laughed, and Gates replied ‘the new big thing.’ Early investors who were watching have been handsomely rewarded. In Q3 results, revenue rose 18% to $49.4 billion, representing exceptional growth and demonstrating the company’s market grip. Chairman and CEO Satya Nadella enthused that ‘digital technology will be the key input that powers the world’s economic output.’ Like and Amazon and Alphabet, its executive vice chair and CFO Amy Hood lauds its cloud platform as key to continued growth, saying ‘continued customer commitment to our cloud platform and strong sales execution drove better than expected commercial bookings growth of 28% and Microsoft Cloud revenue of $23.4 billion, up 32% year over year.’ Microsoft increased its share buybacks by 25% to $12.4 billion in the quarter yet remains down 24% year-to-date. Moreover, its proposed purchase of Activision could see further growth as the metaverse develops. 4) PayPal (NASDAQ: PYPL) PayPal, one of the first forays of serial inventor Elon Musk, is like Microsoft in that it benefits from first-mover advantage, but in the FinTech space. 2021 revenue soared by 18.4% year-over-year to $25.4 billion. And the company is projecting growth of between 11% and 12% in 2022; impressive, yet slower than the previous pandemic-charged two years. However, PayPal has indicated it expects to reach 750 million active accounts by 2025, a compound annual growth rate of 20%. And it expects to hit $1.4 trillion in payment volume in 2022, up from $1.25 trillion last year. With its share price down 60% year-to-date, the FinTech has a price-to-earnings ratio of 25, less than a third of pandemic levels. And despite increased competitors, PayPal’s current $90 billion market cap is whalelike compared to direct rivals like Payoneer, and almost twice that of Shopify. Further growth could come from its consumer-focused digital wallet, Venmo, which is already accepted by Amazon as a payment choice. 5) Meta Platforms (NASDAQ: FB) Meta, the owner of Facebook, WhatsApp, and Instagram, is the largest social media company in the world. With just shy 2 billion daily active users on Facebook alone, the social media giant is used 24/7 by more than a quarter of the world’s population. The NASDAQ-listed company has been hit hard by a series of headwinds in 2022; the rise of TikTok, falling active users earlier in the year, political scrutiny, Apple’s privacy changes, and investor dissatisfaction with its Metaverse focus. However, in Q1 results CEO Mark Zuckerberg enthused ‘we remain confident in the long-term opportunities and growth that our product roadmap will unlock…more people use our services today than ever before.’ Revenue rose by 7% year-over-year to $27.9 billion, and the company expects Q2 revenue to grow further to between $28 to $20 billion. The social media company also repurchased $9.39 billion of stock, with a further $29.41 billion authorized for further repurchases. Moreover, its headcount is up 28% on the year to 77,805 as it expands its Metaverse vision. Down 43% year-to-date, Meta is a NASDAQ market titan that may be oversold as the 2022 recession progresses. *Based on revenue excluding FX (published financial statements, June 2020). Charles Archer | Financial Writer, London 19 May 2022
-
Nvidia’s share price has plunged by close to 40% year-to-date. Can its upcoming Q1 results aid to reverse the bearish sentiments? Source: Bloomberg Shares Nvidia Price–earnings ratio Graphics processing unit Valuation Cryptocurrency When does Nvidia report earnings? NVIDIA is set to release its quarter one (Q1) financial results on 25 May 2022, after market closes. At the time of writing, expectations for its Q1 earnings per share (EPS) is coming in at $1.29, up 40.2% year-on-year (YoY). Revenue is also expected to increase to $8.1 billion, up 43.4% from a year ago. Nvidia earnings – what to expect For the upcoming earnings release, much will still depend on its two core business segments, gaming and data centres, to deliver. Recent outperformance for Advanced Micro Devices (AMD) results point to resilient demand in the data-centre space, which may bode well for Nvidia by highlighting ongoing tailwind from enterprises’ digital shift into artificial intelligence (AI) and high-performance computing. While revenue growth may be expected to moderate further on a YoY basis from the initial Covid-19 surge, an expected 43.4% increase still points to an above-trend growth rate over the past five years. Ahead, the huge untapped market for consumers’ upgrades to newer versions of its GTX-series graphics cards may continue to be a catalyst to underpin demand in the months ahead. That said, a key risk to watch may be the plunging cryptocurrency prices from April into May, which may be a potential roadblock for its gaming segment. This is considering that mining demand tends to fade in line with falling cryptocurrency prices, which translates to lesser demand for Nvidia’s cryptocurrency mining processor (CMP) sales. Bitcoin and Ether are currently trading down around 36% and 45% year-to-date at the time of writing. Nvidia’s earnings before interest, taxes, depreciation, and amortization (EBITDA) margin has remained resilient thus far, with its product technological advantage allowing rising costs to be passed on to consumers through higher average selling prices (ASPs). An area of uncertainty will be the potential easing of global chip shortages, which may make further rise in ASPs unsustainable. Recent statement from Nvidia in end-April shows that its graphics processing units (GPUs) are ‘restocked and reloaded’, which suggests that the peak of GPU shortages may be nearing or even past its peak. If this holds true, that may translate to some moderation in product pricing from its previous Covid-19-induced surge. This will place its margins on close watch over the coming months. Source: Nvidia Corporation Nvidia’s valuation The ongoing interest rate upcycle has put equities’ valuation in focus, particularly for growth names like Nvidia whose lofty valuation is driving greater sensitivity to the US Treasury yield movement. Recent heavy sell-off has brought about a re-rating for Nvidia’s forward price-to-earnings (P/E) valuation back to its pre-Covid-19 levels of 30.3, its lowest since May 2020. While its valuation may tower above its industry peers, an attributing factor for the premium is due to its above-average growth. Its five-year historical earnings per share growth stands at 52.8%, way above the semiconductor industry average of 15.9%. High market expectations are still being priced with an absolute forward P/E above 30 and failure to deliver in the upcoming earnings release may run the risk of further re-rating in share price closer to industry mean. Source: Nasdaq Source: Nasdaq Currently, the stock has 40 ‘buy’ recommendations, nine ‘holds’ and one ‘sell’. The Bloomberg 12-month consensus target price of $323.95 suggests a potential 87.6% upside from current price of $172.64. Nvidia shares – technical analysis On the four-hour chart, a bullish divergence on both the relative strength index (RSI) and moving average convergence divergence (MACD) indicators may increase the chances of a near-term relief rally, coming after the heavy sell-off of close to 45% since the start of April. This comes along with a bullish pin bar candlestick on the daily chart last week. That said, longer-term outlook will remain fragile with ongoing policy tightening set to cool economic growth momentum, which raise some doubts on whether any bounce can be sustaining. The longer-term downward trend for Nvidia’s share price remains intact, with the series of lower highs and lower lows imprinted since November last year. A look at the 100-day and 200-day simple moving averages (MA) also revealed a bearish crossover, marking its first time since 2019. A near-term relief may potentially drive a retest of the $206.00 level, where a previous support level will now serve as resistance to overcome. Near-term support may be at the $156.30, where some dip-buying was seen towards the end of last week. Source: IG charts Source: IG charts Yeap Jun Rong | Market Strategist, Singapore 19 May 2022
-
AMC share price volatility greatly elevated after Q1 results
ArvinIG posted a blog entry in Market News
AMC shares popped up 10% yesterday to close at $12.90 apiece. The indebted, but much-loved, cinema company experienced the covid-19 pandemic as a double-edged sword. Source: Bloomberg Shares AMC Theatres Debt Investment Interest Interest rates AMC (NYSE: AMC) shares have varied between $2 and $73 over the past couple of years, with huge volatility in every swing. On one hand, repeated lockdowns saw its cinemas shuttered for months at a time, sending revenue down 77% in 2020 and current debt north of $5 billion. On the other, ultra-loose monetary policy saw Reddit traders bestow upon it cultlike ‘meme stock’ status, seeing AMC’s share price soar far beyond fundamentals. This allowed the company to create millions of new shares, providing both the liquidity and creditor goodwill needed for recovery. But at $12.90, it’s now priced where it was before the short squeeze of May 2021. AMC share price: Q1 results Q1 results were better than expected. Revenue grew by 430% year-over-year to $785.7 million, beating the Refinitiv average analyst consensus for $743 million. Meanwhile, its net loss narrowed to $337.4 million or 65 cents a share, down from $567.2 million or $1.42 a share in the same quarter last year. Accordingly, adjusted EDITBA improved significantly, with a loss of $61.7 million compared to $294.7 million in Q1 2021. Chairman and CEO Adam Aron posited that Q1 results ‘represent AMC’s strongest first quarter in two full years. We continue on our pandemic recovery trajectory, more than quintupling revenues and improving adjusted EBITDA by nearly eighty percent compared to a year ago.’ Detracting from the threat posed by streaming, the CEO lauded recent successes of hits like ‘Spiderman: No Way Home’ and ‘The Batman’ as evidence of ‘the enduring appeal of theatrical exhibition.’ The CEO enthused that ‘when Hollywood releases films that moviegoers want to see, people flock to cinemas in huge numbers.’ And with Marvel, Jurassic World, Toy Story, Top Gun and Avatar franchise films yet to be released, he told investors ‘the theatrical box office during the remainder of 2022 is very exciting.’ Source: Bloomberg Where next for AMC shares? At its core, AMC has to increase revenue or profitability, and it has to do this by selling more cinema tickets. And the chain only sold 39.1 million in Q1, half that of pre-pandemic levels, and worryingly, down on the 59.7 million sold in Q4 2021. And with a brutal cost-of-living crisis exacerbated by sky-high inflation in AMC’s key markets, it’s having to struggle against the threat posed by streamers who arguably offer better value for money as consumers cut back on discretionary spending. But the big challenge for AMC is its $5.52 billion debt mountain. Even accounting for cash and equivalents, net debt stands at a whopping $3.84 billion. The cinema operator spent $82 million on interest payments in Q1 alone, and interest rates are only going to keep rising in the near term. However, Aron raised $950 million in Q1 to refinance first-lien debt and has made clear that none matures until 2023. To take advantage of its meme stock status, AMC has launched ‘multiple NFT programs’ and has started accepting cryptocurrency payments. It’s also spent $28 million on an 11% stake in NASDAQ-listed Hycroft Mining. Aron is also planning further outside-the-box investments, saying ‘I'd like to think there will be more third-party external M&A announcements going forward…our shareholder base has given us capital to deploy with the clear expectation that we are going to do exciting things.’ But most analysts remain sceptical of AMC stock. Wedbush analyst Alicia Reese has assigned it an underperform rating, with a price target of $4, citing its crypto launch, ongoing volatility, and unstable plans. Meanwhile, MKM Partners analysts have cut their rating to a sell with a 12-month price target of $1, noting that achieving ‘solvency came at a steep price.’ However, the Swiss National Bank recently increased its investment in AMC to 2.2 million shares, despite having made a heavy loss on its original investment. And Ray Dalio’s Bridgewater Associates disclosed it had bought up 27,100 AMC shares in its latest portfolio update. But AMC now has 516 million weighted-averaged shares outstanding, up from 104 million at the end of 2019. Moreover, Aron has sold $40 million worth of AMC shares since November 2021. This level of insider selling is hardly confidence-inspiring. For now, AMC’s share price is in the hands of emotion-driven retail traders. Only volatility can be predictably guaranteed. Charles Archer | Financial Writer, London 19 May 2022 -
The mobile phone giant says growing costs will hit earnings this year Source: Bloomberg Vodafone Group warned that inflation will negatively impact its earnings figures in the coming year. The mobile phone company told investors at its full-year results for 2022 that the current macroeconomic climate “presents specific challenges, particularly inflation” and that this is likely to “impact our financial performance in the year ahead.” Shares rose 2% on Tuesday to 120.3p but dropped back 1% to 118.76p on Wednesday. Revenues rose 4% to €45.58 billion, boosted by growth in service revenue in Europe and Africa. Operating profits increased by 11% to €5.7bn (from €5.1 billion last year) thanks to the increase in earnings and a reduction in depreciation and amortisation costs compared to the same period in 2021. Free cash flow also improved to €3.3 billion (from €3.1 billion last year) and Vodafone says its cost-cutting programme has delivered €1.5 billion of efficiencies over the past two full years. However, pre-tax profits fell to €3.95 billion (from €4.4 billion in 2021). Net debt also increased by 2.6% to €41.6 billion due to its €2 billion share buyback programme. Rising costs to hit the mobile phone giant “We delivered a good financial performance in the year with growth in revenues, profits and cash flows, in line with our medium-term financial ambitions,” chief executive Nick Read told shareholders. “Our organic growth underpinned a step-change in our return on capital, which improved by 170bps to 7.2%. “Whilst we are not immune to the macroeconomic challenges in Europe and Africa, we are positioned well to manage them and we expect to deliver a resilient financial performance in the year ahead.” Management expect adjusted earnings to come in at between €15 billion and €15.5 billion for the full-year 2023, while adjusted free cash flow is forecast to be around €5.3 billion. Meanwhile, Vodafone is negotiating a long-term energy deal with Centrica to keep costs down. Read says he is focused on improving the group’s performance in Germany, which he says is disappointing and pursuing merger opportunities with Vantage Towers. “These actions, together with the simplification of our portfolio and the ongoing delivery of our organic growth strategy, will create further value for our shareholders,” he said. Vodafone faces pressure from activist shareholders Vodafone has been under pressure from activist investor Cevian, led by Carl Icahn, which built up a stake earlier this year, to shake up the company and consolidate the European telecoms sector. Since then, a new majority shareholder – UAE-owned Emirates Telecom – has emerged with a stake of around 10% in the company. Emirates Telecom says it supports Vodafone’s strategy. Read says that he is committed to finding acquisition targets in Europe. However, nothing has yet transpired despite interest from Iliad in its Italian arm and negotiations with Spain’s Masmovil. The company is, nevertheless, currently talking to Hong Kong-based CK Hutchinson to combine its UK business with Three UK. Analysts at Citigroup initiated coverage on Vodafone shares, setting a price target of 165p. Vodafone shares have long disappointed. However, at 118.76p, they remain a long term buy on activist investor interest. *Based on revenue excluding FX (published financial statements, June 2020). Piper Terrett | Financial writer, London 19 May 2022
-
Hi @ash111, Apologies for the late reply. The quickest way to make a deposit is via card as it is credited instantly. Alternatively, you can transfer funds from one account to another. You can find further information and how to make a deposit and time frames on the post below: I hope that it helps - Arvin
-
HI @astrader78, Apologies for the late reply. Unfortunately, the payment team does not have a direct email or phone number. You can reach out to helpdesk.uk@ig.com. If you sent the documents it is possible that they are under review. All the best - Arvin
-
Today, we look at where the four markets are heading: AUD/USD, Nasdaq, Brent Crude Oil and Bitcoin Source: Bloomberg Forex Indices Commodities United States dollar AUD/USD Nasdaq Risk sentiment returned to the market this week and eased growing concern after the release of strong US retail and industrial data. In Australia, the RBA’s May meeting minutes put the possibility of a 40bps hike on the table for June and China’s plan to ease Shanghai out of its lockdown has supported energy prices in recent sessions. AUD/USD The concern for a US recession triggered by hotter than expected CPI data last week managed to push the AUD/USD to its lowest point since June 2020. Moreover, the demand for the Aussie dollar has been hit as iron ore prices tumbled, weighing heavily on the AUD as a commodity currency. This week the Australian currency was lifted as the RBA’s minutes increased the probability of a 40bps rate rise. The Australian dollar rose to 70.15 and delivered its third consecutive day of gains but was still more than 5% lower than a month ago. From a technical standpoint, the rise on Tuesday has helped the AUD/USD break through April's descending trend line while bringing the 20-day moving average around 0.705 into view. Current support sits at 0.6932. Source: IG Nasdaq U.S. stocks rebounded on Tuesday thanks to retail sales rising 0.9% last month, following a 1.4% surge in March. The data helped ease growing concern about the economic outlook which has lately fuelled pessimistic sentiment. Meanwhile, Federal Reserve chairman Jerome Powell reiterated in a public speech that he will 'keep pushing' to tighten the U.S. monetary policy until it is clear that inflation is in decline. Nasdaq led the advance on Wall Street by soaring 2.62%. Technically, the bounce has broken through the April trendline and brought the 20-day MA at around 12722 as a possibility. Looking forward, the line connected by previous lows can be viewed as a key support for the Nasdaq while the March low (12944) should be a key challenge in the near future. Source: IG Brent Crude oil The concern about supply and demand has pushed up oil prices in recent sessions. The ongoing conflict in Ukraine shows no signs of easing and with the expectations of further bans on Russian energy by the EU and US decisively means that a lack of supply will be a long-term norm for crucial energy. On the demand side, China recently announced it would bring normality back to 25 million Shanghai residents by mid-June. This wouold offset previous concern for a shrinking demand in oil even if the risk of a future lockdown can’t be ruled out. Brent Crude rallied sharply in the second half of last week and edged above the $110 level. The daily chart shows that the price is now sitting above the 20, 50, and 100 MA, suggesting a bull-biased sentiment is taking the lead. Source: IG Bitcoin Cryptocurrency has shown signs of stabilizing after a bloodbath last week wiped $200 billion from the market, with the prices of Bitcoin and Ethereum plunging to their lowest level in more than 12 months. The selling pressure for Bitcoin has shown some signs of easing this week following optimism resurfacing in the stock market. The short-term bullish idea has pushed the price up from its 18-month low level recorded last week at $25385 and is now back at 30k. The four-hour chart shows a clear uptrend for the price to bottom out from the recent low while encountering resistance near 30436. However, the long-term chart (weekly) suggests the price is staying way behind its short, mid and long-term moving averages. In other words, the bear-biased sentiment remains intact. Source: IG Source: IG Take your position on over 13,000 local and international shares via CFDs or share trading – and trade it all seamlessly from the one account. Learn more about share CFDs or shares trading with us, or open an account to get started today. Hebe Chen | Market Analyst, Melbourne 18 May 2022
-
AUSTRALIAN DOLLAR TALKING POINTS AUD/USD carves a series of higher highs and lows as it extends the rebound from the yearly low (0.6829), and fresh data prints coming out of Australia may fuel a larger advance in the exchange rate as employment is expected to increase for six consecutive months AUD/USD REBOUND TAKES SHAPE AHEAD OF AUSTRALIA EMPLOYMENT REPORT AUD/USD seems to have reversed course ahead of the June 2020 low (0.6648) amid recovery in global benchmark equity indices, with the exchange rate trading to a fresh weekly high (0.7041) as the Reserve Bank of Australia (RBA) Minutes reveals that “timely evidence from liaison and business surveys indicated that labour costs were rising in a tight labour market and a further pick-up was likely over the period ahead.” As a result, the RBA insists that “that further increases in interest rates would likely be required to ensure that inflation in Australia returns to the target over time,” and the update to Australia’s Employment report may generate a bullish reaction in AUD/USD as the economy is anticipated to add 30.0K jobs in April. At the same time, the Unemployment Rate is seen narrowing to 3.9% from 4.0% during the same period, and the ongoing improvement in the labor market may encourage the RBA to deliver a series of rate hikes over the coming months as the central bank acknowledges that “there is no contemporary experience as to how labour costs and prices in Australia would behave at an unemployment rate below 4 per cent.” In turn, AUD/USD may stage a larger recovery ahead of the next RBA meeting on June 7 as Governor Philip Lowe and Co. prepare Australian households and businesses for higher interest rates, and a further advance in the exchange rate may alleviate the tilt in retail sentiment like the behavior seen earlier this year. The IG Client Sentiment report shows 66.17% of traders are currently net-long AUD/USD, with the ratio of traders long to short standing at 1.96 to 1. The number of traders net-long is 6.18% lower than yesterday and 15.62% lower from last week, while the number of traders net-short is 12.24% higher than yesterday and 26.92% higher from last week. The decline in net-long position comes as AUD/USD climbs to a fresh weekly high (0.7041), while the jump in net-short interest has helped to alleviate the crowding behavior as 74.02% of traders were net-long the pair last week. With that said, another uptick in Australia Employment may fuel the recent series of higher highs and lows in AUD/USD as it fuels speculation for another RBA rate hike, but the rebound from the yearly low (0.6829) may turn out to be a correction in the broader trend with the Federal Reserve on track to normalize monetary policy at a faster pace. AUD/USD RATE DAILY CHART Source: Trading View Keep in mind, AUD/USD took out the July 2020 low (0.6877) after snapping the opening range for May, but the exchange rate appears to have reversed course June 2020 low (0.6648) as the recent rebound in price pulls the Relative Strength Index (RSI) out of oversold territory. AUD/USD carves a series of higher highs and lows amid the lack of momentum to break/close below the Fibonacci overlap around 0.6770 (38.2% expansion) to 0.6820 (50% retracement), with the move above the 0.6940 (78.6% expansion) area bringing the 0.7070 (61.8% expansion) to 0.7090 (78.6% retracement) region on the radar. Next area of interest comes in around 0.7130 (61.8% retracement) to 0.7180 (61.8% retracement) followed by the 0.7260 (38.2% expansion) region, which largely lines up with the 200-Day SMA (0.7265). Follow me on Twitter at @DavidJSong DailyFX provides forex news and technical analysis on the trends that influence the global currency markets. DISCLOSURES David Song, Currency Strategist, Daily FX May 18, 2022
-
US STOCKS OUTLOOK: S&P 500, Nasdaq 100 and Dow Jones post solid gains on Tuesday Strong April U.S. retail sales data helps improve market sentiment and morale This article looks at the key technical levels to watch for in the Nasdaq 100 over the coming days Most Read: Big Mistake Leads Technical Trader to Top Three Tools After a subdued performanceat the start of the week, U.S. stocks rallied on Tuesday, buoyed by improved investor morale, on hopes that the worst is over in terms of the recent sell-off and that risk assets will begin to stabilize in the near term. At the closing bell, the S&P 500 jumped 2.02% to 4,088, its best level in almost three weeks. The Dow, for its part, rose for the third day in a row, climbing 1.34% to 32,654, boosted by strong performances by Goldman Sachs, Home Depot and Boeing shares. Meanwhile, the Nasdaq 100 led the charge higher on Wall Street, soaring 2.62% to 12,564 on account of broad-based tech sector strength. Although stocks were already advancing in the pre-market session, gains accelerated after April U.S. retail sales data showed that American consumers kept their wallets open and maintained robust consumption despite rising inflation and falling real income. The solid numbers suggest that household spending, the main driver of economic growth in the country, remains resilient and can continue to support the expansion over the medium term, a good sign for second-quarter GDP and possibly beyond. In the afternoon, Fed Chair Powell’s comments on the central bank's tightening cycle and his strong resolve to restore price stability sparked volatility and briefly weakened the rally, but the reaction was temporary and ultimately reversed. After all the twists and turns, the three major equity benchmarks ended the session near their daily highs. Looking ahead, the economic calendar is thin for the rest of the week, so sentiment will likely dictate direction. That said, Tuesday’s upswing is welcome, but it doesn't change the fact that stocks are still down a lot so far this year and that the near-term trend remains negative in terms of technical analysis. In any case, to further improve sentiment and confirm that this is not another dead cat bounce, we would need to see a follow-through to the topside in the coming days. That will tell us that there is more confidence in the market and in the belief that the Fed will be able to engineer a soft landing of the economy. Focusing on the Nasdaq 100, despite the recent rebound, the tech index remains in bear market, down more than 25% from its November 2021 peak. For buying momentum to accelerate under current conditions, price must overcome the next critical resistance at 12,645. If we see a clear break above this barrier, the focus shifts up to the psychological 13,000 level, followed by 13,605, the 38.2% Fibonacci retracement of the 2021/2022 selloff. On the flip side, if sellers return to fade the rip and price turns lower, support lies at 12,200. If this floor is breached, a retest of the 2022 lows cannot be ruled out. NASDAQ 100 TECHNICAL CHART Nasdaq 100 Chart Prepared Using TradingView EDUCATION TOOLS FOR TRADERS Are you just getting started? Download the beginners’ guide for FX traders Would you like to know more about your trading personality? Take the DailyFX quiz and find out IG's client positioning data provides valuable information on market sentiment. Get your free guide on how to use this powerful trading indicator here. DISCLOSURE Diego Colman, Market Analyst, Daily FX May 18, 2022
-
Keeping ISA Account After Moving to Australia From UK
ArvinIG replied to Monkhouse95's question in IG Account Support - MyIG Help
Hi @Monkhouse95, Thank you for your post. If you have a Share trading account the below applies: UK to Australia: It is easier to open a share dealing account with the Australian office, the UK one would be closed after the shares are moved across. For an ISA account the below applies: For most countries besides the EU you can keep the ISA and continue to trade with the existing funds. However you will be prohibited from further subscriptions i.e. adding funds. The exception to this is a move to the US. Due to restrictions and what we can offer you would either need to transfer out or positions would be closed. For further information it would be best to reach out to helpdesk.uk@Ig.com or call 0800 195 3100. All the best - Arvin- 1 reply
-
- 1
-

-
Dividend tax on ISA account
ArvinIG replied to HarryP's question in IG Trading Support - Dealing Questions
Hi @HarryP, @gezmond, When you trade US shares you should have a pop up window prompting you to complete the W8-BEN form. If not you can find the form here: https://www.ig.com/uk/us-stocks Further information on: https://www.ig.com/uk/help-and-support/investments/share-dealing-and-isas/what-is-a-w8ben-form-and-why-do-i-need-one If your form is expired, you can complete the form on My IG > Settings > Dealing US stocks: I hope that it helps - Arvin
-
The outlook on gold is cautiously bullish while crude oil probes resistance at $114 and London wheat pauses below its £361 all-time high. Commodities Petroleum Wheat Gold Brent Crude European Union Gold stages a minor recovery rally Gold’s slip from its mid-April high at $1,998 has taken it all the way to yesterday’s low at $1,787 before it formed a Hammer on the daily candlestick chart and recovered towards the 200-day simple moving average (SMA) at $1,837 which is about to be reached. Next up the early May low can be spotted at $1,851 and the April-to-May downtrend line at $1,855 which may well cap again, however. Yesterday’s low was made right within the late December-to-January lows at $1,790 to $1,781 which unsurprisingly offered support. Failure at $1,781 would engage the December low at $1,754. While the late April high at $1,919 caps, the recent downtrend remains intact. Further up meanders the 55-day SMA at $1,923. Source: ProRealTime Brent crude oil flirts with $114 April high as traders eye EU ban The price of Brent crude oil continues to be underpinned by robust global demand as traders closely watch developments around a proposed EU ban on Russian oil which would tighten global supply further. Yesterday the European Union (EU) failed to pressure Hungary to lift its veto of a proposed oil embargo on Russia but despite this the price of Brent crude oil has risen four days in a row. It is being pushed towards its $114.00 April peak, a rise and daily chart close above which would lead to the late March high at $120.48 being next in line. If the price of oil were to struggle around the $114 mark, however, and slip back, the breached March-to-April downtrend line at $110.05 and also the 55-day SMA at $108.38 would be back in the frame. For now the bulls seem to be firmly in charge, though. Source: ProRealTime London wheat prices are briefly coming off their all-time highs Yesterday November 2022 London Wheat futures traded at their highest ever level of £361 per tonne after India announced on Saturday that it was closing its doors on wheat exports to cool local prices and ensure its supplies as a scorching heatwave curtailed output. This comes on the back of adverse crop conditions in Europe and the US on top of the war in Ukraine and has pushed the price of London wheat up by over 50% since the Russian invasion of Ukraine. The November 2022 contract has come off yesterday’s all-time high at £361 and closed a price gap from last week whilst remaining within its steep one-month uptrend channel. The lower channel line at £337 is likely to act as interim support, together with the 9 May high at £333. A rise above the £361 high seen yesterday may lead to the minor psychological 400 mark being targeted. Source: ProRealTime Axel Rudolph | Market Analyst, London 17 May 2022
-
Portfolio Tracker
ArvinIG replied to Phrilly's topic in Investments, share dealing, and Smart Portfolios
Hi @rotarymotor, The Trade analytics feature is in a Beta stage, the development team is adding functions and it is only available to CFD accounts. I will raise your feedback to add this tool for share trading and ISA accounts. I haven't heard about a time frame at this point. All the best - Arvin -
Hi @AlanT, Thank you for your post. You will need to download MT4 and login using your IG credential on the IG demo server. I would recommend reading through this page below: https://www.ig.com/sg/trading-platforms/metatrader-4/what-is-mt4-how-to-use-it I hope that it helps - Arvin
-
Hi @BubbaBubbaBubba, SMID should be live now. Thank you - Arvin
-
EUR/USD tries to stabilise above its January 2017 low with EUR/GBP and GBP/JPY also holding ahead of this week’s UK unemployment, inflation, and retail sales data. Forex Pound sterling Euro GBP/JPY Japanese yen United States dollar EUR/USD tries to stem its slide Last week EUR/USD dropped to $1.035 amid worries of a looming recession and the interest rate differential between the European Central Bank’s (ECB) and the US Federal Reserve’s (Fed) monetary policies. The cross dropped to a level last seen in January 2017 and by over 15% from its 2021 Covid-19 pandemic peak, before levelling out. The fact that the currency pair stabilised has probably come as no surprise to technical traders since multi-year key support seen between the March 2015, December 2016, and January 2017 lows at $1.0463 to $1.0341 is deemed to withstand the first test. Having said that, the downtrend remains firmly entrenched and as long as the early May high at $1.0642 isn’t overcome, the $1.035 to $1.0341 area is expected to eventually give way with the major psychological $1.00 mark, or parity, then being targeted. Minor resistance above the 28 April low at $1.04723 comes in along the one-month resistance line at $1.05 and also at Thursday’s $1.0529 high. Source: IT-Finance.com EUR/GBP stabilises above 200-day simple moving average (SMA) ahead of UK data EUR/GBP’s decline off last week’s £0.8618 high earlier today found support at £0.8472, not far above the 200-day SMA at £0.8446, ahead of this week’s UK unemployment, consumer price index (CPI) and retail sales data. While the £0.8472 to £0.8446 support zone holds, a rise back towards the early and mid-May highs at £0.8591 to £0.8618 is on the cards. Were this resistance area to be overcome, the September peak at £0.8658 and also the late May and July 2021 highs at £0.8669 to £0.8671 would be next in line. Source: IT-Finance.com GBP/JPY decline looks to have ended at last week’s low The slide in GBP/JPY seems to have ended at last week’s ¥155.61 low ahead of this week’s unemployment, CPI and retail sales data releases. From a technical point of view an Elliott Wave zig-zag correction, also called and a,b,c correction, may have ended at last week’s ¥155.61 low now that a brief rise above Friday’s ¥158.51 high has been seen. If so, a continued advance should eventually take the cross to above its April ¥168.43 peak. For this scenario to become more probable a rise and daily chart close above the one-month downtrend line at ¥160.86 should ideally take place this week with the wave ‘b’ high at ¥164.25 representing the next upside target. A drop through the current May trough at ¥155.61 would invalidate the bullish technical set-up and probably provoke a resumption of the recent descent towards the December-to-May uptrend line at ¥152.46. Source: IT-Finance.com Axel Rudolph | Market Analyst, London 16 May 2022
-
The gaming company unveiled first-quarter results last week Source: Bloomberg Shares Roblox Investor Free cash flow Jefferies Group Investment Losses at Roblox rose 16% to $161.7 million in the first-quarter from $136.1 million last year as the benefit of Covid-related bookings waned. However, revenues at the popular US children’s gaming platform jumped 39% in the first-quarter to $537m, compared to the same period last year ($386.9 million). That said, Roblox admitted it expects to post losses “for the foreseeable future” even as it anticipates “generating net cash from operating activities”. Shares in the gaming company fell 4% on the day of results, although they recovered some ground on Monday. "We remained focused on delivering our innovation roadmap to unlock the full potential of the Roblox platform and drive long-term returns for investors," David Baszucki, Roblox’s chief executive officer told investors. "Over the past two quarters, we have launched a number of notable innovations, including spatial voice and layered clothing that will continue driving user growth, engagement and monetization." Roblox’ Covid fillip wanes Hours engaged increased by 22% to 11.8 billion from the same period in 2021, while daily active user numbers rose by 28% to 54.1 million in the quarter. Roblox says two-thirds (77%) of its users hail from outside North America, while users aged over 13 increased by 38% year-on-year and accounted for over half of daily active users. However, bookings in the first-quarter fell 3% to $631.2 million due to tough comparative figures in the same period last year when stronger Covid restrictions were in place. These figures were lower than analysts had forecast. In the first-quarter, free cash flow stood at $104.6 million, while earnings before interest, tax, depreciation and amortisation fell to $67.9 million. Management says both figures fell “significantly” compared to last year as the company invested in headcount, infrastructure and developer expenses but bookings remained flat. Riding the Metaverse wave Roblox looks set to continue its investment going forward and is focusing heavily on the metaverse, which management believe is “an uncommon opportunity”. Indeed, the company told investors in its shareholders’ letter that it thinks this “new form of communication” will change how people connect with each other and that over the long-term, the opportunity is ultimately “potentially larger and more profound” than other innovations in social networking. Analysts at broker Jefferies raised their second-quarter earnings forecasts to losses of -$0.25 per share (from $0.30 a share). They currently have a $50 price target on the shares. Roblox shares are down 51% in the past year to $34.39 and remain well off their highs of $141.60 seen in November 2021. They could travel the crest of the metaverse wave and many other US companies, such as Meta and even Wendy’s, are investing heavily in the virtual world. However, with losses likely to continue for some time, it’s unclear when the shares may receive a much-needed short-term boost. Trade over 16,000 international shares from zero commission with us, the UK’s No.1 trading provider.* Learn more about trading shares with us, or open an account to get started today. *Based on revenue excluding FX (published financial statements, June 2020). Piper Terrett | Financial writer, London 17 May 2022
-
Peloton shares hit their lowest price on record last week after sobering Q3 results saw CEO and President Barry McCarthy label the turnaround effort ‘emotionally draining.’ Source: Bloomberg Shares Revenue Peloton Cash Investor Apple Inc. Peloton's (NASDAQ: PTON) share price peaked at $163 in December 2020 but fell to as little as $12 during intra-day trading last week. A Sex and the City heart attack, safety investigations by the US Department of Justice, and stinging criticism by 5% shareholder Blackwells Capital's Chief Investment Officer Jason Aintabi haven’t helped. Neither has the axing of 2,800 staff earlier this year, some without notice. And despite recovering to $16 today, Peloton’s $5 billion market cap is a tenth of the $50 billion value it commanded just two years ago. Peloton share price: Q3 FY22 results Peloton’s Q3 revenue fell by 24% year-over-year to $964.3 million, as connected fitness revenue from the physical sales collapsed by 42% to $594.4 million. The company blamed ‘a reduction in consumer demand exiting the pandemic’s peak’ and ‘higher than anticipated Tread+ returns totaling $18 million related to our May 2021 product recall.’ On the other hand, subscription revenue rose by 55% year-over-year to $369.9 million. Subscriptions now account for 38.4% of total company revenues, more than double the 19% of Q3 FY21. Peloton is ‘taking steps to accelerate (this shift) with our hardware price changes and FaaS strategy.’ Subscription gross profit was $252.1 million in Q3, representing 63% year-over-year growth, while subscription gross margin rose from 64.6% to a healthy 68.1%. However, gross profit fell by 59% year-over-year to $184.2 million, driven by price reductions, higher delivery outlays, port and storage costs, and recall expenses. Worse, operating expenses more than doubled to $920 million, representing 95.4% of the quarter’s revenue compared to 36.3% a year ago. This led Peloton to declare an overall net loss of $757.1 million net loss. For context, it only lost $8.6 million in the same quarter last year. Source: Bloomberg Where next for Peloton shares? It was a tale of two quarters for Peloton. On one hand, equipment sales are collapsing alongside consumer demand, as the pandemic ends amid a rising cost-of-living crisis. On the other, subscriptions are soaring, as the affordability of its digital-only offering gains in popularity. McCarthy advised that ‘turnarounds are hard work. It’s intellectually challenging, emotionally draining, physically exhausting, and all consuming. It’s a full contact sport.’ The CEO highlighted stabilising cash flow as a key priority, warning ‘inventory has consumed an enormous amount of cash, more than we expected’ but consoling that ‘the obsolescence risk is negligible, and we believe the inventory will sell eventually, so this is primarily a cash flow timing issue, not a structural issue.’ Bernstein analyst Aneesha Sherman concurs, saying ‘it's about cash flow buffer in an environment where supply chain logistics and storage of these bikes is getting more and more expensive…hardware sales were half of what they were a year ago, and hardware inventory is double what it was a year ago.’ UBS analyst Arpine Kocharyan thirded the sentiment but expects investors to be primarily concerned about Peloton’s short-term ability to preserve cash flow and liquidity. McCarthy warned that Peloton’s $879 million in unrestricted cash left it ‘thinly capitalized,’ and has signed a $750 million loan agreement with JP Morgan and Goldman Sachs. Moreover, The Wall Street Journal reports Peloton is courting institutional investors to take a 15-20% stake to help improve cash flow. Of course, market titans like Apple or Amazon might spot an opportunity to purchase significantly more. Peloton ranks second behind Apple in February’s Prophet Brand Relevance Index, while McCarthy argues its sub-1% subscriber churn rate is ‘the best I’ve seen.’ The CEO aspires to see Peloton increase its user base to 100 million members, up from the current 7 million, but admits ‘it’s a long, long way from where we sit today.’ New initiatives to create growth include expanding deals with third party retailers, more aggressively marketing its digital-only app, growing in international markets, and escalating its Fitness-as-a-Service model. Encouragingly, April price changes could deliver ‘roughly $40 million of incremental revenue monthly,’ as the rate of subscriber growth increases off the back of cheaper physical sales. BMO Capital Markets analyst Simeon Siegel believes management is in a paradox, noting ‘the company continues to suggest with their words that they know they need to turn around,’ but conversely ‘holding onto this notion that their growth story is their North Star.’ And with revenue expected to fall by 29% in this quarter to between $675 to $700 million, investor patience may start to wear thin. Go short and long with spread bets, CFDs and share dealing on 16,000+ shares with the UK’s No.1 platform.* Learn more about trading shares with us, or open an account to get started today. * Best trading platform as awarded at the ADVFN International Financial Awards 2021 Charles Archer | Financial Writer, London 16 May 2022
-
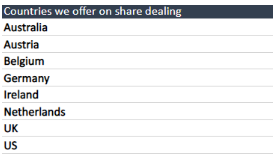
Hi @NaveedX, Unfortunately, on Share trading accounts we do not offer Canadian stocks. Here is the list of countries that we can add : All the best - Arvin
-
Hi @BubbaBubbaBubba, Your request has been submitted All the best - Arvin
-
Watchlist charts losing saved indicators
ArvinIG replied to NickW-uk's question in IG Technical Support - Platform and App Help
Hi @NickW-uk, Thank you for your post. We haven't received similar feedback from other clients. Could you please try to delete your cookies and empty your cache? Does it happen on other browser? Feel free to reach out to helpdesk.uk@ig.com, our IT team might have solution for the issue your are facing. All the best - Arvin -
Hi All, Thank you for your posts. You can't remove the crosshair on the charts. I will forward your feedback to the relevant department to be reviewed. All the best - Arvin


