

ArvinIG
-
Posts
1,728 -
Joined
-
Last visited
-
Days Won
23
Content Type
Profiles
Forums
Blogs
Events
Community Tutorials
Store
Posts posted by ArvinIG
-
-
8 hours ago, Marteen said:
I use MT4 SpreadBetting account and there is USOIL instrument...... what is this instrument based on ? What market I actually bet on ??
As I write this, April CME futures is around 107.30 , May around 104.12 and your "USOIL" is 105.10 !
Hi @Marteen,
Could you please share a screenshot of your MT4 charts with us?
We will be able to have a look and come back to you.
Thank you - Arvin -
8 hours ago, DarkMatter731 said:
Name of stock: KFA Mount Lucas Index Strategy ETF
Name of Stock Exchange: NYSE
Leverage or Share dealing: Share dealing (would also like the option to leverage)
Ticker: KMLM
Country of the stock: United States
Market Cap: $44,697,048
8 hours ago, DarkMatter731 said:Name of stock: The Core Alternative ETF
Name of Stock Exchange: NYSE
Leverage or Share dealing: Leverage
Ticker: CCOR
Country of the stock: United States
Market Cap: 285,931,600.03
Hi @DarkMatter731,
Both ETF request were submitted.
All the best - Arvin -
4 hours ago, mcxyz said:
I bought £9000 of Linde plc at £2.65 each but my account shows the number of shares as +38. Does anyone know why this is instead of giving the correct number?
Hi @mcxyz,
It is likely that you order was filled under a Day expiry. At the end of the day you order will be partially filled if it was not filled earlier, and the order will be closed. Therefore only 38 shares were available at the end of the day. You can place a Good'til Cancelled order , your order will stay open until filled. But keep in mind that a commission applied every time that your order is partially filled as it is a deal.
I hope that it helps.
All the best - Arvin -
On 08/03/2022 at 22:37, Alex111 said:
I did it. What will happen after March 30? Will my account be blocked and my money confiscated?
Hi @Alex111,
The is no decisions made at this point as the situation is evolving day to day. For example Visa and MasterCard withdrawn their business in Russia. It will be more complicated to return funds back to cards.
Our team in charge of Payments and the Compliance team will have more information on the matter.
Thank you - Arvin -
Japanese yen may remain at risk to US Dollar despite Ukraine tensions; US inflation may continue surprising higher, keeping the Fed on the edge and USD/JPY faces an ascending triangle chart formation.

Source: BloombergUSD/JPY maintains its footing despite Russia’s attack on Ukraine, what’s next?
All things considered, the Japanese yen has not been holding up relatively well against the US dollar since Russia commenced its attack on Ukraine. Sure, you will find corners of the forex market where the anti-risk JPY absolutely crushed its major peers. These primarily include the Euro and British Pound. Meanwhile, the sentiment-linked Australian and New Zealand dollars soared against JPY.
EUR and GBP, which soared as tensions in Ukraine cooled in recent days, still remain vulnerable to escalation risk. AUD and NZD have been gaining despite their sensitivity to deteriorating risk appetite, likely due to rising commodity prices. In my eyes, this leaves yen crosses like EUR/JPY, GBP/JPY, AUD/JPY and NZD/JPY vulnerable to heightened volatility. USD/JPY could be a better defensive play.
On the 4-hour chart below, USD/JPY can be closely seen following the spread between United States and Japanese 10-year government bond yields. Both currencies tend to take on a ‘haven’ role in forex markets. As Russia invaded Ukraine, traders flocked to both fiat units. What gave, and still likely does, the Greenback an edge over the yen is a hawkish Federal Reserve.
Unfortunately for the central bank, the crisis in Ukraine is propping up commodity prices, especially oil, acting as a supply shock. This will likely boost inflation in the near-term, leaving the Federal Reserve in a tough spot. On Thursday, headline US CPI is expected to clock in at 7.9% y/y for February, up from 7.5% prior. A few firms are also predicting prices to rise 8%.
Despite tensions in Ukraine, the Fed is all set to raise benchmark lending rates next week, with quantitative tightening to likely follow soon. High inflation in the near-term may thus continue to favor the US dollar relative to the Japanese yen, especially if front-end Treasury yields remain elevated. The 2-year rate just closed at its highest since late 2019, clocking in at 1.66%.
USD/JPY versus US-Japan 10-year government bond yield spreads

Source: TradingViewUSD/JPY technical analysis daily chart
On the daily chart, USD/JPY appears to be trading within the boundaries of an ascending triangle chart formation. The pair is approaching the ceiling of the triangle, which sits around 116.35. A breakout to the upside may open the door to uptrend resumption, exposing the 100% and 123.6% Fibonacci extensions at 117.29 and 118.19 respectively. Then the December 2016 peak at 118.66 will kick in.
In the event prices turn lower, the floor of the triangle, which is a rising trendline, may maintain an upside focus. Still, a breakout under the triangle could have bearish consequences. Such an outcome would place the focus on the current 2022 low at 113.47 before the 112.53 – 112.83 support zone kicks in.

Source: TradingViewThis information has been prepared by DailyFX, the partner site of IG offering leading forex news and analysis. This information Advice given in this article is general in nature and is not intended to influence any person’s decisions about investing or financial products.
The material on this page does not contain a record of IG’s trading prices, or an offer of, or solicitation for, a transaction in any financial instrument. IG accepts no responsibility for any use that may be made of these comments and for any consequences that result. No representation or warranty is given as to the accuracy or completeness of this information. Consequently, any person acting on it does so entirely at their own risk.
Daniel Dubrovsky | Currency Analyst, DailyFX, San Francisco
10 March 2022 -
Asia-pacific markets eye rebound after US stocks surge on war risk pullback; Chinese new yuan loans data for February seen falling from record high and BTC/USD looks primed to test the 100-day SMA after breaking 40,000.

Source: BloombergThursday’s Asia-Pacific outlook
Bitcoin pushed higher overnight as US stocks rallied after dip buyers moved off the sidelines and hit the buy button. BTC/USD rallied nearly 10% while the benchmark S&P 500 index closed 2.6% higher, its best single-day percentage gain since June 2020. The safe-haven US dollar retreated by more than 1%, and WTI crude prices fell 12% through the New York trading session. Iron ore and other industrial metal prices pulled back but not enough to drag AUD/USD lower.
Asia-Pacific stocks will likely benefit from the risk-on tone. China’s tech-heavy CSI 300 index will look to break a 6-day losing streak. Asian equity markets are thought to be relatively insulated from Western markets regarding Russian sanctions, but the pullback in market sentiment proved too much for prices over the past week. A major risk driver was Ukrainian President Zelensky’s speech overnight when the embattled President renewed his desire to negotiate an end to the war with Russia.
China will report new yuan loans data for February today, with the figure expected to drop to CNY1.45 trillion from January’s record high CNY3.98 trillion, according to a Bloomberg survey. The pullback from January isn’t unusual given seasonal factors that encourage Chinese lenders to front-load loans in January. Today’s data follows inflationary gauges released yesterday that showed factory-gate prices easing from the prior month although still elevated historically.
Elsewhere, bitcoin and other major cryptocurrencies may continue gaining today as traders evaluate US President Joe Biden’s executive order (EO) aimed at regulating the industry. The EO appears much less intrusive than some feared, with it mainly directing federal agencies to evaluate crypto's role in money laundering and terrorist groups. One bright point is that it instructs the Commerce Department to research how cryptocurrencies might help support US competition in the global economy. Overall, it appears the government is taking an approach to coexist with crypto, not stamp it out.
Australia’s March consumer inflation expectations crossed the wires at 4.9% this morning, up from 4.6% in February. Final building permits for January are due out later. Outside of Chinese lending data today, the economic calendar offers little in the way of potentially impactful events. However, the European Central Bank is expected to hold rates steady tonight, and US inflation data will follow later in the evening.
BTC/USD technical forecast
BTC/USD pierced above the 40,000 psychologically level overnight, and prices look primed for an attack on the falling 100-day Simple Moving Average (SMA). A break above that level would open the door to test the high-profile 200-day SMA, with potential intermediate resistance from the 61.8% and 78.6% Fibonacci retracement levels. Alternatively, a pullback will put the 40,000 level back into focus as potential support. The MACD oscillator is on the cusp of crossing above its signal line, a bullish momentum sign.
BTC/USD daily chart

Source: TradingViewThis information has been prepared by DailyFX, the partner site of IG offering leading forex news and analysis. This information Advice given in this article is general in nature and is not intended to influence any person’s decisions about investing or financial products.
The material on this page does not contain a record of IG’s trading prices, or an offer of, or solicitation for, a transaction in any financial instrument. IG accepts no responsibility for any use that may be made of these comments and for any consequences that result. No representation or warranty is given as to the accuracy or completeness of this information. Consequently, any person acting on it does so entirely at their own risk.
Thomas Westwater | Analyst, DailyFX, New York City
10 March 2022 -
1 hour ago, wfred said:
Let’s say US30 is at 33000 now. I would like to enter a long trade 33000 but not now only when 33100 is hit. So how to set an order that when price hits 33100 it will place my buy order at 33000?
Hope someone can advice.
Thank you.
Hi @wfred,
If I understand your question correctly, you can't place an order to place another order. If you are going long you would buy at lower price so 33000 and sell at higher price 33100.
Feel free to add some clarifications.
All the best - Arvin -
On 28/02/2022 at 20:48, Robhalo said:
When are restrictions on buying Polymetal shares going to be lifted on IG?
They are Cyprus based.
12 hours ago, Occam said:I want to second this question with the addition of the Evraz shares. Is there going to be something of an update from IG or means to be updated once the restrictions are lifted?
Hi @Robhalo @Occam,
There isn't any update at this point, the matter is reviewed continuously. We will provide you with further information as soon as possible.
Thank you for your patience - Arvin -
After recent losses, EUR/USD and GBP/USD have pushed on in early trading, recouping some lost ground, while USD/JPY is moving higher for a third day.
EUR/USD edges higher
EUR/USD has made some headway from its recent lower low, and might be in the process of building a short-term rebound.
Having been so overstretched to the downside, a short-term recovery could be quite swift, but it will need to make much more progress above $1.12 to really establish a more neutral view that could prompt a longer-term turnaround.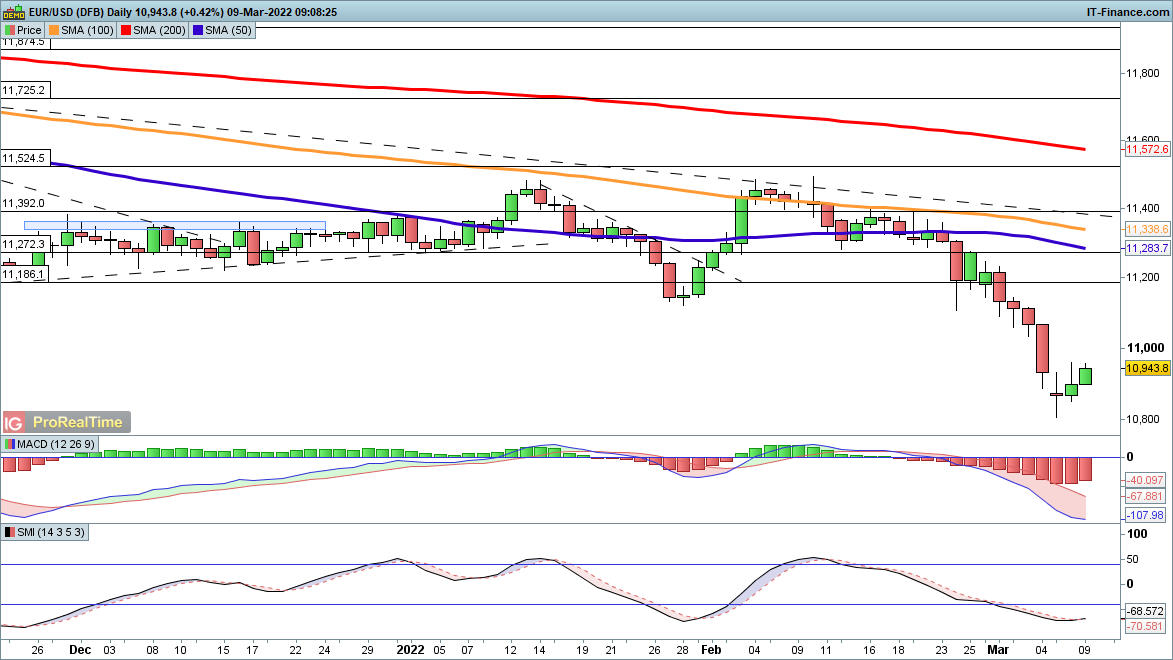 Source: ProRealTime
GBP/USD stabilises after losses
GBP/USD price has managed to edge up from $1.31, potentially putting a recovery back towards steep trendline resistance into view.
This could take it as far as $1.32. Above this, a more short-term bullish view will develop, as a counter-trend rebound gets underway.
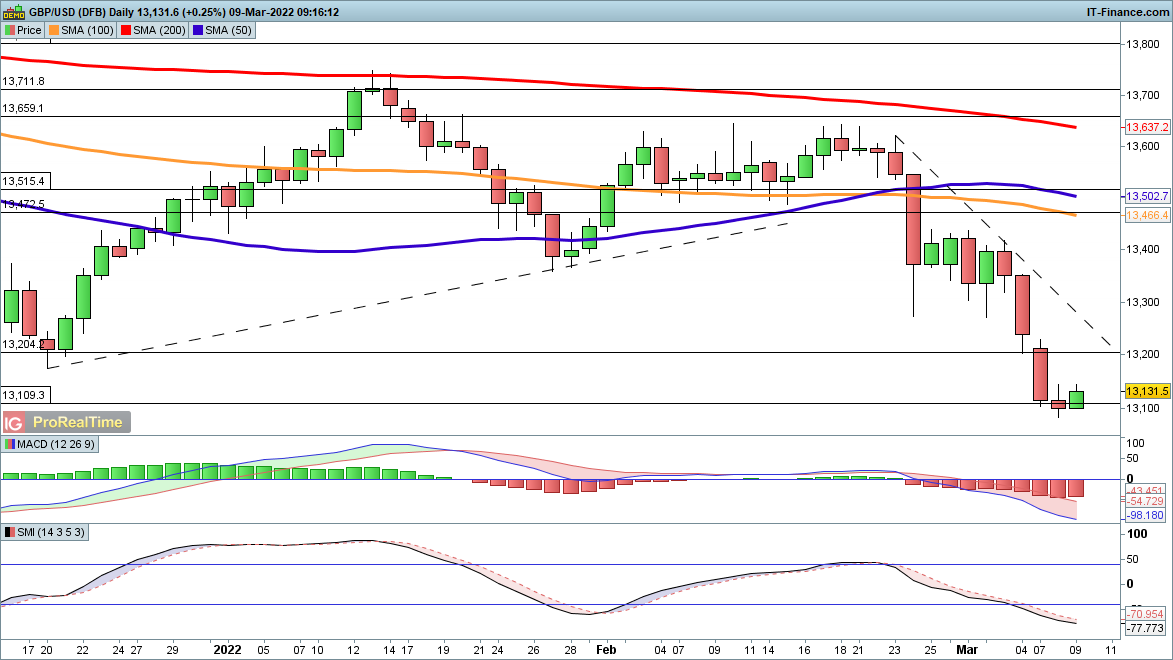 Source: ProRealTime
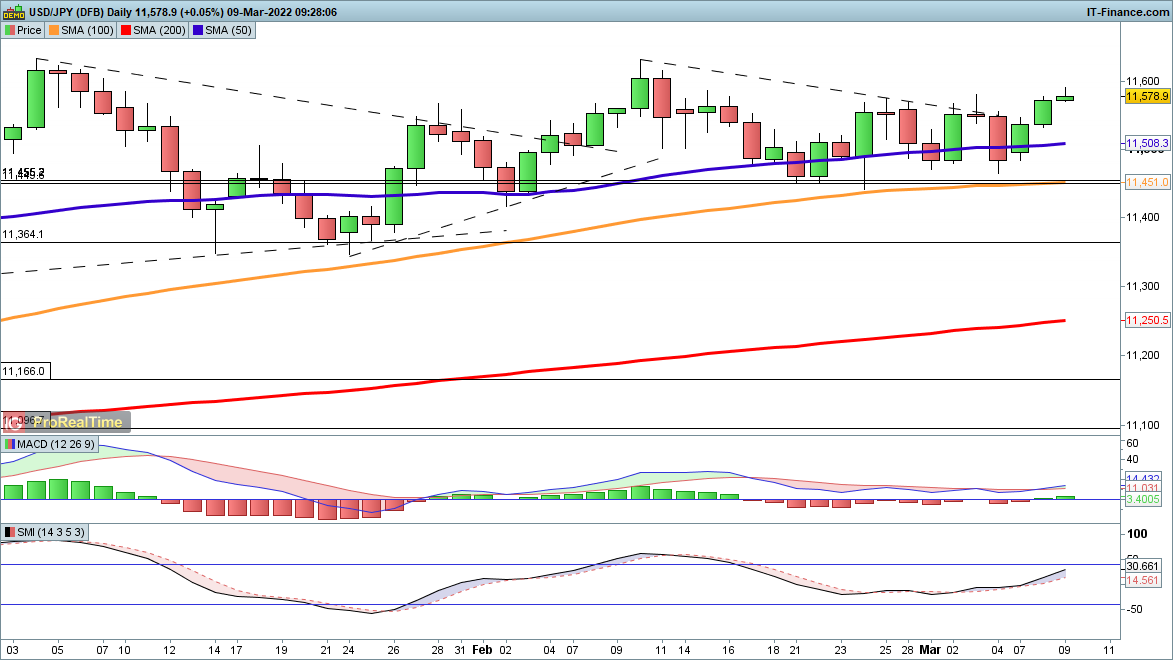
USD/JPY pushes to one-month high
The steady gains have been seen here with USD/JPY over the week so far, and having moved above the late February resistance around ¥115.70 a more cautiously bullish view prevails.
The 2022 highs towards ¥116.30 now come into view.
-
Wheat prices could be hitting record highs again this week. While Russia and Ukraine together generate 30% of global production, exports from both countries have all but ceased.

Source: BloombergAs Ukraine prepares to enter its third week of war with Russia, the outlook for commodities has been drastically altered. Metals Nickel, Palladium, Gold, and Aluminium are all at record or near-record highs.
Nickel trading is suspended at the London Metal Exchange after it squeezed to over $100,000/tonne. Brent Crude is at $127 a barrel, just $20 shy of its record high in July 2008.
And with the war continuing to escalate, new commodity records could be here soon.
Wheat price pressure
Less reported is the impact on global wheat prices. Global benchmark Chicago Wheat is at $12.29/bushel, dipping from its $13.63/bushel record last week. For context, the benchmark was trading under $8/bushel in mid-February. And it was only $5/bushel in mid-August 2020, as wheat prices were already under strong inflationary pressure exacerbated by the covid-19 pandemic.
Moreover, the limit price of $0.85 a day for wheat futures has been hit multiple times over the past few days, while further rises could be imminent as 61% of IG clients are currently long on the market.
According to the US Department of Agriculture, Russia was the world’s leading exporter of wheat in the last marketing year (ended June 2021), making up 20% of global exports of 39.1 million tons of wheat. With Ukraine also accounting for 10% of exports, a third of the global supply has now dried up.
Ports in Ukraine are closed, preventing shipments from both countries from departing. But the long-term problem is future supply; the physical impact of war is destroying crops, and many Ukrainian farmers who would usually begin planting wheat in Spring are instead fighting Russians or fleeing the country.
And helping drive record wheat prices is a squeeze on short positions held before the war in Ukraine began. AgResource says ‘the short squeeze in wheat has been breath-taking as the world lost 30% of its export capacity due to Russia’s war on Ukraine and closure of Black Sea supplies… Importers will draw down their own domestic stocks and scour the world for additional supply for April/May.’
And StoneX analyst Arlan Suderman believes ‘the Black Sea absence is already hitting hard as global importers desperately seek replacements.’ The impact on countries dependent on Ukrainian and Russian supplies will be acute. Egypt’s state procurer of wheat has had to cancel two orders in the past week for overpricing and because companies are refusing to sell their supplies.
Mirette Mabrouk at the Middle East Institute believes that ‘bread is extremely heavily subsidized in Egypt, and successive governments have found that cuts to those subsidies are the one straw that should be kept off the camel’s back at all costs.’ But this will become increasingly difficult to maintain.
Wandile Sihlobo at the Agricultural Business Chamber of South Africa says African countries imported $4 billion of agricultural products from Russia in 2020, 90% of which was wheat. The continent is being forced to source this supply elsewhere, dricing up prices.

Source: BloombergFertilising further problems
Russia also produces 13% of the global total of potash, phosphate and nitrogen-containing fertilisers, amounting to some 50 million tonnes. And the country’s Ministry of Industry and Trade has put restrictions on some exports of fertiliser and fertiliser ingredients, which is being compounded by insurers who are refusing to cover Russian exports for fear of a future embargo.
Russian gas, another essential component of fertiliser manufacturing, is also at record prices and under threat of future sanctions. Fertiliser prices are already surging close to £1,000, up from around £650 last week, as farmers stockpile fearing continued price hikes.
The National Farmer’s Union says prices for nitrogen fertiliser are already up 200% since last year, leaving famers forced to buy less, leading to a lower yield production, further driving up wheat prices. Julia Meehan at commodity agency ICIS argues ‘all everybody is talking about is availability (of fertiliser). There are huge concerns.’
And Yara International CEO Svein Tore Holsether believes ‘it’s not whether we are moving into a global food crisis – it’s how large the crisis will be.’ He maintains that ‘we were already in a difficult situation before the war... and now it's additional disruption to the supply chains and we're getting close to the most important part of this season for the Northern hemisphere, where a lot of fertiliser needs to move on and that will quite likely be impacted.’
Ukraine is oft-cited as ‘the bread-basket of the world;’ its national flag a field of wheat under a blue sky. With supply collapsing, the wheat price could soon hit new highs.
Over 35 commodities at your fingertips – trade spot, futures and options plus invest in stocks and ETFs all on one award-winning platform.* View our commodities offering or begin trading now.
* Best trading platform and best trading app as awarded at the ADVFN International Financial Awards 2021
Charles Archer | Financial Writer, London
10 March 2022 -
18 minutes ago, Bossako said:
Hi, I'm new here. I have a question how will I know the current leverage in my open position in CFD?
Hi @Bossako,
On the Position screen you can see the Margin on your account:
Make sure that Margin is ticked on the list to be displayed.
I hope that it helps.
All the best - Arvin -
Gold has raced up as nervy markets see scarcity from Russian sanctions; real yields have gone lower while haven assets like gold have benefited and fed rate rises priced in for next week.

Source: BloombergGold has rallied to its highest level since August 2020 as pandemonium has gripped markets in the fallout from Russia’s invasion of the Ukraine.
Many Western countries are looking at imposing various sanctions against Russia and the commodities that they export are seeing the largest gains. These include oil, gas, nickel, copper and of course gold.
In reality though, gold has not seen the size of gains that these other markets have experienced. This is despite other tail winds supporting the precious metal.
Real yields in the US have been falling in the last few weeks as shown in the chart below. 10-year Treasuries have a notional yield of 1.79% while the market priced 10-year inflation rate expectation is 2.77%, to give a real yield of -0.98%.
Sinking real yields typically boosts gold prices as the alternative of investing in Treasuries becomes less attractive from a real return perspective.
US CPI will be published on Thursday and the market is anticipating an annual headline rate of 7.8% and 6.4% for the year-on-year core rate. Consistently high inflation could have ongoing implications for real yields.
The Federal Reserve is expected to raise rates by 25 basis points (bp) at their Federal Open Market Committee (FOMC) meeting next week.
The US Dollar has also benefitted from the uncertainty in markets and a more hawkish Fed has underpinned it. A strengthening USD normally works against a rising gold price, but that has been overwhelmed by the other factors already mentioned.
If the Fed sticks to its plan, it may not have much impact as it has been very well telegraphed. Any variation from a 25 bp hike could see further volatility.
Gold, US dollar (DXY) and US 10-year real yield
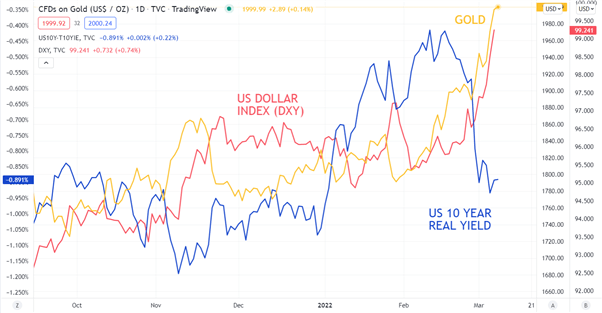
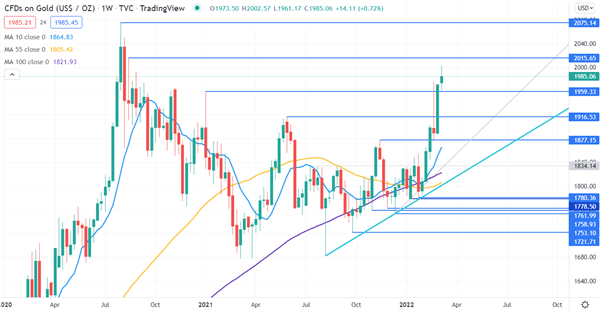
Source: TradingViewGold technical analysis
Today’s 18-month peak on gold opens up the possibility of a move to test the all-time high of 2,075.14, seen in August 2020.
Before that, it will need to clear a resistance level at another previous high of 2,015.65.
A bullish triple moving average (TMA) formation requires the price to be above the short term simple moving average (SMA), the latter to be above the medium term SMA and the medium term SMA to be above the long term SMA. All SMAs also need to have a positive gradient.
Not surprisingly, this move has seen all the short, medium and long-term SMAs turn to positive gradients.
Looking at the 10, 55 and 100-day SMAs, this could suggest that bullish momentum may still be in play as all criteria has been met for a TMA.
A move below the 10-day SMA might be worth watching for an indication that momentum could be fading.
Support on the downside could be at the pivot points of 1,959.33, 1916.53 and 1877.15
Source: TradingViewThis information has been prepared by DailyFX, the partner site of IG offering leading forex news and analysis. This information Advice given in this article is general in nature and is not intended to influence any person’s decisions about investing or financial products.
The material on this page does not contain a record of IG’s trading prices, or an offer of, or solicitation for, a transaction in any financial instrument. IG accepts no responsibility for any use that may be made of these comments and for any consequences that result. No representation or warranty is given as to the accuracy or completeness of this information. Consequently, any person acting on it does so entirely at their own risk.
Daniel McCarthy | Strategist
08 March 2022 -
EUR/USD and GBP/USD slide amid ongoing war in Ukraine but EUR/GBP stabilises as sterling weakness dominates.
EUR/USD continues its slide in wake of geopolitical tensions
EUR/USD so far dropped to $1.0806, close to the February and May 2020 lows at $107.78 to $107.67, amid the ongoing war in Ukraine and surging commodity prices which raise the prospect of slowing growth and strong inflation.
Further down the April 2020 low can be seen at $107.27 and the March 2020 low at $106.38.
Minor resistance sits between the November 2019 low at $1.1003 and the April 2020 low at $1.1019. Further resistance is found between the May 2019, January and February lows at $1.1106 to $1.1122.
 Source: IT-Finance.com
EUR/GBP probes resistance as sterling weakens across the board
EUR/GBP is testing its £0.8277 to £0.8305 previous support, now resistance, area, which stretches as far back as December 2016, in the face of the crumbling British currency. It is the second-worst performing currency of the past week and month as it proves to be a major loser in the financial fallout caused by the war in Ukraine and tightening sanctions on Russia.
The rise above £0.8305 may lead to an extension towards the 55-day simple moving average (SMA) and two-month downtrend line at £0.8366 to £0.8374 being seen in the course of this week.
 Source: IT-Finance.com
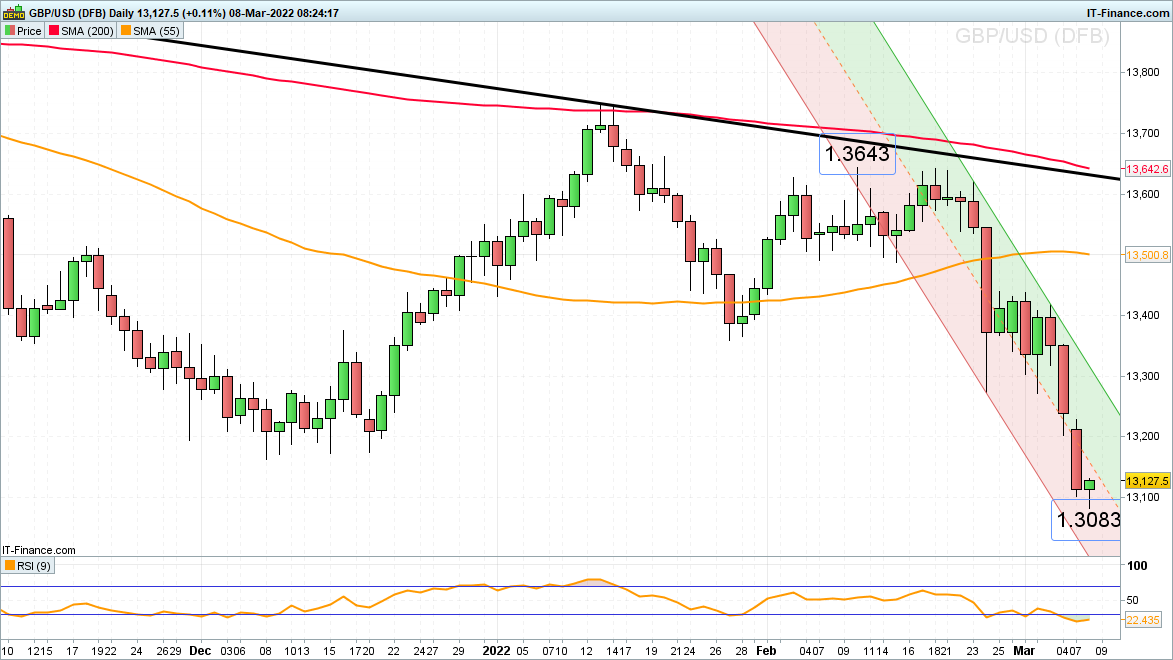
GBP/USD trades in 1 ¼ year lows
The Pound Sterling has dropped by over -3% in as many weeks as the war in Ukraine and increasing sanctions on Russia have weighed on the currency with it now trading at levels last seen in November 2020.
The cross is nonetheless trying to at least short-term stabilise around the 200-week SMA at $1.3122. This underpinned GBP/USD back in December of last year.
Any short-term bounce is likely to encounter resistance at the $1.3163 December low. Further, more important, resistance comes in at the $1.3273 24 February low. Below today’s low at $1.3083 lies the minor psychological $1.30 mark.
-
On 08/03/2022 at 03:30, bdbartman said:
I bought Pfizer ordinary shares (CDI) ****-div in November and sold them ex-div in February. Pfizer has paid its dividend but I have not received it. Why not?
Hi @bdbartman,
You should see the dividend for Pfizer reflecting on your account by now.
All the best - Arvin -
On 08/03/2022 at 04:37, lssmnc said:
Hi there,
I have opened some options last week and today (all expiring in Sep) and I now cannot close them and I get the icon saying "phone ig to trade". Why is that?
Hi @lssmnc,
Could you please clarify which are your positions that you are unable to close?
Thank you - Arvin -
On 08/03/2022 at 09:46, Goldengawd said:
Hi are there any 'quick keys' available on the IG Live Platform - is there a way to set them up? Thanks.
Hi @Goldengawd,
There isn't quick keys available so far on the platform. I will forward your feedback to the relevant department to be reviewed.
All the best - Arvin -
On 05/03/2022 at 11:41, espiral said:
The commission for trading in low-priced American or Canadian stocks is very high at 2 cents per share. Could you use a percentage or a flat rate?
Hi @espiral,
Thank you for your post and feedback. We will forward it to the relevant department to be reviewed.
It is usually 2 cents per share but there is a minimum charge of USD 10 or 15 depending where your are located.
All the best - Arvin -
6 hours ago, EnglishGuy said:
Hi I live in England but I make some money from YouTube and the Android and Apple app markets which are USA based. I am a UK resident so I pay my tax over here in the UK.
I want to deal in some USA shares. It asks me to fill out the form on "Dealing US stock (W-8BEN)" .
One questions asks "Are you receiving income that is effectively connected with the conduct of a trade or business in the U.S.?"
I am receving a bit of income from US companies. So if I click yes to this question then I cannot trade on US companies on ig.com.Have I read this correctly? Or am I answering no to this question because I am not resident in USA?
Screenshot attached for info on what it says
Thanks

Hi @EnglishGuy,
Thank you for your post.
Unfortunately we do not provide support on how to complete the W-8BEN form as we do not know your exact situation and we do not have Tax advising knowledge. This form being issued by the IRS, you can have a look into https://www.irs.gov/pub/irs-pdf/iw8ben.pdf for further information.
All the best - Arvin -
6 hours ago, Campollo007 said:
Currently my account is denominated in Singapore dollars. I now wish to add funds from my euro bank account. Will I be able to manage that euro funding and trading in euro denominated things in euros to avoid conversions to from singapore dollars?
Hi @Campollo007,
You can open an additional CFD account with Euros as the base currency. The only conversion will be at the point of withdrawal unless you have a bank account in euros.
Once your CFD account opened , email IG and they will change your base currency, for you to deposit funds in euros.
All the best - Arvin -
16 hours ago, Alex111 said:
Hello. IG sent me an email saying that the account will be blocked in 30 days. When I try to withdraw money, it says that the request was successfully sent, but the money still remains in the IG account. Withdraw works or not? I can not understand
Hi @Alex111,
Due to recent imposed sanctions, payments to Russian residents have to go through enhanced due diligence from our compliance team. Reach out to helpdesk.en@ig.com to follow up on your withdrawal request. It is possible that the payment team require a Bank Statement.
All the best - Arvin
-
12 hours ago, zerocafeine said:
Hi all,
I have PRT Premium by IG and it's amazing, but now when I'm loking to make some screener I can see the option on screener is limitted (photo 01) and on a free PRT version with an other account I can see they have more option (photo 02), so that is normal or I do somethink wrong ?
Best Reguards


Hi @zerocafeine,
On ProScreener you should be able to see all exchanges that you have access to including lists and wachtlists.
Could you please send a report from both versions? Our IT team will be able to investigate and come back to you accordingly.
All the best - Arvin
-
On 28/02/2022 at 16:41, Naoto said:
Hello guysss, I was planning to learn cryptocurrency more. At the moment the only site that I was reading of due to a reference from a friend is in Learncrypto here: https://learncrypto.com/ . Do you guys have other suggestions for learning cryptocurrency? Thank you and hopefully it will help me a lot.
Regards,
Naoto Yoshida
Hi @Naoto,
You can have a look into that link : https://www.ig.com/au/cryptocurrency-trading/what-is-cryptocurrency-trading-how-does-it-work
All the best - Arvin
-
6 hours ago, Squirrel said:
I'm just starting out and have a budget of £1000 to invest, I have selected my shares and invested the money but upon further inspection I realise there is a £25 charge every quarter if there has been no additional purchases or activity on account. That might be negligible for someone investing larger amounts or constantly using their account but considering I plan on not touching my shares for about five years that becomes £500. Is there any way around this?
thanks
Hi @Squirrel,
The only ways around the custody fee would be to trade 3+ times more during the quarter or if you invest GBP 15,000 in an IG Smart Portfolio account. If you hold no positions you will also be exempted.
I hope that it helps.
All the best -Arvin -
1 hour ago, BrianC said:
I have funds available that I want to withdraw but the funds don't show up on available to withdraw, why is that?
Hi @BrianC,
When you sell stocks there is a settlement period usually 2 to 3 days. Once settled your funds will reflect in the Available to withdraw balance. Meanwhile, IG will you trade with these funds that is why it shows in the available funds.
You can finds furhter information on https://www.ig.com/au/help-and-support/deposits-and-withdrawals/withdrawals/how-long-does-it-take-to-withdraw-funds-if-i-have-sold-shares
I hope that it helps.
All the best - Arvin-
 1
1
-


Withdraw to php account
in New Client Trading Questions
Posted
Hi @Bossako,

If your bank account is in USD you can transfer back in USD. If your account is in another your USD will be converted to your bank base currency at best rate.
You can convert USD to your base currency on My IG > Live accounts > Currency conversion, you can also check the rate there.
All the best - Arvin