

ArvinIG
-
Posts
1,728 -
Joined
-
Last visited
-
Days Won
23
Content Type
Profiles
Forums
Blogs
Events
Community Tutorials
Store
Posts posted by ArvinIG
-
-
4 hours ago, MaximusFred said:
I do not manage to login using IG API Companion with Demo account. I get below error. I provide correct API Key, User Name and Password but I do not succeed. I do not understand what security issue there is? Invalid details?
Does anyone know what might be wrong?
HTTP 400
status: error
cache-control: no-cache, no-store
content-length: 61
content-type: application/json{ "errorCode": "error.security.invalid-details" }Hi @MaximusFred,
This error code is usually due to the fact that your account is locked due to password failure.
Please reach out to the helpdesk to unlock your account.
Thank you - Arvin
-
 1
1
-
-
On 09/04/2022 at 16:58, Lakpa said:
Hi Guys,
I am new to IG. Ans I use share trading account. I want to buy share but I can’t see any stop losses option. When I was using demo it was there but now its gone.
Thanks
Hi @Lakpa,
Thank you for your post.
On a Demo account you are using a Demo CFD account meaning that you are using leverage to get full exposure. On share dealing accounts orders are place directly on the market. Here are the options you have:
I hope that it helps.
All the best - Arvin -
On 09/04/2022 at 00:52, HarishM said:
Ok thanks. I hear ya,
I have one more question. I have Download MT4 and open MT4 CFD account.
How Ever, I am finding difficulties in Adding US 500 CFD and India 50 CFD. can u help me how can I add those in the market watch and what symbol I should insert there ?
Thanks

Hi @HarishM,
If you right click in the ‘marketwatch’ window and then select ‘show all", does it appear?
Please be aware that due to licensing constraints IG we’re withdrawing all products, including binary options, on the India 50 on Friday, 1 July 2022.
A restriction on opening trade was placed on Friday, 1 April 2022.
Thank you - Arvin
-
On 09/04/2022 at 01:22, amilio said:
hello. I have a share dealing account and almost all my trades are USA stock...I would like, to transfer some of my money, from my share dealing account to CFD account. but every time I try to transfer. my balance available to transfer is less than £10??? but i have a lot more in my account ..
how long do I need to wait, and make no trades, so I can transfer some money from my share dealing to CFD . account ?
thank you
Hi @amilio,
Once you sell shares you will need to wait for the funds to settle. You can find the settlement period on the dealing ticket in the info tab :
When you place an order, the funds required to open this order are put aside in case the order is triggered to allow the deal to happen.
If all your funds are settled and not used for an order, then they are available to be transferred.
I hope that it helps.
All the best - Arvin-
 1
1
-
-
On 09/04/2022 at 02:20, vitanova said:
I would like to know the process of getting my account verified after it was denied.
I have completed the verification test and nationality identification.
Would like to know the next steps on my account.
Thanks,
Vita.
Hi @vitanova,
It seems that your account application was denied as your answers do not meet the eligibility criteria.
Please reach out to newaccountenquiries.uk@ig.com if you would like to discuss your answers and follow up on your application.
All the best - Arvin -
10 hours ago, youljan said:
I almost can´t believe why it is not possible to subscribe to AMAZON streaming prices via Streaming API.
How shall I deal with the webAPI if shares are not supported?
Do you offer another (prime) solution for algo trading in equity ?
Hi @youljan,
Thank you for your post.
Unfortunately, we do not offer share prices due to exchange regulations. If you are interested in Auto Trading you can look into ProRealTime which can use CFD shares.
All the best - Arvin -
22 hours ago, fluffyman said:
how do i access online chat with an IG member of staff?
Hi @fluffyman,
You can access our live chat on the IG web page: https://www.ig.com/uk/welcome-pageThe live chat option will appear after a short moment on the bottom right hand corner.
Thank you - Arvin

-
On 01/04/2022 at 09:53, trader216 said:
Hi There,
My guaranteed stop position on MONY was automatically moved further away today and I am unsure why this happened. Are IG allowed to move my stop on my behalf to a less safe position when I didn't request it ?
Hi @trader216,
For IG to be able to investigate on your order and your stop you will need to reach out to helpdesk.uk@ig.com or use our live chat with your account details.
Thank you - Arvin -
On 04/04/2022 at 23:12, Phrilly said:
Looking for a way to keep track of the value of my portfolio over time. (get charts of the portfolio's overall value etc.)
I note that Sharesight would kind of do it, but at a cost.
Is there any way I can do that within IG or with an IG partner?
Cheers
Phil
Hi @Phrilly,
We do have a tool called Trade Analytics.
You can find further information on the link below:
https://www.ig.com/uk/trade-analytics-toolI Hope that it helps.
All the best - Arvin
-
41 minutes ago, stuartz said:
Hello Arvin
Yes thanks it fixed itself over an hour or so though today Im also having trouble. Today it has removed all my indicators. I will try later on today to see if it corrects itself. Its almost like your IT guys are fixing items and they stop working while its taking place.
Hi @stuartz,
We haven't heard of an issue removing indicators in AUS so far.
When similar issues pop up feel free to take a screenshot and reach out to helpdesk.au@ig.com.
Please try to delete your cookies and cache, it helps improving the performance of the web based platform.
All the best - Arvin -
19 hours ago, oscarchu1117 said:
I'm posting here since I have emailed support multiple times and received no response
Hi @oscarchu1117,
It seems that the document you sent over were transferred to the relevant department to be reviewed. Once reviewed they will be able to unlock your account.
Thank you - Arvin -
10 hours ago, HarishM said:
I understood. Thanks.
One more question, How can I change time zone in My IG's mobile app and Desktop site ?
Thanks.
Hi @HarishM,
The time zone is synchronised with your account location. A UK client will have UK time, AUS clients AEDT and so on.
Therefore you won't be able to change the time zone.
I will forward your feedback to the relevant department.
All the best - Arvin
-
12 hours ago, mariiiam said:Dear Sirs,Since I do not have any feedback from IG Helpdesk for last 2 weeks I decided to post my problem over here.Herewith I would like to mention some facts:1. On February 23rd, 2022 - IG informed me about closure of my account (account ID *****) .2. On March 6th, 2022 - I had to close my position resulting in sufficient loss3. On March 9th, 2022 - I sent a request for withdrawal of my funds to my bank account and provided with all requested statements for my actual bank account.4. Later on you asked me for the statement of my previous card that I used 2 years ago to make a transfer to IG.5. On March 20th I explained once again that Alfa card which I used for the transfer to IG in August 2020 is no longer valid, and that bank account is closed. And there is no way to submit the statement - as I have moved out to another country and I don’t live in Russia now, taking into account the current situation so I can’t visit the bank physically, therefore I can’t get access to my previous records.5. Also on March 20th - asked you once again to advise if there is any other solution to withdraw back my money (i.e. I could make a minimum deposit from my current account or card. Thus will allow you to verify my bank account and proceed with the payment), but still no feedback.6. At the same time I asked helpdesk on any Legal act, Regulation, etc regarding this problem but still no response.7. UK PM Boris Johnson warns against Russophobia, but my situation with IG money withdrawal shows opposite actions. Since I still do not have any feedback, suggestion or wire from IG UK.Please advise on the current status of my problem.Thank you in advance
Hi @mariiiam,
Thank you for your post, we will follow up on your query to get you the answers you are after.
Thank you - Arvin -
20 hours ago, nick123 said:
Tried to call 3 times this morning, selected option 1, wait for a few minutes , continually being told my call is important to them! , then I get cut off its like somone it manually hanging up calls, its one way to reduce call in queue but misses the point about being a helpdesk.
Whats going on.
Hi @nick123,
We are sorry to hear that you had difficulties reaching our helpdesk. If the phone wait is quite long you can use our Live chat feature on the IG website, which is usually quicker to reach.
Please let us know what is your query we will assist you here the best we can.
Thank you - Arvin -
4 minutes ago, HarishM said:
Hi Arrvin,
Thanks for Guidence !
I understood, my base currency is USD, then why my p&l is not showing in $ only. why this coversion create misunderstanding ? is there any way to make it show in USD only ?
-Harish
Hi @HarishM,
In your case it's showing up as GBP because your contracts are in GBP :
If you use open USD contracts you will have your P/L for each positions on USD. Unfortunately we can't change the P/L per position to USD.
I hope that it helps.
All the best - Arvin -
5 hours ago, kabuki said:
For Example
Lets say I am long 5 US 500 at 4500 a unit = £22,500
and the Balance of my account is £30,000
Why on earth would I be liable for ovenight charges?
Hi @kabuki,
The overnight funding is not linked to your account balance.
When placing a spread bet or CFD, you’re using leverage. This means you are effectively being lent the money required to open your position, outside the initial deposit you’ve paid. To keep your position open after 10pm (UK time), 4.50pm Sydney time for AUD-denominated products (indices and shares), an interest adjustment will be made to your account to reflect the cost of funding your position overnight.You don’t need to pay overnight funding for futures or forwards because we build that cost into the spread.
You can find further information here.
I hope that it helps.
All the best - Arvin
-
7 hours ago, HarishM said:
Hi,
Can anyone let me know the charges of trading CFD ? US500
is charges included in spread 0.4 for US500, or is there anyother charges apart from 0.4 spread ? if yes then pls let me know.
Thanks
Hi @HarishM,
On indices the spread is the charge, on top of that if the index is trading in USD for example and that your base currency is different then there will be conversion fees.
You can find further details on CFDs Indices charges on here.
All the best - Arvin-
1
-
-
6 hours ago, HarishM said:
Hi Guys, Newbie here,
I open IG Demo account for CFD and I made 3 demo trades. can anyone help me to understand the P&L ?

Its showing 2 trades have loss of 16.3 & 16.8 and one has profit of 0.2 - so total loss should be -32.90. but why its showing -45.03 at the bottom in total ?
Help me to understand this.
Thanks
Hi @HarishM,
You P/L is showing -45.03 because of the currency difference, it is in USD.
Once you are on this screen you can click on the filters next to " Market" as below:
If you change your P/L in GBP it should add up with the number you see per rows.
I hope that it helps.
All the best - Arvin -
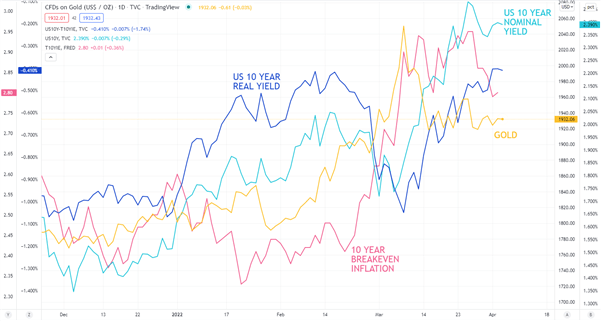
Gold has been moving sideways as sanctions fallout continues; real yields are inching higher on Fed action lowering inflation pricing and with low volatility.

Source: BloombergGold inched higher overnight on concerns of further sanctions against Russia from the EU. It was also reported that the London Metals Exchange (LME) had recently held discussions with stakeholders about the future of taking delivery of Russian metals.
It is believed that the LME will comply with any government regulation but will not go beyond that at this stage.
The backdrop for the precious metal remains challenging, with US real yields climbing higher. A higher real return from Treasury notes provides an interest-bearing alternative to the non-yielding yellow metal.
The recent push higher in real yields is the result of inflation expectations being lowered, as a result of the Federal Reserve appearing to get serious about tackling price pressures for consumers.
Until now, the market saw the Fed as being too dovish. Expectations for more aggressive tightening are growing, with only six Federal Open Market Committee (FOMC) meetings left in the year and eight hikes being priced in, this implies two hikes of 50 basis-points (bp).
While inflation expectations have been lowered, nominal yields have been steady. The benchmark ten-year bond remains near 2.40%, not far from the recent three-year peak of 2.56%.
Gold against US ten-year real yield, US ten-year nominal yield, US ten-year breakeven inflation
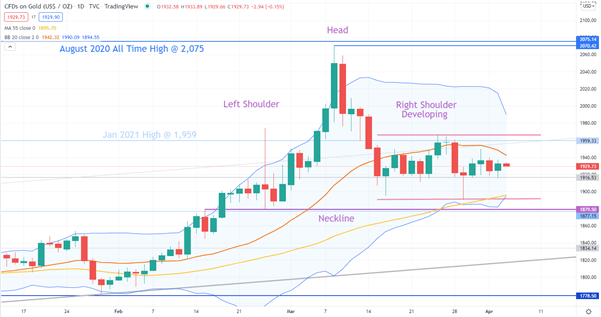
Source: TradingViewGold technical analysis
In March, the gold price rallied to a peak of 2,070.42 but fell short of the all-time high of 2,075.14 seen in July 2020 creating a Double Top. In the bigger picture, this failure to break higher could be a bearish signal.
A potential bearish Head and Shoulder pattern is emerging and a break below the neckline at 1,875.50 may confirm the pattern.
The price is currently consolidating in a tight range of 1,892 – 1965 as the right shoulder is developing. These two levels are potential support and resistance respectively.
This consolidation is bringing volatility lower as illustrated by the narrowing of the width in 20-day Simple Moving Average (SMA) based Bollinger Band.
The price is currently between the 20 and 55-day SMAs, further suggesting a range trade environment might persist for now.
Source: TradingViewFollow Daniel McCarthy on Twitter at @DanMcCarthyFX
This information has been prepared by DailyFX, the partner site of IG offering leading forex news and analysis. This information Advice given in this article is general in nature and is not intended to influence any person’s decisions about investing or financial products.
The material on this page does not contain a record of IG’s trading prices, or an offer of, or solicitation for, a transaction in any financial instrument. IG accepts no responsibility for any use that may be made of these comments and for any consequences that result. No representation or warranty is given as to the accuracy or completeness of this information. Consequently, any person acting on it does so entirely at their own risk.Daniel McCarthy | Strategist
05 April 2022 -
The FTSE 100, DAX 40 and Nasdaq 100 remain bid but are so far being capped by resistance over worries of the impact further sanctions on Russia might have on the outlook for European economies.
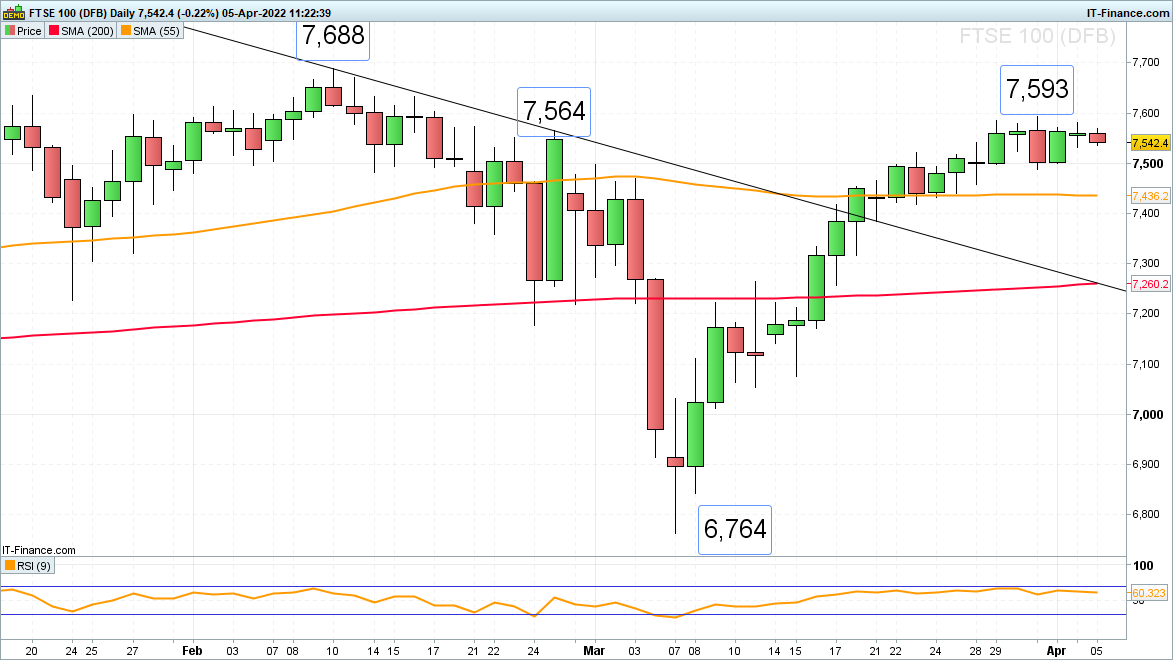
FTSE 100 range trades below its 7,593 late March high
The FTSE 100 continues to trade around its 25 February high at 7,564 but below its late March high at 7,593 as traders mull the prospect of further sanctions against Russia.
Nonetheless the trend continues to point upwards and a rise above last week’s high at 7,593 would target the February peak at 7,688.
Minor support remains to be seen at the 23 March high at 7,522 below which sits the 31 March low at 7,489.
While above there, immediate upside pressure should be maintained. Below 7,489 meanders the 55-day simple moving average (SMA) at 7,436 and further down the 23 March low can be made out at 7,419.
 Source: ProRealTime
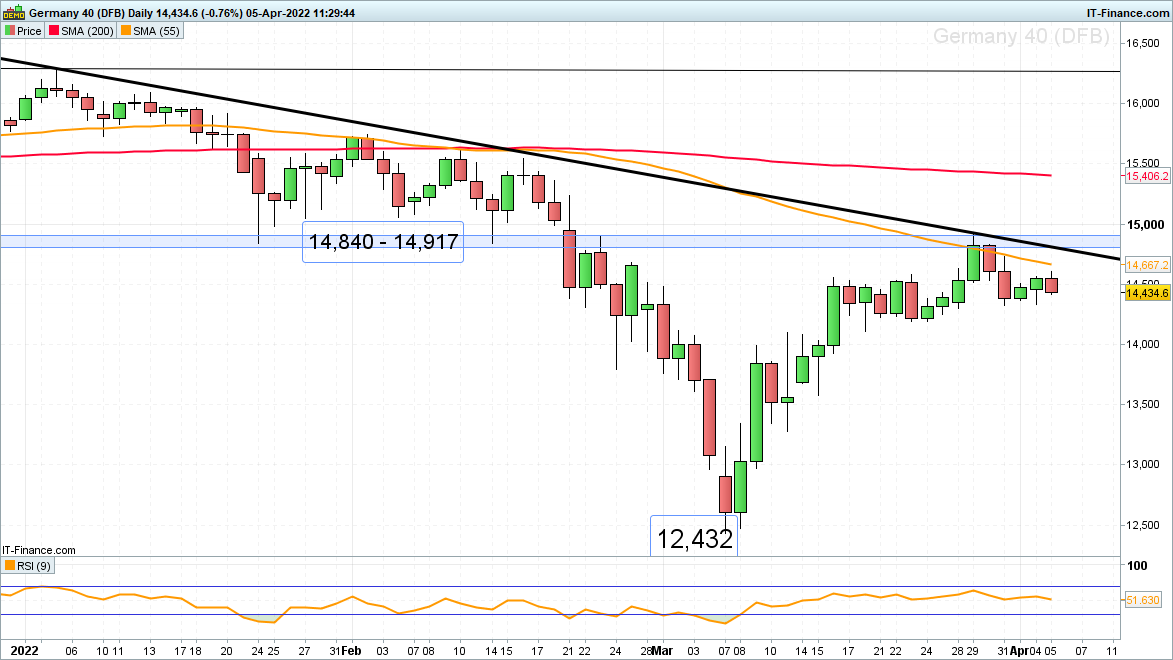
DAX 40 remains below key resistance area
The DAX 40 tried but so far failed to reach the 55-day SMA at 14,667 amid worries of further sanctions being imposed on Russia and the impact these may have on European economies.
The index thus remains below key multi-year resistance at 14,840 to 14,917 which goes back to May 2021. At present a slide back towards the last week’s low at 14,323 looks to be on the cards. If slipped through, the 24 March low at 14,187 may be revisited.
In case of the March high at 14,927 being exceeded, the 200-day SMA at 15,406 would be in focus, however.
 Source: ProRealTime
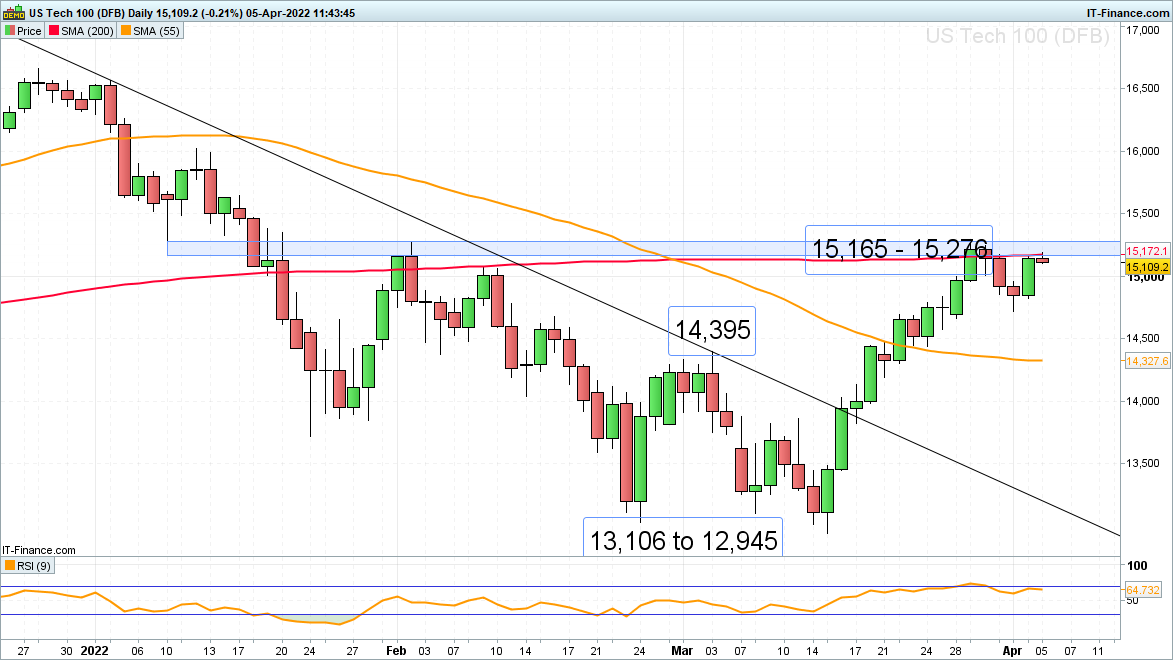
Nasdaq 100 flirts with 200-day SMA at 15,172
US stock futures started the week on the front foot thanks to news that the Chinese regulator would make changes to rules regarding confidentiality, allowing US auditors to access sensitive financial information. This prompted a surge in technology stocks and led to the Nasdaq 100 resuming its ascent.
The index is currently grappling with the 200-day SMA, mid-January low and February high at 15,172 to 15,276 which capped last week.
If 15,276 were to be overcome on a daily chart closing basis, a double bottom upside target of 15,845 could be reached. It is the distance between the 14,395 early March high to the 12,945 March low, projected upwards from the breakout point at 14,395.
Only a currently unexpected slip through Friday’s low at 14,723 would negate the currently bullish bias and may provoke a deeper retracement back towards the 55-day SMA at 14,328.
 Source: ProRealTime
IG Analyst
05 April 2022 22:30 -
While bitcoin is the big boy of the crypto world, many alternative coins or ‘altcoins’ have cropped up in recent years. Here are some of the top altcoins to watch – ranked in no particular order.

Source: BloombergWhat is an altcoin?
An altcoin is an alternative to Bitcoin – the crypto that started it all. Given bitcoin’s popularity, many other cryptos have launched to try and cash in on the crypto craze.
Most of the altcoins that’ve been released are built on the blockchain technology that spawned bitcoin, and this technology is already supporting more secure and efficient ways of transacting business and transferring assets.
Because of the expansion of cryptocurrency in recent years, and the wave of developers and programmers looking to cash in on the rise of alternative payment systems, the altcoin market is flooded with choice. Because of that, we’ve whittled this list down to five of the most well-known and hotly talked about coins at the time that this article was updated.
That said, here are some of the top altcoins to watch.
Top altcoins to watch
1) Litecoin (LTC)
Litecoin (LTC) was launched in 2011 by Charlie Lee, a former Google employee. The software that Litecoin runs on is incredibly similar to that of bitcoin, although Litecoin’s is faster. This is one of the reasons for Litecoin’s staying power.
While it takes around 10 minutes to mine a bitcoin block, it takes just two and a half minutes to mine a Litecoin block. The Litecoin supply limit’s capped at 84 million, and the current reward for mining a block is 12 and a half Litecoin’s – which will halve in 2023.
2) NEO (NEO)
Headquartered in China, NEO has an ambitious vision to help create and support a new digital ‘smart economy.' Its network structure enables the development of decentralised applications or ‘dapps’ that can facilitate a whole host of secure and quick transactions, via smart contracts.
Despite the Chinese government’s crackdown on initial coin offerings (ICOs) and cryptocurrencies, NEO has so far managed to raise the funds needed to develop and launch its projects – fuelling speculation of a possible connection between the company and Chinese authorities.
3) Stellar (XLM)
The aim of Stellar – founded in early 2014 by Joyce Kim and Jed McCaleb – is to seamlessly, quickly and securely link banks, customers and payment systems. Its platform is designed to facilitate the near-instantaneous exchange of funds around the globe – with its cryptocurrency, XLM, acting as a bridging mechanism between fiat currencies.
In early 2018, Stripe – one of the world’s largest payment gateways – announced plans to replace Bitcoin with XLM. This news saw Stellar’s price rise by 20%, and helped to solidify the coin’s place in the world of bitcoin alternatives.
4) Ether (ETH)
Ether is the name of the cryptocurrency that’s used on the Ethereum blockchain platform. In terms of market cap, ether is the second largest crypto in the world, after bitcoin itself – so Ether could be considered the largest of the ‘altcoins’.
Ethereum as a platform was first proposed in 2013 by programmer Vitalik Buterin and the network went live in 2015. It’s most used as a decentralised finance platform, but it has also been utilised to help launch other altcoins through initial coin offerings.
5) Dogecoin (DOGE)
Dogecoin is the last altcoin that we’ve include in this article and it’s perhaps one of the newest to achieve mainstream attention. This attention is due in part to social media hype, spurred on by celebrities like Elon Musk, Snoop Dogg and Gene Simmons.
This hype, for example, saw the price of the coin increase from $0.007 on 27 January 2021 to $0.08 on 7 February 2021. Doge has already come a long way since it was created by Billy Markus and Jackson Palmer in 2013, and it’s anyone’s guess whether the hype will continue.
What’s the future outlook for altcoins?
The future outlook for altcoins is mixed, and the expanded use of crypto as a mainstream form of currency will no doubt be needed for altcoins to catch on in the mainstream. For now, they’re relegated to the side lines of the crypto space – with bitcoin reigning supreme, with that trend set to continue for some time.
How to trade altcoins
Trading altcoins means that you’re taking a speculative position on the price of a coin rising or falling. You won’t ever take direct ownership of the coins, so you won’t need to worry about creating an exchange account or virtual wallet.
Instead, when you trade, you’re using CFDs to ‘buy’ an altcoin if you think its price will increase; or to ‘sell’ an altcoin if you think its price will fall.
Here’s how to trade altcoins with CFDs:
- Create a CFD trading account or Open MyIG
- Research the altcoin market
- Search for your opportunity in our trading platform
- Set you position size and any stops or limits
- Open and monitor your CFD trade
If you’re not ready to trade the live markets just yet, you can always build your confidence with our demo account. You’ll get $20,000 to trade different altcoins – or bitcoin itself – to see how these assets behave, and familiarise yourself with managing risk when trading crypto.
Create a demo account
Callum Cliffe | Financial writer, London
05 April 2022 -
A strengthened dollar has lifted USD/JPY again, while putting pressure on EUR/USD. For now, sterling appears to be holding its ground against the dollar.
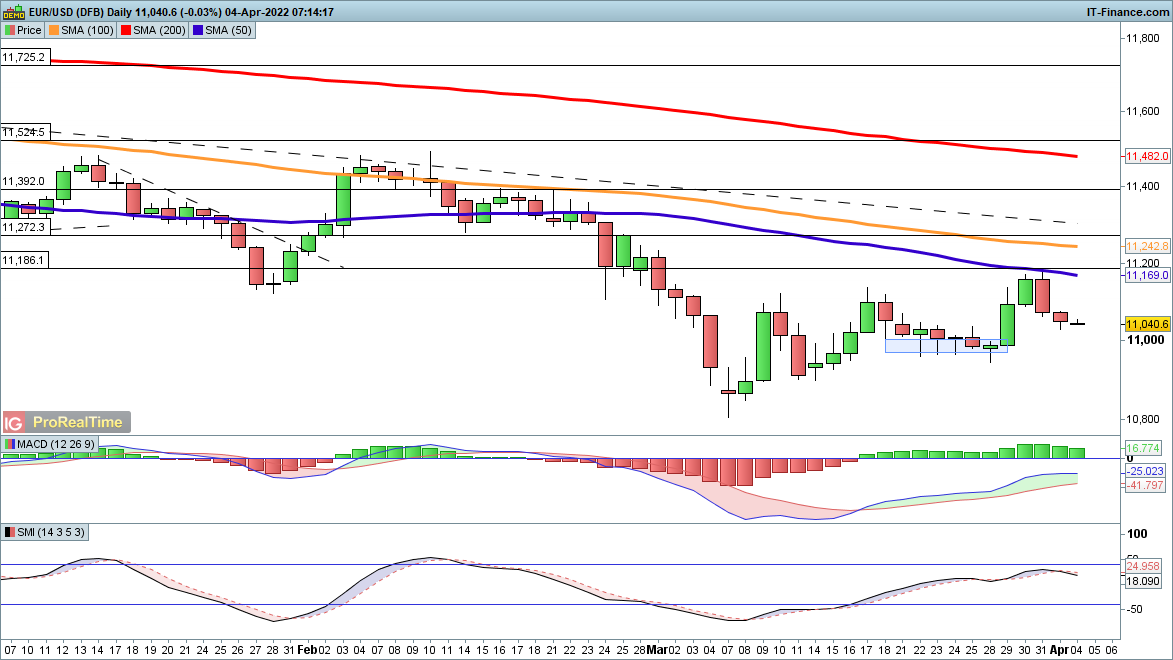
EUR/USD in retreat from recent highs
Two days of losses in EUR/USD and a retreat from the 50-day simple moving average (SMA) $1.1169 point towards a potential lower high and the beginning of a new leg lower for the pair. This would bring $1.08 into view, the low from the beginning of March into play. Stochastics have rolled over too, suggesting this downtrend has further to run.
 Source: ProRealTime
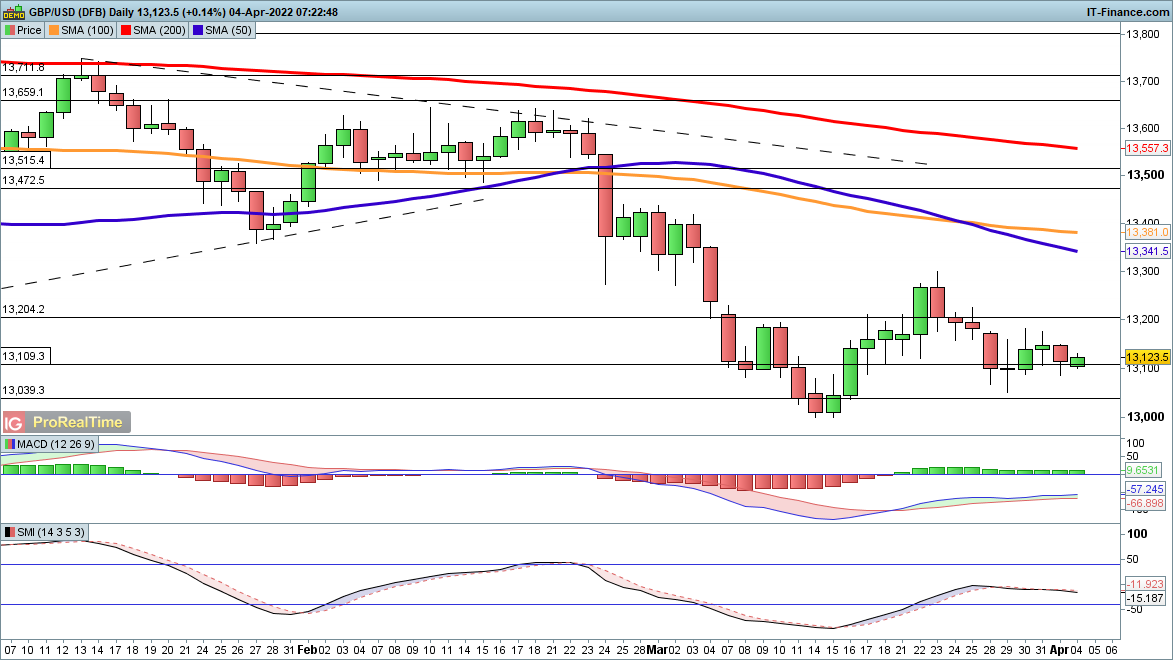
GBP/USD steady despite losses
GBP/USD price has managed to hold its ground despite coming under some pressure on Friday. As yet further losses have not materialised, although a drop below $1.305 would mark a bearish development. Buyers will want to see a move back above $1.318 to open the way to a potential challenge of the highs from the second half of March, around $1.328.
 Source: ProRealTime
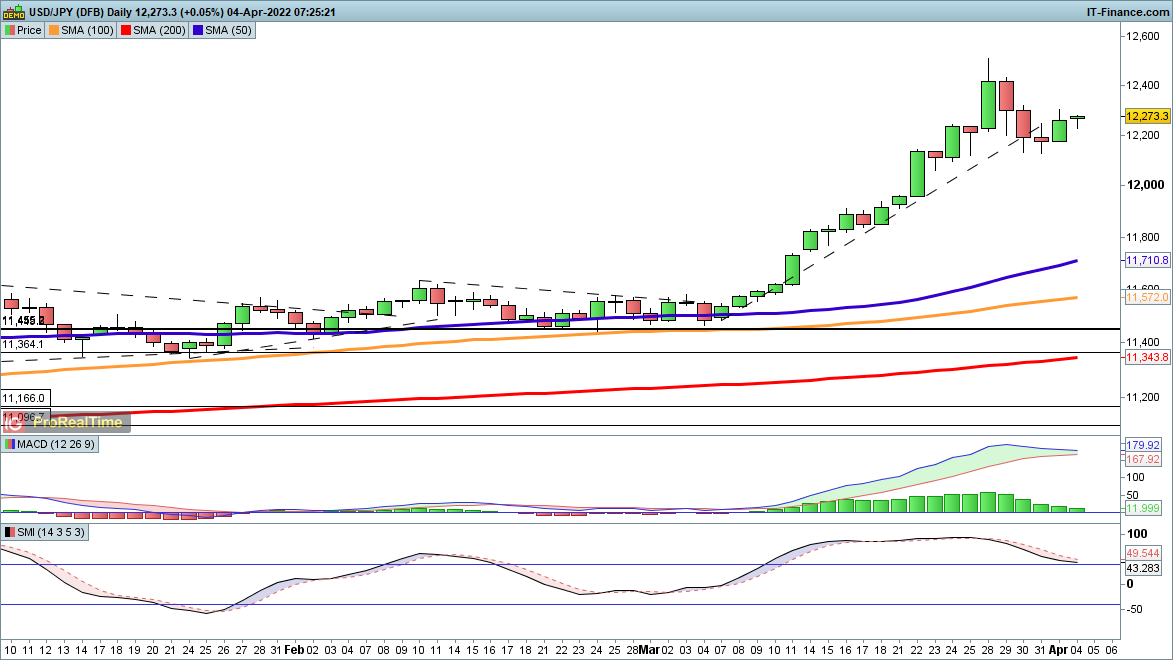
USD/JPY pushes higher
Friday’s jobs report strengthened the dollar, reversing some of the recent losses. It looks like USD/JPY may push back to the late March highs, despite the apparent overextension of the rally indicated by the yawning gap with the 50-day SMA ¥117.10. Sellers would need to push the price back below ¥121.20 to suggest a nearterm retracement is underway.
-
11 hours ago, Jinny said:
Hi, I just moved to Singapore from the UK and your helpdesk just told me that it is not possible to keep my ISA account and that I have to close all my positions! Is this true? Based on your last comment, it seems like I should be able to keep my ISA as long as I don't add funds, which is fine by me. Asking me to close my positions forcefully is asking me to take a massive loss due to the markets being in a slump! Also, if keeping my ISA account is not possible, can I at least transfer them to another ISA provider that is willing to accept the transfer?
Hi @Jinny,
Singapore office does not offer Share dealing account, therefore we won't be able to transfer your shares over. Please reach out to helpdesk.uk@ig.com for further details on keeping an ISA without adding funds.
If you wish to transfer your shares out of IG you can follow the steps on this link:
https://www.ig.com/uk/help-and-support/investments/transferring-investments/how-do-i-transfer-my-shares-or-isas-from-ig-to-another-broker
All the best - Arvin -
4 hours ago, SuperFund5050 said:
How do I change the Displayed name on my account
Hi @SuperFund5050,
If you want to change the name of the account your are on you can go on My IG > Dashboard > Click on the pencil next to the account name:
That would be reflecting here :
I hope that it helps.
All the best - Arvin


Australian dollar forecast: AUD/USD eyes China CPI ahead of event-heavy week
in Foreign Exchange (FX)
Posted
Chinese inflation and factory-gate prices to cross the wires today as PBOC move looms and AUD/USD is trading at its 20-day Simple Moving Average (SMA) after prices fell last week.
Source: Bloomberg
Monday’s Asia-Pacific outlook
The Australian dollar will be in focus to kick off the Asia-Pacific trading week as Chines CPI data approaches. AUD/USD hit a fresh 2022 high last week but subsequently surrendered those gains and turned lower as market sentiment deteriorated. Oil prices may face additional pressure as the lockdown in Shanghai moves into its third week.
China’s consumer price index (CPI) for March is set to cross the wires at 01:30 GMT. Analysts expect to see a 1.2% year-over-year rise, according to a Bloomberg survey. That would be up from February’s 0.9% y/y figure. Factory gate prices, via the producer price index (PPI), are seen easing to 7.9% y/y. Today’s data comes amid growing expectations for a rate cut from the People’s Bank of China. That easing may come as soon as this week, even if CPI comes in hotter than expected. The Australian dollar would likely respond well to looser policy in China, given the economic link between the two countries.
The US dollar and Federal Reserve interest rate expectations will likely remain a driving factor to broader market sentiment after a volatile week on Wall Street. The US dollar DXY Index rose to a fresh 2022 high before pulling back slightly into the weekend. Meanwhile, USD/JPY put in another strong performance on yen weakness due to the divergent policy outlooks between the Fed and the Bank of Japan.
Oil traders will have US inventory data in focus after the Energy Information Administration (EIA) reported a surprise build in crude oil stocks. The lockdown in Shanghai is also tempering demand in Asia, while production around the world continues to slowly increase. This morning, New Zealand’s March electronic retail card spending crossed the wires at -0.5%, down from February’s 1.1% figure.
The economic docket for the rest of today’s session is rather sparse, but traders are bracing for several high-impact events this week, including Australia’s March jobs report and the European Central Bank interest rate decision. US inflation data is also due out, with analysts seeing the March figure dropping at 8.5% on a y/y basis. That would be up sharply from the multi-decade high of 7.9% y/y reached in February. The US dollar may break above the 100 mark if prices come in hotter than expected.
Australian dollar technical forecast
AUD/USD is trading at its 20-day Simple Moving Average (SMA) after falling in last week’s trading. A rebound from the moving average would see potential resistance at the 23.6% Fibonacci retracement before taking aim at the recent high of 0.7661. A Bearish Engulfing candlestick formed at that high. A break below the 20-day SMA would see prices potentially fall all the way down to the 50-day SMA if bears could break the 61.8% Fib level.
AUD/USD four-hour chart
Source: TradingView
This information has been prepared by DailyFX, the partner site of IG offering leading forex news and analysis. In addition to the disclaimer below, the material on this page does not contain a record of our trading prices, or an offer of, or solicitation for, a transaction in any financial instrument. IG accepts no responsibility for any use that may be made of these comments and for any consequences that result. No representation or warranty is given as to the accuracy or completeness of this information. Consequently any person acting on it does so entirely at their own risk. Any research provided does not have regard to the specific investment objectives, financial situation and needs of any specific person who may receive it. It has not been prepared in accordance with legal requirements designed to promote the independence of investment research and as such is considered to be a marketing communication. Although we are not specifically constrained from dealing ahead of our recommendations we do not seek to take advantage of them before they are provided to our clients.
Thomas Westwater | Analyst, DailyFX, New York City
11 April 2022