

ArvinIG
-
Posts
1,728 -
Joined
-
Last visited
-
Days Won
23
Content Type
Profiles
Forums
Blogs
Events
Community Tutorials
Store
Posts posted by ArvinIG
-
-
AUD/USD was powered by the surging iron ore price this week while the momentum for USD/JPY has waned.

Source: BoombergAUD/USD
The commodity currency was in favour this week, fuelled by the powerful iron ore price's upward momentum. The iron ore price jumped by more than 5% on Tuesday, the third straight day of gain, over rising concerns that a prolonged military tension between Russia and Ukraine could further curb its global supply.
As such, the iron ore Australian-related currency has been pushed towards the highest level of the year at around 0.7289 despite the unchanged interest rate decision from the RBA on Tuesday.
From a technical point of view, the pair of AUD/USD has been skewed into the uprising tunnel since the end of January which could bring the 0.73 level back insight. Current support is found at 0.7261. Below that level, the conjunction that the 20, 50, and 100 days moving average meets around 0.7193 should act as massive support for the pair. However, if broken through, it will press the pause button for AUD/USD's bull.
AUD/USD Daily Chart
 Source: IG
USD/JPY
Intensified battle on the land of Ukraine continued to weigh heavily on US and European equities with the US bond yields falling sharply as risk appetite shifted again following the deterioration of global risk sentiment. As a result, the curve steepened as 2-year government bond yields dropped from 1.45% to 1.34%, and the 10-year government bond yields sank from 1.86% to 1.68%, the lowest level since early January.
Even though the greenback is expecting at least a 25bps rate hike for the next fortnight, the US dollar versus fellow havens JPY has moved sideways from the upward trend line, entering the consolidation phase.
According to the daily chart, the pair is finding their support above the 100 days moving average for now and struggling to regain control over the level at 114.8. The previous trend line has turned up the pressure level for the pair to strike for which could release some selling pressure in the area of $115.86-$116.
From a longer-term perspective, the momentum for the pair has waned but remains valid. The weekly candlestick stayed within the ascending moving trajectory and was supported by the 20-weekly MA. RSI is pointing south and is still glued to the 50 above the zone.
USD/JPY Daily Chart
 Source: IG
USD/JPY Weekly Chart
 Source: IG
Take your position on over 13,000 local and international shares via CFDs or share trading – and trade it all seamlessly from the one account. Learn more about share CFDs or shares trading with us, or open an account to get started today.
Hebe Chen | Market Analyst, Australia
02 March 2022 -
We look at three stocks that could climb as a result of the Ukraine-Russia war.

Source: BloombergMarket wrap: ASX200 under pressure from Ukraine War; but some companies could see profits boosted by the conflict
Global equities remain under pressure as Russia’s invasion of Ukraine weakens sentiment and threatens global economic activity. The situation remains dynamic. However, the heightened uncertainty from a potentially protracted war is keeping investors from buying into equities as the outlook for growth and inflation is assessed. On a macro-level, the conflict is clearly bad for the global economy and stocks. However, there are areas of the Australian economy and ASX that could see some benefit from the consequences of this war. Here we look at three stocks that could rise as the war continues.
Top three ASX stocks to watch
Here are 3 stocks that have caught our eye and may be worth watching in the week ahead.
- Woodside Petroleum (WPL)
- Northern Star Resources (NST)
- GrainCorp (GNC)
Woodside Petroleum (WPL)
 Source: IG
Energy prices are surging as fears that the war could disrupt production in Russia and lead to trade restrictions on Russian gas exports into Europe. Oil prices – for one – have hit fresh seven-year highs in recent days, placing a rocket under already flying energy stocks, with the price of Brent WTI both well above $US100 per barrel. Woodside Petroleum (WPL) hit fresh post-pandemic highs in recent days, powered too by some solid HY results in February, which itself was fuelled by tight global energy markets and improving demand as the global economy reopens following the pandemic. The trend for WPL shares remains skewed to the upside, with the next key level of technical resistance at around $31.50 per share. Support looks to be around $27.60.
Northern Star Resources (NST)
 Source: IG
Sanctions on Russia’s financial institutions is sparking a flight to alternative stores of value, while diminished gold production threatens to choke off supply of the metal to global markets. The value of gold has exceeded $US1970 at stages during the war (so far), which when accounting for a relatively weaker Australian Dollar in the past 18 months, is pushing the XAUAUD above $A2600 and around levels not seen since August 2020. Northern Star Resources (NST) shares are reflecting some of this move – although it does remain below the price it was trading at when the XAUAUD was at that level. Right now, NST is challenging trendline resistance, which if broken could drive a push towards resistance at $11.00. Support sits at around $10.00.
GrainCorp (GNC)
 Source: IG
Food insecurity and surging prices for agricultural commodities is a major risk from this war, with both Russia and Ukraine as major producers and exporters of grains. Wheat, for example, has hit a seven-year high in recent days. Food inflation could be a feature of the global economy in the short term with agricultural companies’ bottom lines set to benefit from the increase in prices. GrainCorp Ltd (GNC) could be one that sees such benefits. Its share price has been on an upward trend since the start of the pandemic. But the momentum behind that trend has increased as fears of food inflation has increased. GNC shares are currently testing resistance at $8.60, which if broken may open a run towards $9.00 per share. Support on the downside is around $7.60.
Take your position on over 13,000 local and international shares via CFDs or share trading – and trade it all seamlessly from the one account. Learn more about share CFDs or shares trading with us, or open an account to get started today.
Kyle Rodda | Market Analyst, Australia
02 March 2022 -
1 hour ago, bertinpaul2000 said:Hi
i'm new to IG.
I'm unable to open any new trade.When I open a new trade the dialog box is empty. (please refer the attached image)
Hi @bertinpaul2000,
Could you please take a look at the bottom right of the platform. If you see a message such as ‘invalid account’ or ‘no connection’, check your login details and try to log in again.
Then right click in the ‘marketwatch’ window and then select ‘show all.’
You will need to select symbols showing the .S after, for example USDCHF.S
I hope that it helps.
All the best - Arvin-
 1
1
-
-
7 hours ago, petersmyth said:
I am interested in the following markets to trade in my IG ISA account.
Nova Royalty Corp (Not Available)
Direxion Daily Junior Gold Miners Index Bull 3x Shares -NA
VanEck Juniors Gold Miners ETF (LSE) -NA
Sprot Gold Miners ETF -NA
North Shore Global Uranium Mining ETF -NA
Global X Uranium Mining ETF -NA
PureFunds LSE Junior Silver (small cap Explorers) ETF -NA
Global X Silver Miners ETF -NA
However, they all have the following instructions at point of order;
“instrument Not Tax Wrapper Enabled”
How can I trade these markets in my ISA account?
Also, how do I find similar funds to trade on the London SE?
Hi @petersmyth,
The "Not Tax Wrapper Enabled" would mean that these ETFs are not eligible to be traded on ISA accounts.
You can trade them on your regular share trading account.
All the best - Arvin -
The Swiss franc continues to gain against euro as markets recalibrate; commodities and associated currencies continue to gain amongst the mayhem and with the risk profile of assets under scrutiny, will EUR/CHF break lower?
Source: BloombergThe Swiss Franc is making fresh 6.5 highs against the Euro as the Russian attack on Ukraine continues to unfold. The Swissie has maintained it’s safe haven status despite joining the coalition of countries that will confiscate Russian assets.
There is a growing perception that Russia will extract some revenge on the EU through gas supplies.
The EU, US and their allies are looking to block Russia’s foreign exchange reserves, meaning that it would be difficult to defend the Ruble and increase the difficulties to fund themselves. The Bank of Russia raised rates to 20% in an effort to defend their currency.
The S&P 500 and the Dow finished their cash session only mildly softer while the Nasdaq had a small gain after all indices were deep in the red earlier in their day. Futures are pointing to a flat start to their day at the moment.
APAC equities had a mostly positive day with only Hong Kong’s Hang Seng index slightly softer. Japan’s Nikkei 225 index was the notable outperformer, up over 1.4% at one stage.
US Treasuries were slightly softer with yields steadying and inching up a few basis points. The 2-year note is back near 1.45%, after yesterday low yield of 1.41%.
Hong Kong might be about to go into lockdown as the Covid-19 situation is deteriorating there. Reports are emerging that contact tracing is no longer updating, hospitals are stretched to capacity and that morgues are almost full.
This could have wider implications for broader China and if the communist party maintains a zero policy to the pandemic.
The PBOC set the Yuan reference rate weaker than expected today despite a slightly better than expected manufacturing PMI coming in at 50.2.
The Chicago Board of Trade wheat futures contract traded a 10-year high overnight and remains at lofty levels. Wheat, soybeans and corn are all being sort after as supply from Ukraine and Russia evaporates.
Crude oil remains at elevated levels with the many Black Sea shipping routes closing, adding to supply woes for commodities generally. The WTI futures contract is trading above US$ 96.50 bbl.
The US and its allies are considering releasing 60 million barrels from strategic reserves.
Bitcoin jumped on the possibility of the crypto currency gaining favour amongst the turmoil. The spot price is above US$ 43,200 at the time of going to print.
Looking ahead, a series of European PMIs and CPI figures are due out and Canadian GDP will be released as well as the US ISM figures.
EUR/CHF technical analysis
EUR/CHF is trading at its lowest level since June 2015. Volatility has increased as observed by the widening of the 21-day simple moving average (SMA) based Bollinger Bands.
A close back inside the bands could signal a reversal, but another close outside the bands might signal the beginning of a new trend.
Nearby, yesterday’s low of 1.02761 may provide support while the pivot points of 1.03001 and 1.03266 could offer resistance.

Source: TradingViewThis information has been prepared by DailyFX, the partner site of IG offering leading forex news and analysis. This information Advice given in this article is general in nature and is not intended to influence any person’s decisions about investing or financial products.
The material on this page does not contain a record of IG’s trading prices, or an offer of, or solicitation for, a transaction in any financial instrument. IG accepts no responsibility for any use that may be made of these comments and for any consequences that result. No representation or warranty is given as to the accuracy or completeness of this information. Consequently, any person acting on it does so entirely at their own risk.
Daniel McCarthy | Strategist
01 March 2022 -
In this article we take a look at some of the key supply and demand considerations affecting the palladium price and its outlook, including the most recent influence of the Russia-Ukraine crisis.

Source: BloombergWhy has the palladium price been rising since 2016?
Stricter emission controls in the automotive sector saw increased demand for palladium. Palladium is primarily used in catalytic converters for petrol/gas vehicles to help reduce carbon emissions.
Why did the palladium price fall in 2021?
In 2021, supply chain disruptions as the economy rebounded from the Covid-19 pandemic, saw a shortage of semiconductors/microchips used in the motor vehicle industry. The shortage has limited production and demand for the precious metal.
How long will the semiconductor shortage last?
The semiconductor shortage affecting the motor industry remains, although is expected to ease from about the second half of 2022. This is according to Fitch ratings agency and a number of carmakers including General Motors, Ford and Hyundai. Some of the reasons for this include improving capacity meeting a slower demand increase as the strength of the economic rebound (from the Covid-19 pandemic) starts to fade.
How is the Russia-Ukraine crisis affecting palladium?
Norilsk Nickel, Russia’s primary palladium producer accounted for roughly 40% of the global palladium supply in 2021. Palladium prices remain sensitive to the Russia-Ukraine crisis from the threat of disruption to production and exports. Recently imposed sanctions on Russia have targeted Society for Worldwide Interbank Financial Telecommunication (SWIFT) international payments as well as banks. This can indirectly inhibit trade if exemptions are not given for these products. So essentially the short-term rise in palladium we are seeing speaks to supply concerns of the precious metal.
Which countries import the most palladium?
The US, Germany, Hong Kong, China and Japan are amongst the largest importers of palladium. This demand for palladium is supported by the large proportion of motor vehicles produced by these regions.
Which countries (other than Russia) produce the most palladium?
South Africa is the second largest palladium producer in the world and accounts for around four times more output than Canada, the third largest producer thereof.
Which are the top palladium-producing companies in the world?
While Norilsk Nickel remains the largest palladium producer in the world, other top miners of the commodity, as well as other platinum group metals (PGMs) are: Sibanye Stillwater, Anglo American Platinum and Impala Platinum.
Palladium – technical outlook
 Source: IG charts
The price of palladium (June contract) has broken firmly above the 2400 resistance level. The upside move suggests the recent high at 2710 to be the initial resistance target from the move. A break above this level (confirmed with a close above) could see 2875, possibly 3015 as further upside resistance targets.
A pullback towards 2400 might still be considered buyable for trend followers, while a move below 2215 would consider the bullish momentum move to have failed. Traders who are long could consider using the dotted red trend line as a trailing stop loss consideration for the trade.
In summary
- Tighter emission controls for the automotive sector have helped gains in palladium since 2016
- 2021 saw a decline in the precious metal as supply chain disruptions impacted demand
- Russia is the largest producer of palladium through Norilsk Nickel
- Escalating sanctions could affect exports of the commodity
- Regions that account for palladium demand form the greater share of global car manufacturing
- South Africa is the second largest producer of palladium
- Sibanye Stillwater (after Norilsk Nickel) is the second largest palladium producer in the world
- A short-term breakout suggests 2710 to be the next upside resistance target for palladium
Shaun Murison | Senior Market Analyst, Johannesburg
02 March 2022 -
EUR/USD and GBP/USD try to recover while EUR/GBP stays side-lined amid ongoing crisis in Eastern Europe.
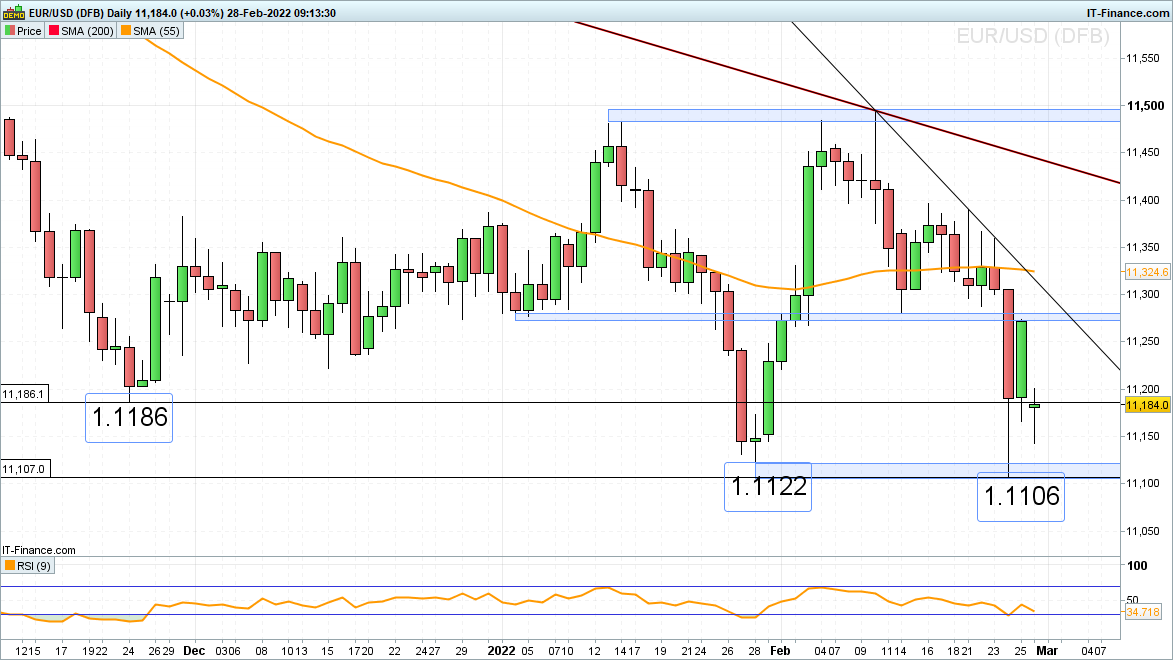
EUR/USD stays above key support, awaiting Russia-Ukraine developments
EUR/USD remains above the May 2019, January and current February lows at $1.1122 to $1.1106 despite the ongoing crisis in Ukraine. While this support zone continues to hold, the early January and mid-February lows at $1.1272 to $1.128 may be revisited.
Provided that the cross remains below its one-month downtrend line and the 55-day simple moving average (SMA) at $1.1302 to $1.1324, the February downtrend is intact. A drop trough $1.1106 would have longer-term bearish implications with the April 2020 low at $1.1019 and the minor psychological $1.10 mark being targeted.
 Source: IT-Finance.com
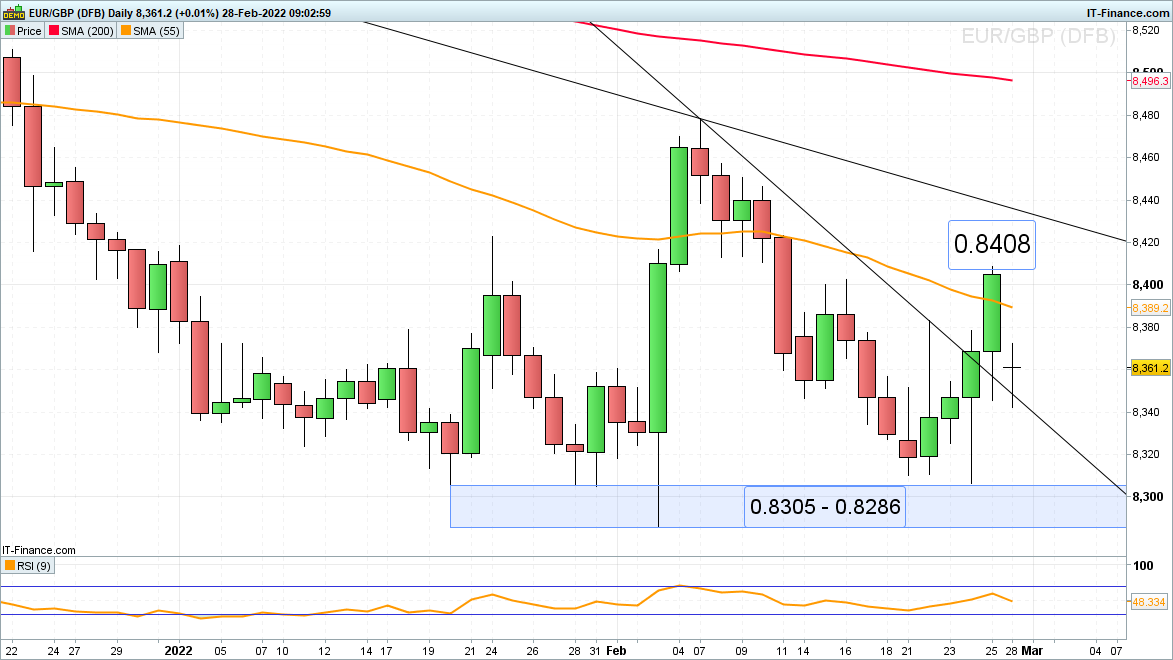
EUR/GBP side-lined amid ongoing geo-political turmoil
Last week, EUR/GBP touched and then rallied from major support, containing the January and early-February lows at £0.8305 to £0.8286, to £0.8408 before slipping back as Russia attacked Ukraine.
Further sideways trading between these two extremes is to be seen in the days to come. Minor resistance can be spotted along the 55-day SMA at £0.8386 as well as at Friday’s high at £0.8408 with the 11 January low at £0.8324 offering minor support.
 Source: IT-Finance.com
GBP/USD continues to recover from last week’s two-month low
GBP/USD continues to gradually recover from last week’s sharp sell-off to $1.3273 in the wake of the Russian invasion of Ukraine. As long as yesterday’s low at $1.3342 holds, the mid-February low and 55-day SMA at $1.3487 to $1.3504 should be in focus but may cap.
Further up the 2021 to 2022 downtrend line, current February high and 200-day SMA can be spotted at $1.3643 to $1.3666. Only a currently unexpected fall through last week’s $1.3273 low, would put the December trough at $1.3163 back on the map.
-
15 hours ago, Lexim said:
Thank you for the reply and making it clear. I think some form of communication should have went out to clients was required yesterday, instead I was left waiting on hold, and also waiting for a agent to reply on chat, both of which didnt know why.
As you can see, we do need to be informed ASAP.
Hi @Lexim,
The communication team sent out an email to clients that had open positions in the relevant affected stocks.
We have share the list of affected stock on the community :Please be aware that Margin changes will occur on FX as well :
I hope that it helps !
All the best - Arvin
-
Bitcoin, Ethereum, rallies in response to Russian sanctions; Chinese PMI data, RBA interest rate decision today as fighting in Ukraine rages and BTC/USD may target the 50,000 level if momentum carries prices above the 61.8% Fib
Source: BloombergTuesday’s Asia-Pacific outlook
Asia-Pacific markets look set for a mixed open as traders mull the latest developments stemming from the Ukraine conflict. US stock markets trimmed heavy losses overnight, with the tech-heavy Nasdaq 100 index closing 0.34% higher, but the S&P 500 shed 0.24%, securing a second monthly loss for the US benchmark. Investors flocked to the safety of Treasuries, particularly short-term tenures, reversing some recent flattening across the curve that occurred in recent weeks. The Japanese Yen and Swiss Franc attracted heavy inflows amid the volatile market landscape as traders assessed the latest western sanctions on Russia.
Bitcoin, and other major cryptocurrencies, were big winners going into today’s APAC trading session. BTC/USD rose north of 10% over the past 24 hours, bringing prices to the highest levels since February 17. The cascade of sanctions being piled onto Russia from the United States and its allies, including the removal of major Russian banks from the SWIFT messaging system, has effectively marooned the Russian banking system from the global financial markets, casting doubt on Russia’s financial ability to weather the economic penalties. The Russian Ruble tumbled further against the Greenback overnight, with USD/RUB rising more than 20%.
The sharp rise in Bitcoin and other cryptocurrencies comes amid a significant uptick in trading volumes in Russia’s Ruble and Ukraine’s Hryvnia, according to data firm Kaiko cited in a Bloomberg report. Russian oligarchs and others who fear being impacted by the sanctions may be fleeing to Bitcoin, given its perceived insulation from the traditional financial system. Ukraine’s Vice Prime Minister, Mykhailo Fedorov, requested major exchanges to restrict users with a Russian address on Monday.
The response from major crypto exchanges has been mixed. Binance said it would block sanctioned individuals but would not freeze all Russian accounts. The possibility exists that western powers may soon target these flows, although Russia’s ability itself to sidestep sanctions through crypto is likely very limited. Meanwhile, crude oil is trading near the 96 level as traders move to price in a global market without Russia’s nearly 10 million barrels per day. Canada announced a ban on all Russian oil imports, although the country hasn’t imported any since 2019.
Today, China’s National Bureau of Statistics (NBS) will report February purchasing managers’ indexes (PMI) for its services and manufacturing sector. Analysts see manufacturing PMI dropping back into the contractionary territory at 49.8, according to a Bloomberg survey. That would be the weakest manufacturing report since October when Covid’s Delta variant and an energy crunch stifled factory activity. The services sector is expected to fall as well but should remain in expansion above the 50 level.
The Reserve Bank of Australia (RBA) is set to report its March interest rate decision at 3:30 GMT today. The Australian central bank is likely to keep its benchmark rate steady at 0.10% despite robust labor market strength and lofty raw material and consumer product prices. Still, RBA Governor Philip Lowe may strike a more hawkish tone, in a further capitulation to relatively hawkish market expectations. The missing piece for an RBA rate liftoff appears to be weak wage growth, tracking at 2.3% y/y in the fourth quarter, allowing RBA policymakers to stand firm. The market sees over 90 basis points of tightening by the December meeting, according to cash rate futures. AUD/USD may rise if Mr. Lowe indicates a willingness to tighten monetary conditions sooner than previously communicated.
Bitcoin technical forecast
BTC/USD rocketed higher overnight, clearing above the 40,000 psychological level, the 50-day Simple Moving Average (SMA) and the 38.2% Fibonacci retracement. The next obstacle for bulls is the 61.8% Fib level and the falling 100-day SMA. A break above those levels may shift bulls’ focus onto the 50,000 mark, a level untouched since December 2021. Momentum looks healthy, with the MACD line crossing above the signal line and on track to cross above the center line. The Relative Strength Index (RSI) is also moving firmly higher. Alternatively, a pullback may drag prices to the 40,000 level, where some support is likely to be offered.
BTC/USD daily chart
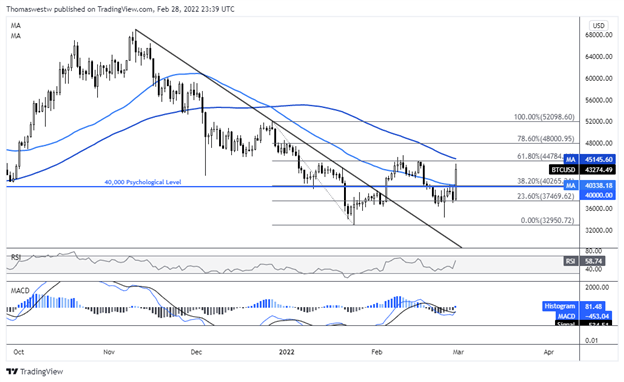
Source: TradingViewThis information has been prepared by DailyFX, the partner site of IG offering leading forex news and analysis. This information Advice given in this article is general in nature and is not intended to influence any person’s decisions about investing or financial products.
The material on this page does not contain a record of IG’s trading prices, or an offer of, or solicitation for, a transaction in any financial instrument. IG accepts no responsibility for any use that may be made of these comments and for any consequences that result. No representation or warranty is given as to the accuracy or completeness of this information. Consequently, any person acting on it does so entirely at their own risk.
Thomas Westwater | Analyst, DailyFX, New York City
01 March 2022 12:56 -
USD/RUB: The Russian Rouble is now worth less than one US cent. And as governments and corporations impose extreme sanctions, the Russian economy could soon return to 1998.
Source: BloombergKarl Marx warns ‘history repeats itself, first as tragedy, second as farce.’ Hitler’s Anschluss with Austria is mirroring Russia’s annexation of Crimea, the encroachment in the Donbas with the occupation of the Sudetenland.
But as Putin assaults Kyiv, Russia is starting to resemble its own ghost of prior economic ruin.
USD/RUB: Russian Rouble collapse
On 31 December 1999, Russian President Boris Yeltsin ceded the Presidency to a 46-year-old Vladimir Putin. Yeltsin had burned through the country’s economy in the first Chechen war, despite reminding the US that ‘Russia has a full arsenal of nuclear weapons. He (Clinton) has forgotten about that.’
However, in 1998 Russia was running out of money. The IMF and World Bank lent it $22.6 billion to support financial reforms, and between October 1997 and August 1998, the Russian Central Bank spent $27 billion trying to shore up the Rouble. But on 17 August 1998, the currency became so devalued that Russia defaulted on its debt, causing economic collapse.
Russia’s Putin officially invaded Ukraine on 24 February; like Chechnya, it’s a region he deems unworthy of statehood. And like his predecessor, he has warned the west that interference could result in ‘consequences you have never seen in history.’
But a Molotov cocktail of Ukrainian defence and Western sanctions could see Russia’s economy (USD/RUB) collapse before its President can declare victory.
Ukrainian defiance
‘I need ammunition, not a ride.’ The soldiers of Snake Island and Babusya’s sunflower seeds. A destroyed bridge and widespread civilian resistance. Russia’s unprovoked invasion is playing out on 21st-century social media, with every smartphone as valuable as a German Stinger missile.
The result has been a global outpouring of support, exposing the largest miscalculation of Putin’s career. Potential allies have abandoned him. China has said the two are ‘partners,’ not allies and will not interfere with US sanctions. Turkey has decided its EU membership is more valuable than Russian gas and is limiting Russian warships in the Black Sea.
Germany has halted approval for Nord Stream 2 and is increasing its military budget by €100 billion. Canada is placing an import ban on Russian fossil fuels. Finland’s majority wants NATO membership and could bring Sweden in with them. Even Switzerland is breaking its famous neutrality. The EU has shut its airspace to Russia. As the war continues, Ukrainian public opinion shifts ever further towards Europe. And every day, weapons pour into Ukraine, making a swift Russian victory impossible.
Moreover, this drawn-out conflict is a PR nightmare. BP and Shell are selling their Russian oil and gas interests. Netflix is refusing to show Russian state propaganda. Alphabet has stopped monetisation of Russia’s state media, Twitter is labelling it, and Facebook is banning it. UEFA and FIFA have ended their partnerships with Gazprom and suspended all Russian teams. Russian-made vodka is being boycotted. And Putin himself has had his blackbelt revoked by the International Taekwondo Association.
Swift sanctions
Worse still, the west has cut access to Swift for several major Russian banks and prohibited all dealings with Russia’s central bank. This has left Russia’s $630 billion reserves, stored predominantly in foreign currency, unusable.
In response, Russia has raised its base rate from 9.5% to 20%, barred citizens from transferring money out of Russia, and suspended sales of Russian investments by foreigners. It says this ‘will ensure a rise in deposit rates to levels needed to compensate for the increased depreciation and inflation risks.’ And Kremlin spokesman Dmitry Peskov says ‘these are heavy sanctions, they're problematic, but Russia has the necessary potential to compensate the damage from these sanctions.’
But fearing a market collapse, Moscow’s exchange remains closed. Charles Stanley’s Will Walker-Arnott believes ‘Russia is increasingly becoming an economic pariah, increasingly isolated from the global financial system.’ Julia Friedlander of the Atlantic Council goes further, saying Russia’s assets have ‘essentially vaporised,’ as ‘these sanctions are hitting hard and went from zero to 60.’
Russia now risks repeating 1998. Regarding USD/RUB, 105 Russian Roubles now purchase one US dollar, up from 75 Roubles a fortnight ago.
The European Central Bank says European subsidiaries of Russia’s largest bank, Sberbank, are failing. Its share price has halved in two weeks. Large queues are forming at the country’s ATMs, as customers attempt to access dollars and euros as some credit cards stop working and withdrawal limits are imposed. Chris Weafer at Micro-Advisory believes ‘this set of sanctions is hitting ordinary Russians to an extent that previous sanctions have not.’
One Russian Rouble is now worth less than one US cent, and less than one Afghani, the currency of a failed state. It’s even worth less than a Robux, a make-believe currency bought with the pocket money of western children.
Steve Hanke at John Hopkins University has calculated Russian inflation is at 69.4%, while Estonian MEP Riho Teras believes the war effort is costing £15 billion every day. And Rabobank analysts predict there could soon be a ‘complete collapse in the Rouble.’
This leaves Russia with a stark choice: Peace, a banking collapse or hyperinflation.
Trade 100+ FX pairs with the UK’s No. 1 retail forex provider.* Enjoy fast execution, low spreads – plus we’ll never fill your order at a worse price. Learn more about our forex trading platform or create an account to start trading today.
Charles Archer | Financial Writer, London
01 March 2022 15:20 -
14 hours ago, Plamen said:
Hello,
I am writing to suggest an improvement to the IG trading platform. Something that I don't understand why is not in place already.
The ability to analyse the performance of investments is extremely poor. All you can see is Unrealised profit per position and total portfolio profit which is market value - book value. I recently opened an account with Interactive Brokers and realised how more advanced they are with the tools to analyse the performance of my positions.
They allow analysis of portfolio on different time periods (e.g 1 month, 3 months, YTD, 12 months), that is shown on time weighted and money weighted basis. All things that are extremely insightful. Then when you get a statement you select precisely the period over which you want that and it gives a detailed PnL summary showing fees, etc.
None of the above is available for IG trading accounts which is why I'll also move to IBKR once I can transfer my ISA across. Clearly if such functionality is on the way very soon then I'll re-think.
I am sure you have access to IBKR accounts to see the performance analysis tools you can get there.
Cheers,
PlamenHi @Plamen,
Thank you for your detailed feedback. I have forwarded your suggestions to the relevant department to be reviewed. We forward clients feedback from the community on a daily basis in order to improve our platform.
All the best - Arvin -
13 hours ago, Patins said:
Hi,
I use the Australian IG account, and I was wondering why the US Bitcoin ETF, BITO, is not listed and cannot be bought?
Thanks
Hi @Patins,
Cryptocurrencies are only available on CFD accounts. Make sure that you are not using a share dealing account.
All the best - Arvin -
7 hours ago, Lexim said:
Why is IG only allowing the selling of Polymetal but not the buying?
It seems some other providers are allowing their clients to continue buying Polymetal, so why aren't IG?
Please provide a explanation.
Hi @Lexim,
Thank you for you post. Polymetal International PLC has been placed on the list of Russia-exposed stocks.
Therefore no new positions can currently be opened on this stock.
As the situation continues to develop, IG may take further steps in relation to products with direct or indirect exposure to Russia, including limiting positions or increasing margin.
It is on closing only to allow clients to close their positions.
All the best - Arvin
-
1
-
-
4 hours ago, tejas said:
corn suspended i have been told to call to contuining trading the commoditie, but i cant find the phone number to call for the uk support ?
Hi @tejas,
You can call 0800 195 3100 in the UK. Our team will put you through a dealer.
https://www.ig.com/uk/contact-us#information-banner-dismiss
Thank you - Arvin -
EUR/USD, EUR/GBP and AUD/USD mixed as traders gauge impact of stepped-up sanctions on Russia.
Source: BloombergEUR/USD remains above key support in the midst of Russia-Ukraine conflict
EUR/USD continues to hold above its May 2019, January and current February lows at $1.1122 to $1.1106 amid the fraught situation in Ukraine and stepped-up sanctions on Russia.
While this support area underpins, the early January and mid-February lows at $1.1272 to $1.128 may be revisited, just as they did on Friday. On the way there lies the $1.1186 November low.
As long as the cross stays below its one-month downtrend line and the 55-day simple moving average (SMA) at $1.1313 to $1.1324, however, downside pressure should remain in play. Failure at $1.1106 would have longer-term bearish implications with the April 2020 low at $1.1019 and the minor psychological $1.10 mark being in the spotlight.
 Source: IT-Finance.com
EUR/GBP to remain above key support as traders assess developments in Ukraine
Last week EUR/GBP touched and then bounced off major support, comprising the January and early February lows at £0.8305 to £0.8286, as Russia launched a full-scale invasion of Ukraine.
On Friday EUR/GBP rallied all the way to £0.8408 before dropping back to its breached one-month resistance line, now support line, at £0.8348 in the Asian session.
Today the area between the 55-day SMA at £0.8389 and Friday’s high at £0.8408 is likely to cap with the 11 January low at £0.8324 offering minor support.
 Source: IT-Finance.com
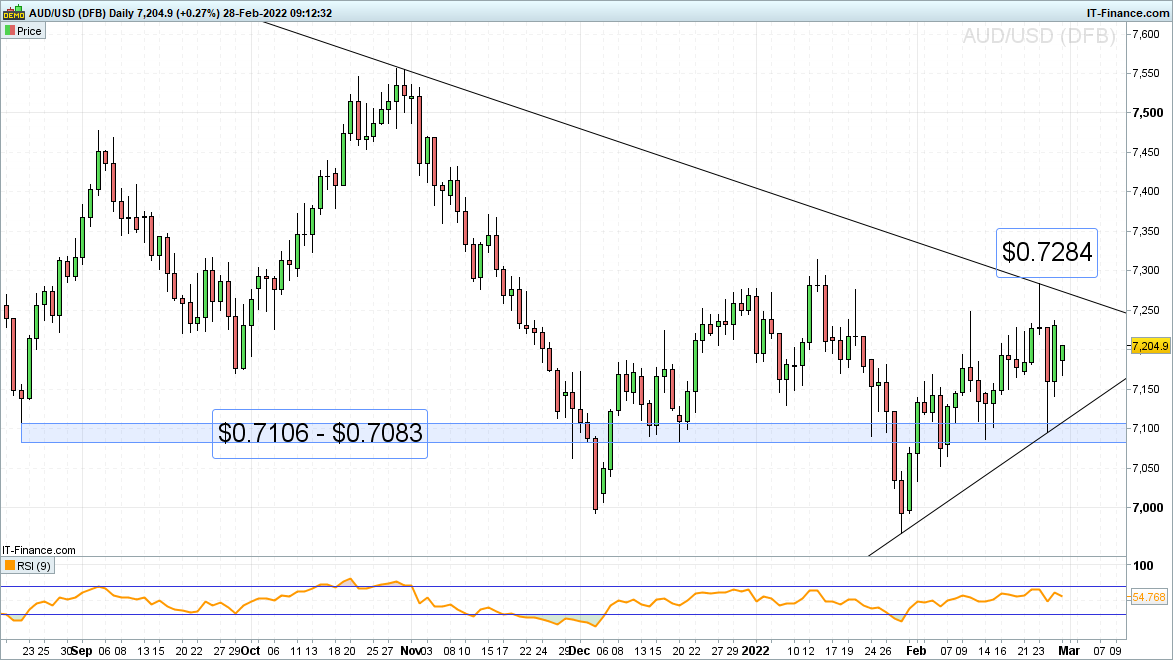
AUD/USD recovers from support as traders digest impact of stepped-up Russian sanctions
Last week’s sharp AUD/USD sell-off in light of Russia’s invasion of Ukraine ended within the $0.7106 to $0.7083 support area being probed and it bouncing off it and rallying to Friday’s $0.7237 high. The support zone contains the August, late December and January lows and should continue to hold.
While this is the case, the mid-December high at $0.7223 and Friday’s $0.7237 high are being eyed as well as the 10 February peak at $0.7248.
The next higher four-month resistance line and last week’s high at $0.7276 to $0.7284 should prove difficult to overcome today, however.
-
1 hour ago, eileen said:
Ftse on open monday 28/02/2022 dropped below my stop but did not close position, why is this allowed???
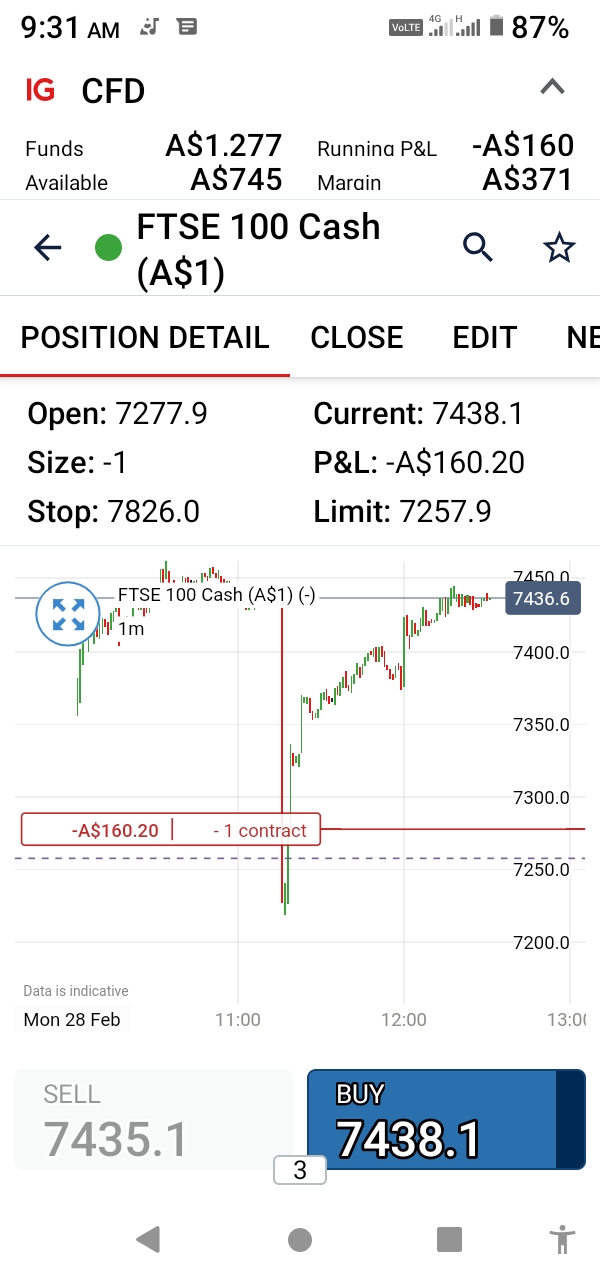
Hi @eileen,
There was a pricing issue on the chart that has been rectified since this morning. It seems that the lowest level didn't reach your Limit level at 7257.9. We apologies for the confusion.
As mentioned on the chart, the data is indicative, if the actual price reached your limit the stop would have been triggered.
If you need further assistance please reach out to helpdesk.au@ig.com.
All the best - Arvin
-
On 26/02/2022 at 12:36, HARSH2290 said:
Hi I wont able to withdraw with card as well as bank?
Hi @HARSH2290,
It is possible that you need to verify your card or bank account depending on how you deposited funds and how you would like to withdraw. Please reach out to helpdesk.au@ig.com with your account detail for further assistance.
All the best - Arvin -
The catastrophic impact on the energy and commodity markets will start to unfold as Russia is a major producer of oil, gas, aluminium, and wheat.
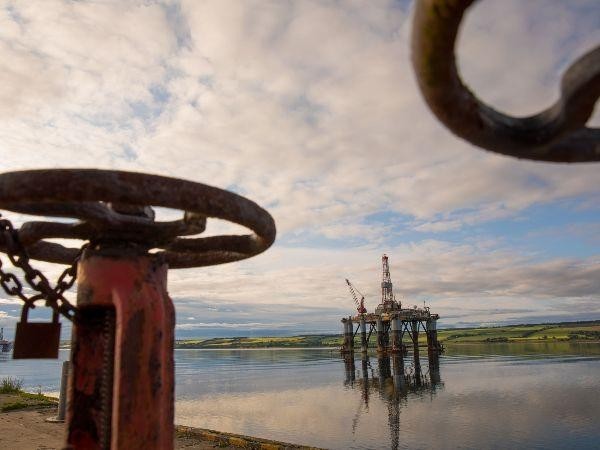
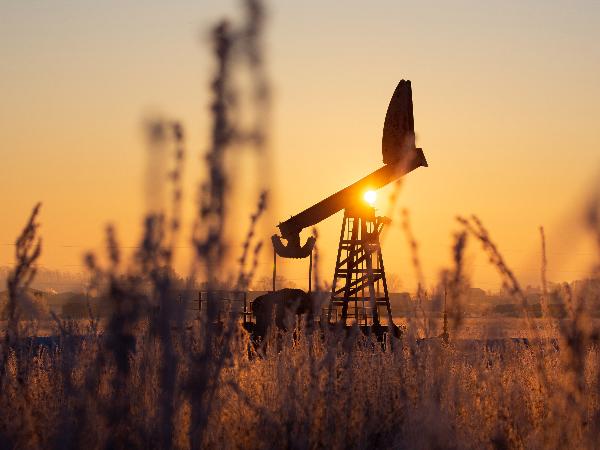
Source: BloombergEnergy prices are under the spotlight this week as the Ukraine and Russia crisis escalates each day.
Oil prices skyrocketed after Russian President Vladimir Putin signed an order to send “peacekeeping forces” to the two breakaway areas of Ukraine, a signal viewed as the first move for a Ukraine invasion. The catastrophic impact on the energy and commodity market will start to unfold as Russia is a major producer of oil, gas, aluminium, and wheat.
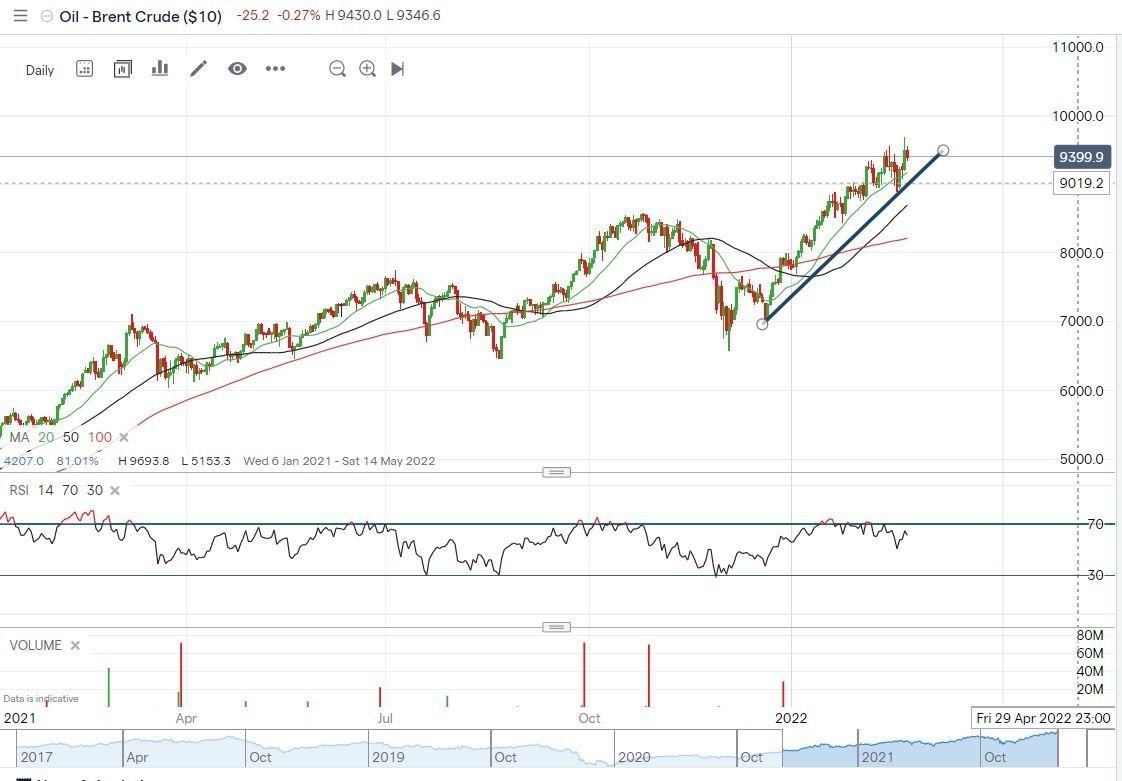
Brent Crude: New 7-year-high
Crude oil prices have rallied to near $100 a barrel, and US’s sanctions on Russian oil exports will only exacerbate the supply issue and push the prices higher.
- Brent Crude was up 3% on Tuesday with a new record of $96.93. Both short-term and mid-term momentum is poised to a higher outlook as 20 and 50 days MA has painted a steep straight line pointing north
- Current support is at $94.09. Next support can be found from 20 days, moving at an average of $91.83
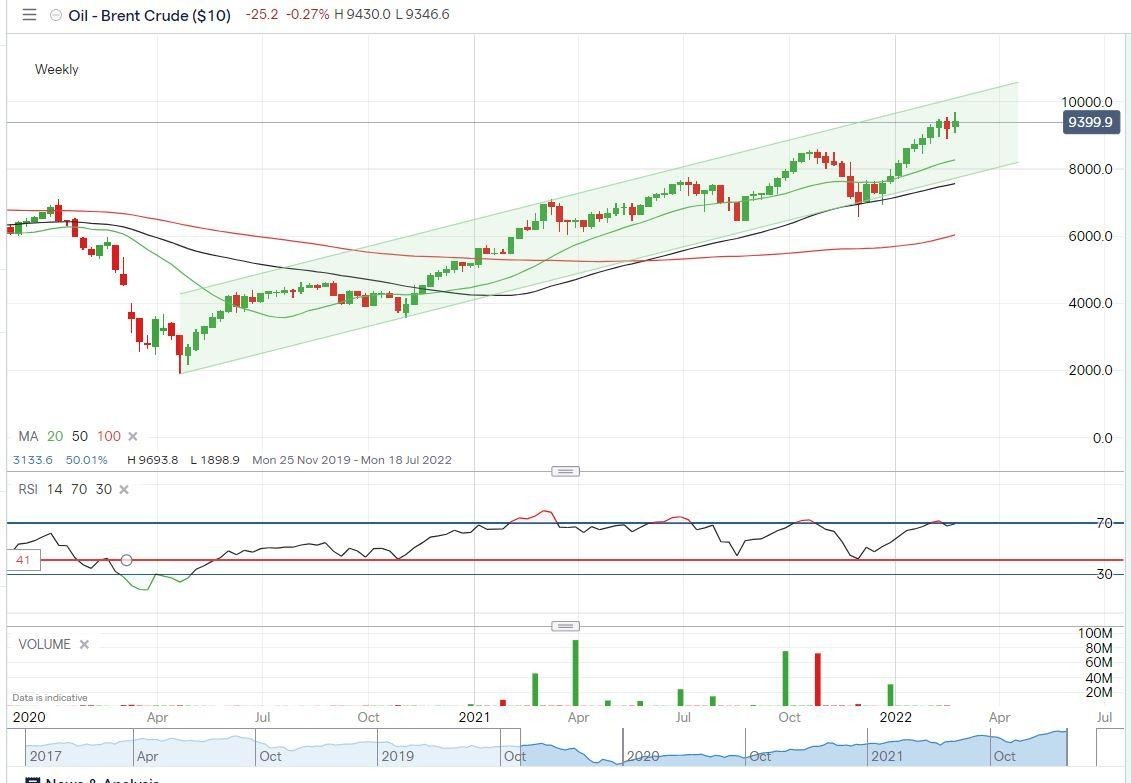
- Weekly charts show that the long-term trend line will continue since April 2020
- For buyers waiting for an entry point once the price pulls back, the RSI dictator suggest to keep close eye on the level around 41.
 Source: IG
 Source: IG
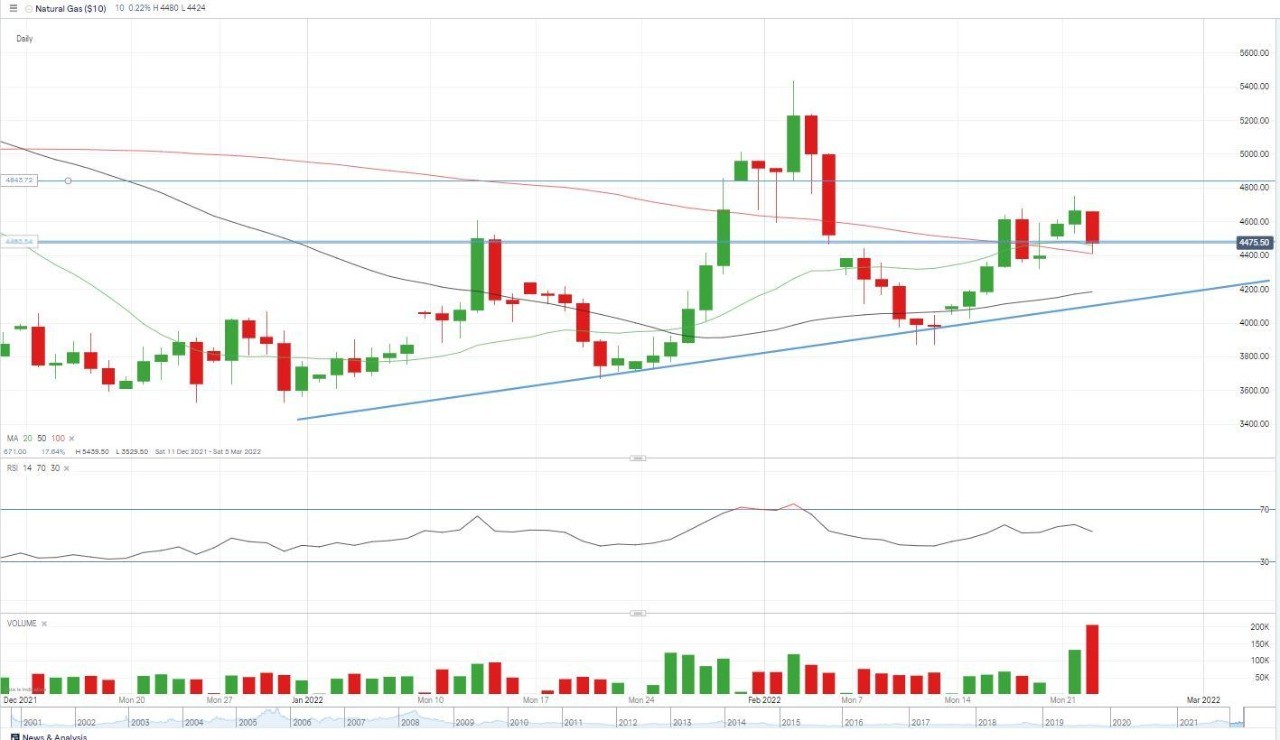
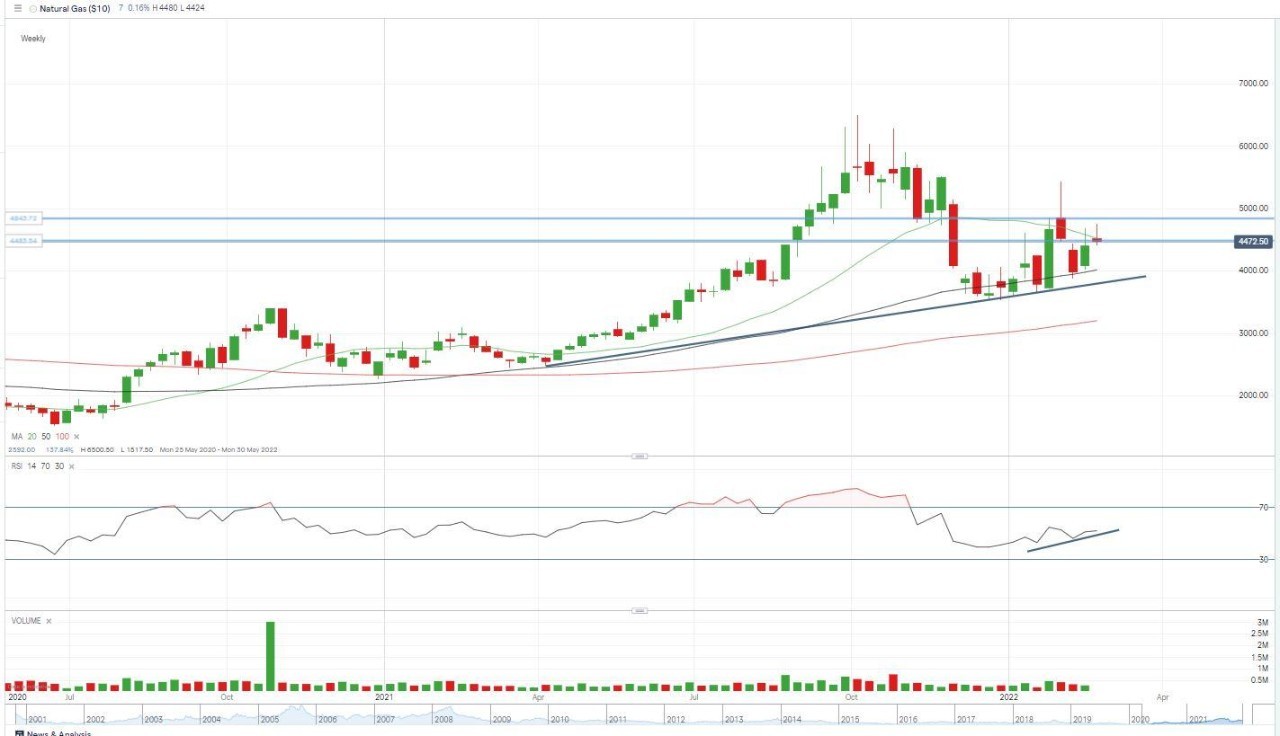
Natural Gas: 10-month long uptrend remain valid
Natural gas prices pulled back to its 100 days moving average after three straight days’ rise to the resistance level at 4670. However, long-term uptrend looks more likely to stay as the pathway since April 2021 from the weekly chart remain valid.
Next support can be found at 4335 before the 50 days moving average come to the fore. The level of 4670 will exercise as pressure again once the price of Natural gas bounced back.
 Source: IG
Natural Gas Weekly Chart
 Source: IG
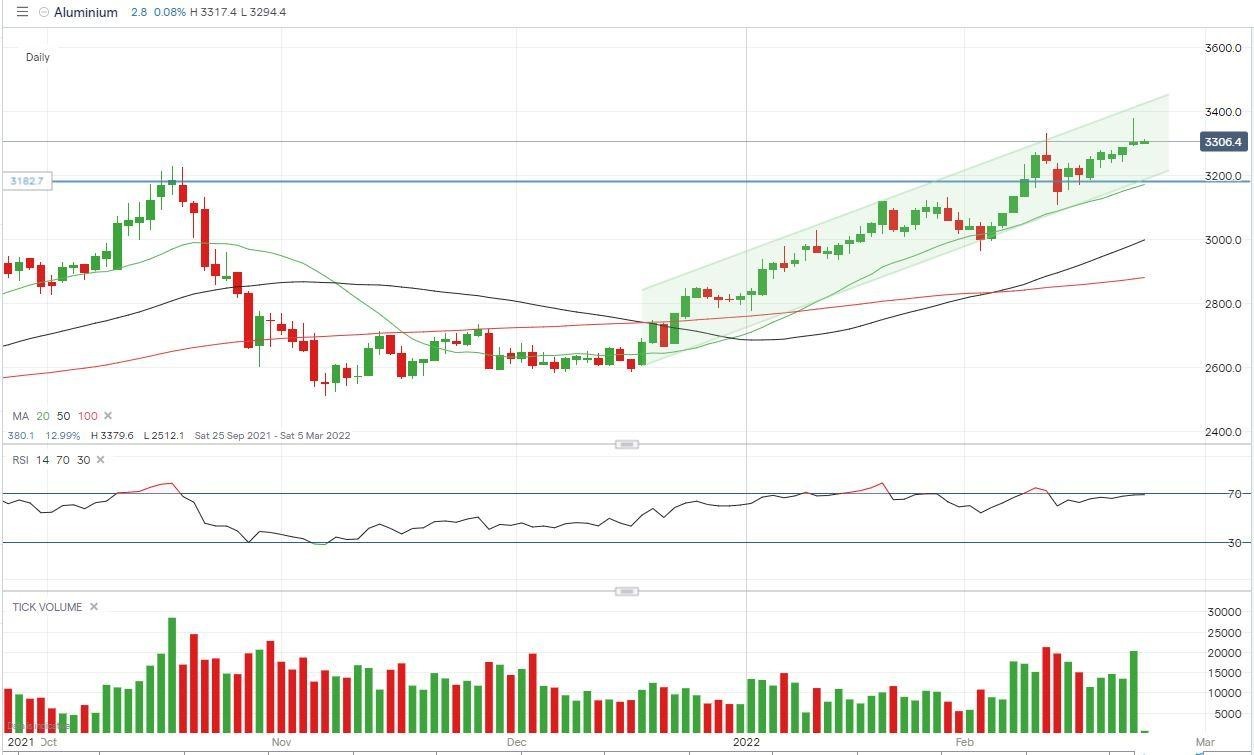
Aluminium: 11% up this month
The price of Aluminium did not stop breaking records this week. The new record for the key construction commodity was created on Tuesday at 3379.6, which is already 11% higher than its price on the 1st of February.
The recent high from February 10th, of 3334 will turn to be the current support while 3301 is another notable level. In terms of near-term targets, the upper boundary of the moving tunnel in between $3431-$3443 should be seen in the coming days.
 Source: IG
Take your position on over 13,000 local and international shares via CFDs or share trading – and trade it all seamlessly from the one account. Learn more about share CFDs or shares trading with us, or open an account to get started today.
Hebe Chen | Market Analyst, Australia
25 February 2022 -
S&P 500 enters a correction while Nasdaq sits at nearly 20% lower from its peak.
Source: BloombergStocks market’s crush accelerated on Thursday due to the growing geopolitical tension amid more countries joining the party to impose sanctions on Russia. The European Union applied sanctions to 23 high-ranking Russians and U.S. President Joe Biden targeted the Nord Stream 2 gas pipeline builder that runs from Russia to Germany. Australia also shows great support for Ukrainian by calling the world to “stand up to bullies”.
S&P 500: Enter into correction
This week’s sharp decline has sent the S&P 500 into correction territory, defined as a 10% drop from a recent high, which can be traced back to the 13th of January at around 4748. By the end of Wednesday’s trading session, the index has wiped off all the gains from June 2021. Next support in view will be the start point for the six-month-long rally from June 2021 to December 2021, looking at around 4141.
The most recent lowest level in January at 4284 became the imminent resistance level for S&P 500 to challenge, which, if broken through, could bring the 4369 in prospect. However, it’s not safe to say that the index has reached its bottom from the technical point of view as the RSI indicator still have some room to move before its floor level.
 Source: IG
 Source: IG
S&P 500 Hourly Chart
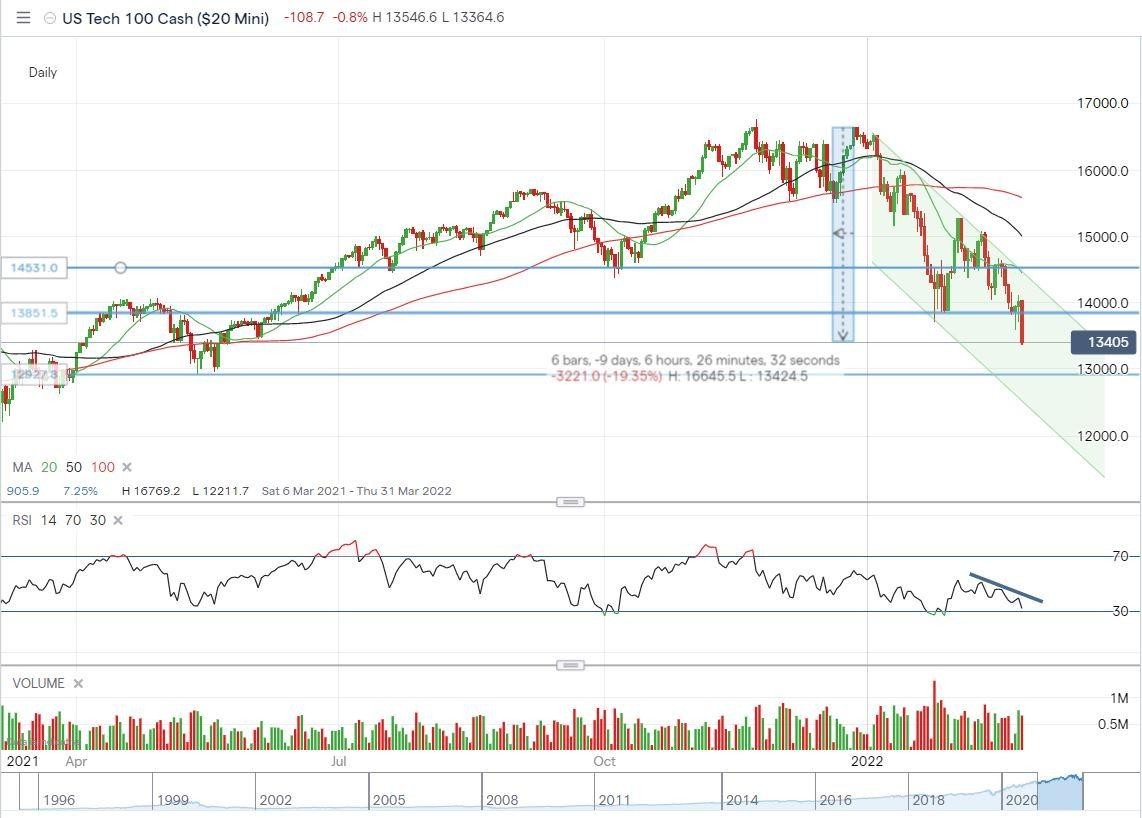
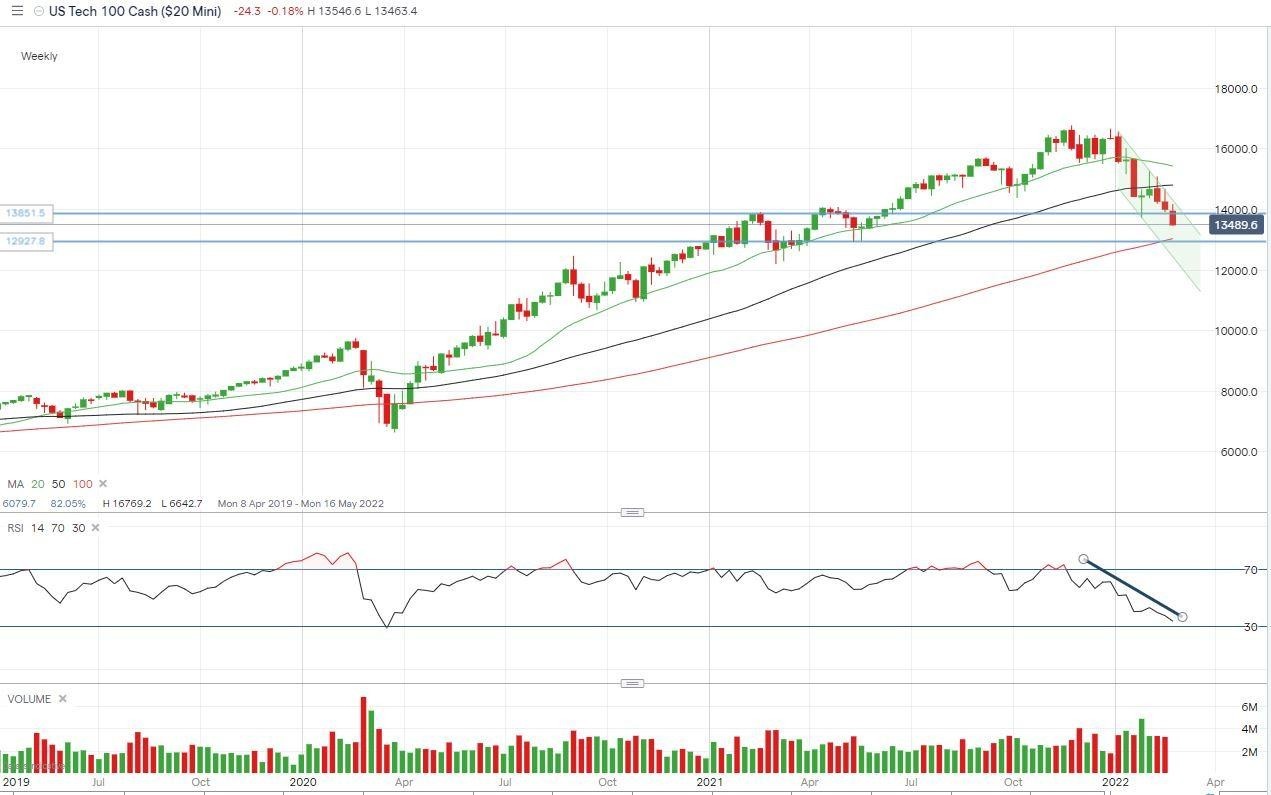
Nasdaq: Drop nearly 20% from its peak
Nasdaq has dropped back to its lowest level since June 2021 and now sits at nearly 20% lower from its peak. If looking back on the past two-year journey, most corrections were no more than 15% lower. The only greater correction than the current one was in February and March 2020, when Covid initially shocked the world, Nasdaq was down by 32%.
Overall, the index is following the downturn tunnel formed since this year and well below all the major MAs. Currently supported by the lowest from last June with the next major support at around 12903. The closest pressure line can be found at 13851. Above that will be 14531, which is a combined pressure level from the 20-days moving average and the floor level of last July and October.
Looking at the weekly chart, the support from 100 MA is still valid. Weekly RSI is moving towards its lowest level since March 2020, meaning a near-term rebound could be on the cards. However, it might be too optimistic to expect a strong bounce as the trendline for RSI suggests a very tight space for the reading to move higher for the near-term.
 Source: IG
Nasdaq Daily Chart
 Source: IG
Nasdaq Weekly Chart
Take your position on over 13,000 local and international shares via CFDs or share trading – and trade it all seamlessly from the one account. Learn more about share CFDs or shares trading with us, or open an account to get started today.
Hebe Chen | Market Analyst, Australia
25 February 2022 -
Shell and BP shares could soar as oil prices continue to rise. But both are exposed to volatility if Russia chooses to cut production.
Source: BloombergOil stocks have soared so in 2022. And this was before the escalation of current hostilities in Ukraine. The onset of the covid-19 pandemic crash saw lockdowns around the developed world. By mid-April, Brent Crude fell below $20 a barrel, while WTI Crude Futures fell below $0 as a price war erupted between Saudi Arabia and Russia.
The interconnected, globalised economy suffered its first universal shock. But by January 2021, Brent Crude had recovered to its pre-pandemic price point of around $60. And as the world’s economies reopened, the demand for all forms of energy surged, leaving suppliers struggling to increase output.
US Energy Information Administration data shows ‘commercial inventories in the OECD ended the month at 2.68 billion barrels, which is the lowest level since mid-2014.' Brent Crude is now hovering just under $100. Before recent geopolitical developments in Ukraine, the Bank of America Corp was predicting $120 by the end of June. But now, it could rise far higher.
Oil stocks and the Ukraine crisis
A brief precis: Russian President Vladimir Putin has given a speech declaring the Minsk peace agreement void and has questioned the right of Ukraine to exist as a sovereign state. He has authorisation from the Russian Parliament to deploy armed forces abroad and amassed at least 150,000 troops on Ukraine’s borders. Russia says these troops will be ‘peacekeepers,’ claims denounced as ‘nonsense’ by the US.
A full-scale invasion of Ukraine could be imminent. Of course, de-escalation is still possible. But without knowing Putin’s motives, it’s impossible to know how far the situation will deteriorate. Ukraine is in a state of emergency, is conscripting reservists, and is already under cyber-attack.
Russian banks, MPs, oligarchs, and sovereign debt have all been targeted by Western sanctions. Most significantly, Germany has halted the approval of Nord Stream 2. US President Jo Biden has warned Russia will ‘pay an even steeper price if it continues its aggression.’ Two years ago, former President Trump previously placed sanctions on US oil giant Rosneft. And the UK’s Boris Johnson has said ‘there is more to come.’
In response, Russia’s Foreign Affairs Ministry has warned of a ‘painful’ response to US sanctions, warning it would target ‘sensitive’ US assets. Former Russian President Dmitry Medvedev has already threatened a ‘brave new world’ which would see already sky-high gas prices double across Europe.
Source: BloombergWhere next for FTSE 100 oil stocks?
Both BP and Shell recorded bumper profits in 2021; BP made $12.8 billion, while Shell generated $19.3 billion. BP CEO Bernard Looney has called the company a ‘cash machine,’ and there could be more cash to be made. The companies are predicted to make a combined $55 billion profit in 2022 leading to widespread calls for windfall taxes.
But now Nord Stream 2 is staying closed, perhaps permanently. While only 3% of the UK’s gas needs are met by Russia, the increased demand for alternative sources like Liquefied Natural Gas (LNG) will send the gas price sky-high. This will have a knock-on effect on oil, as countries turn to relatively cheaper alternatives.
However, a bigger impact on oil stocks could come on 2 March. The Organisation of Petroleum Exporting Countries and its partners (OPEC+) is convening their monthly meeting to decide April’s strategy. The current strategy is to add 400,000 barrels of crude oil a day to the markets to maintain high prices while steadily raising supply.
But Clearview Energy Partners believes Putin could retaliate by cutting oil production under the guise of plausible deniability. This could include cutting oil exports but blaming it on cyberattacks or conflict damage. However, Reuters has reported a Senior US State Department official stressing that ‘sanctions…are not targeting and will not target oil and gas flows.’
BP has the most to lose if Russia cuts production. It owns nearly 20% of Rosneft, and Looney sits on the Russian company’s board. It contributed $2.4 billion in profits to BP in 2021, and about a third of BP’s oil production came from Russia last year. Shell is less invested; while maintaining a stake, it was forced to cede control of its LNG project on Russia’s Sakhalin Island to state-owned Gazprom in 2006.
The FTSE 100 oil stocks could soar as oil prices rise. But as the conflict deepens, nobody could be the winner.
Go short and long with spread bets, CFDs and share dealing on 16,000+ shares with the UK’s No.1 platform.* Learn more about trading shares with us, or open an account to get started today.
* Best trading platform as awarded at the ADVFN International Financial Awards 2021
Charles Archer | Financial Writer, London
24 February 2022-
1
-
-
5 hours ago, skylarkprojects said:
I have contacted the helpdesk again to say they are onto it so am just waiting for a reply.
Hi @skylarkprojects,
Thank you for your post. Alternatively you can reach out to webapisupport@ig.com, this email address is specific to API support and might have more knowledge to assist.
All the best - Arvin -
6 hours ago, MITH said:
hi
transferred fund to ig account 2 hr back (fast payment). i am waiting more than 2 hr not able to credit my ig account.
i am facing this issue 4th time this month. everyone facing this kind of issue?
Hi @MITH,
The best thing to do would be to contact the IG helpdesk with a proof of payment for the funds to be credited as soon as possible. You can reach out via the live chat or helpdesk@ig.com.sg.
All the best - Arvin -
11 hours ago, hollis795 said:
I signed up for a Demo account a few days ago and started a spread-betting Watchlist with about 10 shares.
I then opened a position on one of the shares.
Today, however, all those shares have disappeared from the Watchlist and, if I search on recent transactions,
none show up.
What have I done wrong?Hi @hollis795,
Could you please confirm that you followed these steps?
1. Create Watchlist and edit the name:
2. Right click on market you would like to add and select relevant Watchlist
You can alternatively Add the stock from the chart as below:
3. Finally Select Watchlists > Your new Watchlist and it should automatically save all your selected markets:
If after all these steps your Watchlists is not saving automatically please reach out to helpdesk.uk@ig.com for further assistance.
I hope that it helps !
All the best - Arvin -
A calmer atmosphere has seen risk appetite boost the euro and sterling against the dollar, lifting USD/JPY.
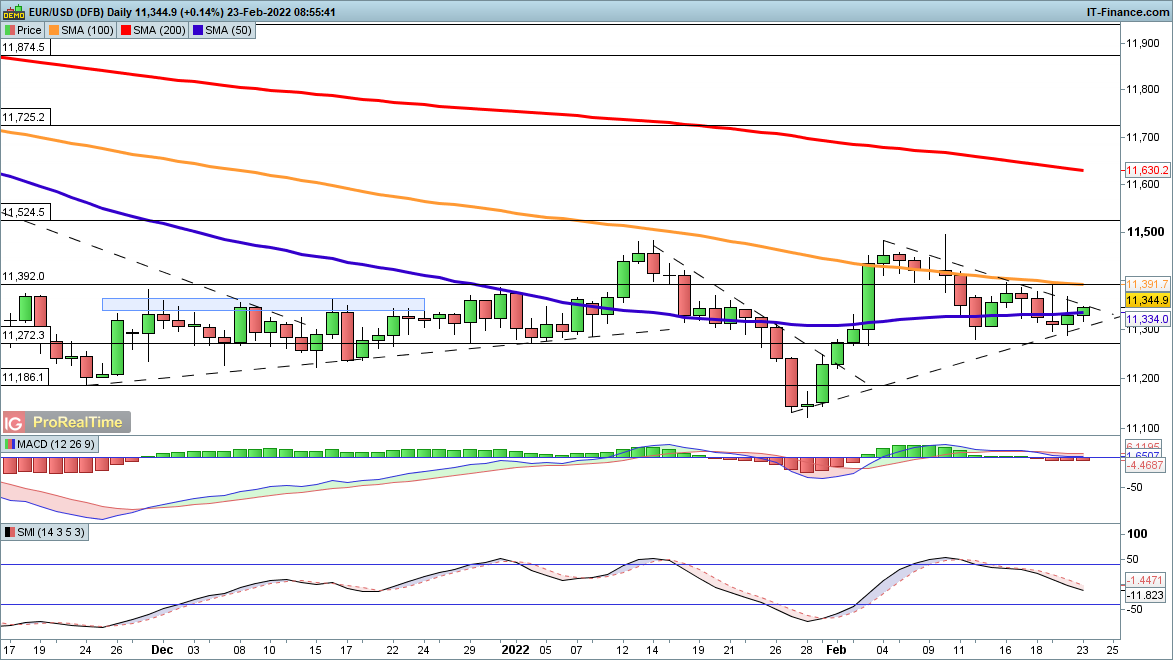
EUR/USD holds at trendline support
After falling back last week the price has begun to recover with EUR/USD, finding support at the rising trendline from the lows of late January. The run of lower highs since the beginning of the month means that a rally above $1.135 would mark a change and a potential break to the upside. This would bring the February high at $1.149 into view.
A reversal back below $1.13 would see a break of trendline support and revive the bearish view.
 Source: ProRealTime
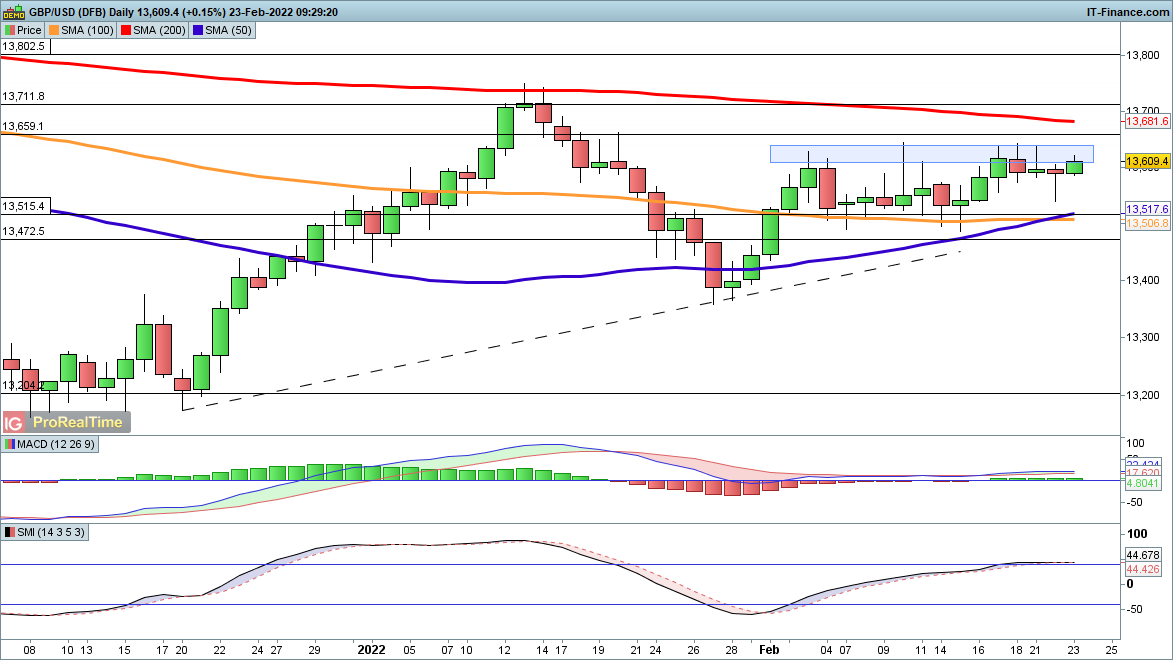
GBP/USD looks to push higher
Tuesday’s bounce with GBP/USD has put the buyers back in charge, although they must now push the price on above $1.363, which has marked the limit of gains since the beginning of the month. If this cannot be broken then further sideways movement may result.
A move back below $1.355 would potentially mark the beginning of a deeper turn lower.
 Source: ProRealTime
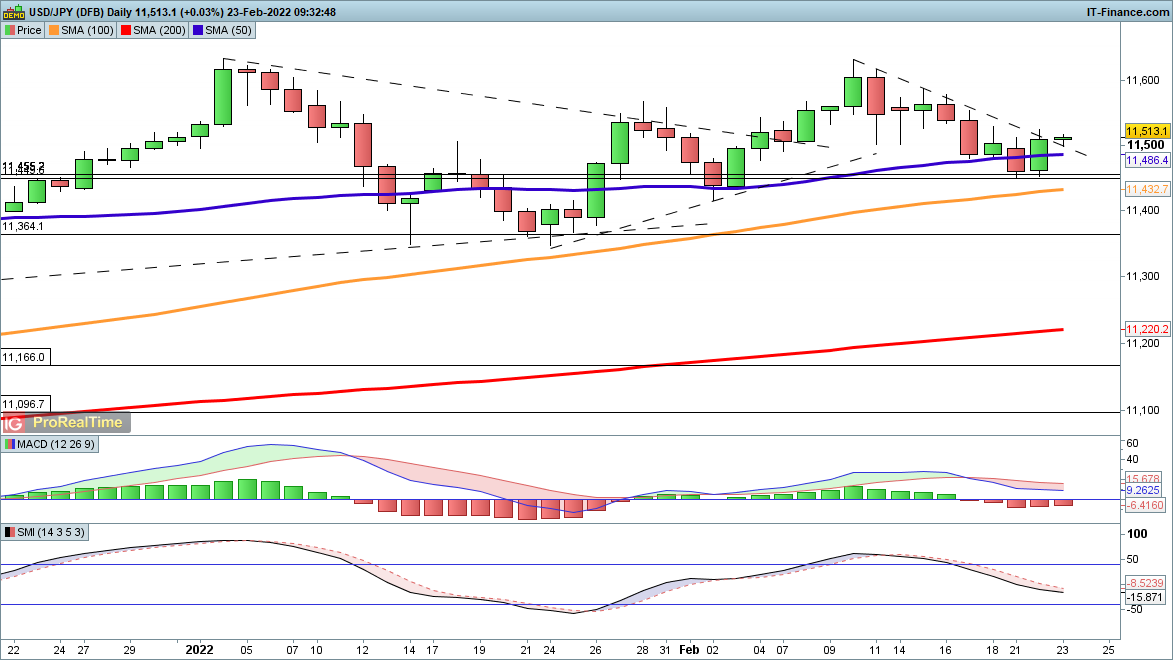
USD/JPY recovers 50-day MA
The bounce yesterday with USD/JPY put the price back above the 50-day simple moving average (SMA) at ¥114.86. A higher low may form, and provide a further bullish impulse that may bring ¥116.00 into view.
Today has seen the price open above trendline resistance from the February peak, bolstering a more bullish view. It would require a reversal back below ¥114.50, reversing Tuesday’s gains.


question regarding the epics
in Foreign Exchange (FX)
Posted
Hi @TylerDurden2,


CS.D.EURUSD.CFD.IP would be for CFD normal lots 100,000
CS.D.EURUSD.MINI.IP is for CFD mini lots 10,000
To find the EPIC you will need to go on the relevant market then click on open in new window :
In the new window address you will find the EPIC:
I hope that it helps !
All the best - Arvin