

ArvinIG
-
Posts
1,728 -
Joined
-
Last visited
-
Days Won
23
Content Type
Profiles
Forums
Blogs
Events
Community Tutorials
Store
Posts posted by ArvinIG
-
-
8 hours ago, Sanchi said:
What is minimum amount to deposit in DMA account
Hi @Sanchi,
The minimum deposits are the same as your normal account. You will find it on My IG > Live accounts > Deposits.
All the best - Arvin -
16 minutes ago, kevinhi_au said:
I bought AfterPay shares which was listed in ASX before and now it has been converted to Block (AU) which was listed in US market. Somehow, when it is converted, the average price become zero.
Hi @kevinhi_au,
Afterpay Limited (APT) (Afterpay Limited) have entered into a Scheme Implementation Deed (SID) with Square, Inc. (Square) which a Corporate Actions (CA) The Block shares have been issued as a result.
When there is a CA the CA Team will book shares at the level price of 0. You will need to edit your book cost.
To do so please follow the guide on : https://www.ig.com/au/help-and-support/investments/share-trading/how-do-i-edit-my-book-cost
I hope that it helps.
All the best - Arvin-
 1
1
-
-
NASDAQ 100,HANG SENG INDEX, ASX 200 INDEX OUTLOOK:
- Dow Jones, S&P 500 and Nasdaq 100 closed -0.49%, -0.38%, and +0.10% respectively
- Rising geopolitical tensions and concerns about a faster pace of Fed tightening weighed on sentiment
- Asia-Pacific markets look set to open mixed. Crude oil prices climbed to fresh 7-year highs
Nasdaq 100, Hang Seng Index, Crude Oil, Inflation, Asia-Pacific at the Open:
US markets ended broadly lower on Monday, but technology shares bucked the trend and finished mildly higher. Tesla (+1.83%), Nvidia (+1.33%) and Amazon (+1.22%) were among the best performers in the Nasdaq 100 index. Investors mulled heightened geopolitical tensions between Russia and Iran after US National Security Adviser Jake Sullivan said on Friday that an imminent invasion is possible. Crude oil prices surged to fresh 7-year highs as traders worried about supply disruption between Russia and the European Union if the situation deteriorate further.
Rising crude oil prices spurred inflation concerns and may urge the Fed to tighten monetary policy at an accelerated pace. Fed bank of St. Louis President James Bullard said on Monday that the central bank needs to “front-load” rate hikes to restore its credibility and contain inflation. “We’ve been surprised to the upside on inflation. There is a lot of inflation”, he said during a TV interview.
Recently, Fed officials have become more hawkish-biased after a much stronger-than-expected nonfarm payrolls report and inflation readings in January, which underscored a tight labor market and rising wage pressures. This may urge the central bank to consider a 50bps rate hike in March and even a move in between scheduled policy reviews. The prospect of a faster pace of rate hikes may continue to weigh on equity prices, especially the rate-sensitive technology and real estate sectors.
Top 10 Stocks Daily Performance in The Nasdaq 100
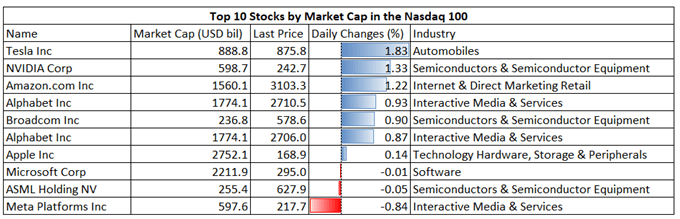
Source: Bloomberg, DailyFX
The PBOC is expected to roll over its medium-term loans maturing this week, but a second consecutive rate cut is unlikely, according to a Reuters poll. The central bank will likely issue 200 billion yuan of medium-term lending facility (MLF) loans on Tuesday, matching the amount maturing on Friday. Last month, the PBOC surprised market by cutting the rate on one-year MLF by 10bps to 2.85% from 2.95%, showing its easing stance.
Asia-Pacific markets look set to open on the back foot following a tepid US session. Futures in Japan, Australia, mainland China, Hong Kong, South Korea, Taiwan, Singapore, Thailand and Indonesia are in the red, whereas those in Malaysia and India are in the green.
Looking ahead, UK jobs report dominates the economic docket alongside Euro area GDP growth rate. Find out more from theDailyFX economic calendar.
Hong Kong’s Hang Seng Index (HSI) fell for a second day as investors mulled rising domestic Covid-19 cases and stricter social distancing measures. Economists foresee Hong Kong’s retail sales growth to drop to 0% in 2022 from 8.1% in 2021. Meanwhile, unemployment rate may rise to 4.9%.Exchange data showed that HKD 2.47 billion have fled from Hong Kong on Monday via stock connections, marking a 3rd consecutive session of net outflow (chart below). This suggests that mainland investors have turned bearish on Hong Kong stocks in the near term, rendering them vulnerable to a technical pullback.
Southbound Flow vs. Hang Seng Index
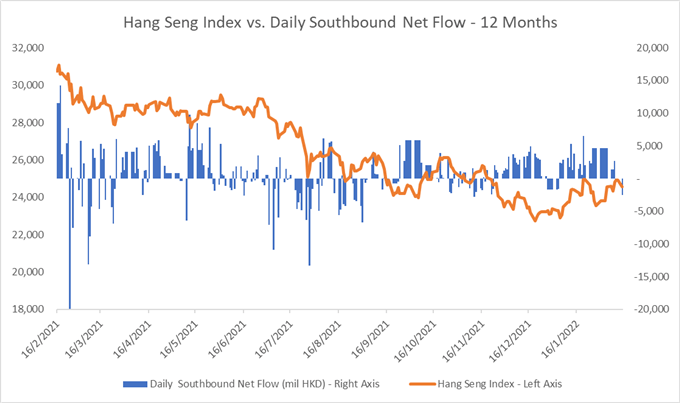
Source: Bloomberg, DailyFX
Nasdaq 100 IndexTechnical Analysis
The Nasdaq 100 index is trending lower within a “Descending Channel” as highlighted on the chart below. An immediate support level can be found at around 14,180 – the 61.8% Fibonacci extension. Failing to hold above this level would bring the next support level of 13,740 into focus. The MACD indicator is about to form a bearish crossover beneath the neutral midpoint, suggesting that the overall momentum remains weak.
Nasdaq 100 Index– Daily Chart
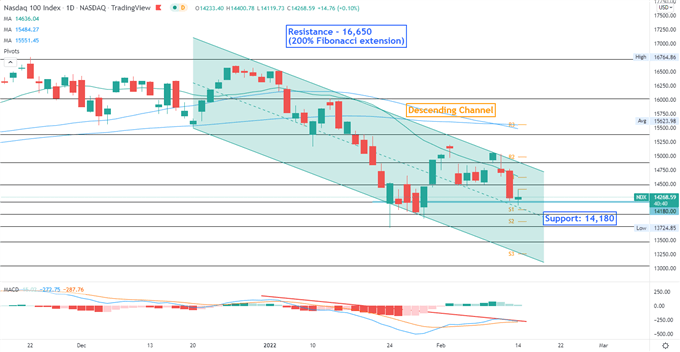
Chart created with TradingView
Hang Seng Index Technical Analysis:
The Hang Seng Index (HSI) breached above a “Falling Wedge” pattern from the upside. Prices have reversed lower to test the upper trendline for support, holding above which may pave the way for further upside potential. An immediate resistance level can be found at around 24,900 – the 127.2% Fibonacci extension. Breaching above this level may expose the next resistance level of 25,600. The MACD indicator is trending higher above the neutral midpoint, underscoring bullish momentum.
Hang Seng Index – Daily Chart
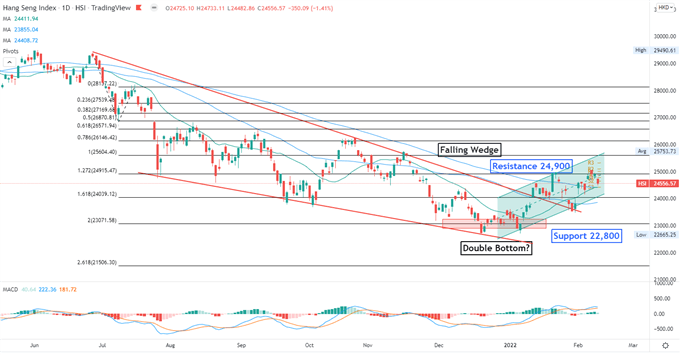
Chart created with TradingView
ASX 200 Index Technical Analysis:
The ASX 200 index returned to the range-bound zone between 7,200 and 7,500, riding a strong technical upswing. Prices have pulled back to the floor of the range looking for immediate support. The MACD indicator formed a bullish crossover beneath the neutral midpoint, suggesting that a technical rebound is underway.
ASX 200 Index – Daily Chart
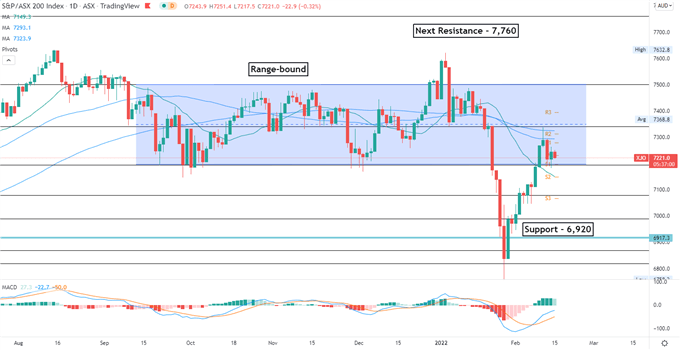
Chart created with TradingView
To contact Margaret, use the Comments section below or @margaretyjy on Twitter
DailyFX provides forex news and technical analysis on the trends that influence the global currency markets.
DISCLOSURES
Margaret Yang, Strategist for DailyFX.com
15 February 2022 -
10 hours ago, Sartois said:
Hi,
Could I request the following stock be added to the roster?
Name Of Stock - LCNB Corp
Name of Stock Exchange - NASDAQ
Leverage or share dealing - Share dealing
Ticker - LCNB
Market cap - £184.6
Thanks,
Sartois
Hi @Sartois,
Your request has been submitted to the dealing desk.
Thank you - Arvin -
4 hours ago, dosua said:
Is there a possibility of using ProRealTime software on my demo account after the one month free trial? Do I have to pay or how does it work?
Thank you in advance!
Hi @dosua,
You can enable you ProRealTime demo account on My IG > Settings :
You will be able to use the PRT demo account for few months after that you will need to pay for a live PRT account to access the demo account.
All the best - Arvin -
1 hour ago, sc78 said:
Hello,
Had a quick question around Knock-out premium(FX).
Is there a view, where you can view live (current) Knock-out premium for currency pairs. Its quite troublesome, to open each pair and check the live Knock-out premium.
Thanks,
SC
Hi @sc78,
Unfortunately there is no column that shows the premium next to the pairs. I would guess that a column here would be what you are requesting ? :
I will forward your feedback to the development team.
You can see the premiums on this page but they are not updated live:
https://www.ig.com/en/help-and-support/cfds/fees-and-charges/what-are-igs-knock-outs-cfd-product-details
All the best - Arvin -
5 hours ago, kabuki said:
1) Reverse Trade instead of just close trade on limit orders
2) Slightly bigger font for price levels in desktop version
3) Compare other indices/stocks verses main
4) Capability to Split trades -making it easier to close part of specific trade. .Eg. buy 10 split trade into 5 x 2Units
5) different sound for up/down alerts
Hi @kabuki,
Thank you for your post and feedback. Your suggestions have been forwarded to the development team to be reviewed.
All the best - Arvin -
On 11/02/2022 at 23:04, SMILLER said:
also what about some Easylanguage integration like Interactive Brokers has , only reason I have an account with them. Or multicharts. I mean OANDA have multicharts link surely IG can look into this for people who want automated solutions. Is there anyway of getting this topic discussed internally ??
Hi @SMILLER,
I haven't heard about Easylanguage integration. I will forward your comment to the development team to be reviewed.
All the best - Arvin -
On 12/02/2022 at 02:54, harpalss said:
Additionally I've filled out the W-8BEN form and my tax rate should be 15%. Taking that into account I should be receiving $0.39 per share
Hi @harpalss,
Please reach out to helpdesk.uk@ig.com with your account details. Our team will be able to investigate with the help of the Corporate Action team to clarify if the dividends you received are correct or if it needs to be rectify.
If there is an error, we will credit your account with the correct amount.
All the best - Arvin -
On 12/02/2022 at 22:39, AshleyN said:
I would like to (if possible) use the API to pull all my transaction/trade history (ie every buy and sell I have ever made) for my Share Dealing and ISA accounts so I can then further analyse all my historical trade data and plot charts of total proffit loss across the years etc (rather than just the running p/l value IG gives you on your account) as well as create other analytics. I am not interested or needing to actually open/close positions.
Is there any support for this?
Using IG API Companion and switching to my ISA account for example and trying to GET positions resulted in error.public-api.failure.stockbroking-not-supported
I know I could use the CSV transaction export file but it would be a lot cleaner and fluid to use an API
Hi @AshleyN,
You can reach out to webapisupport@ig.com for API support.
All the best - Arvin -
EUR/USD, EUR/GBP and GBP/JPY under pressure post 40-year high in US inflation.
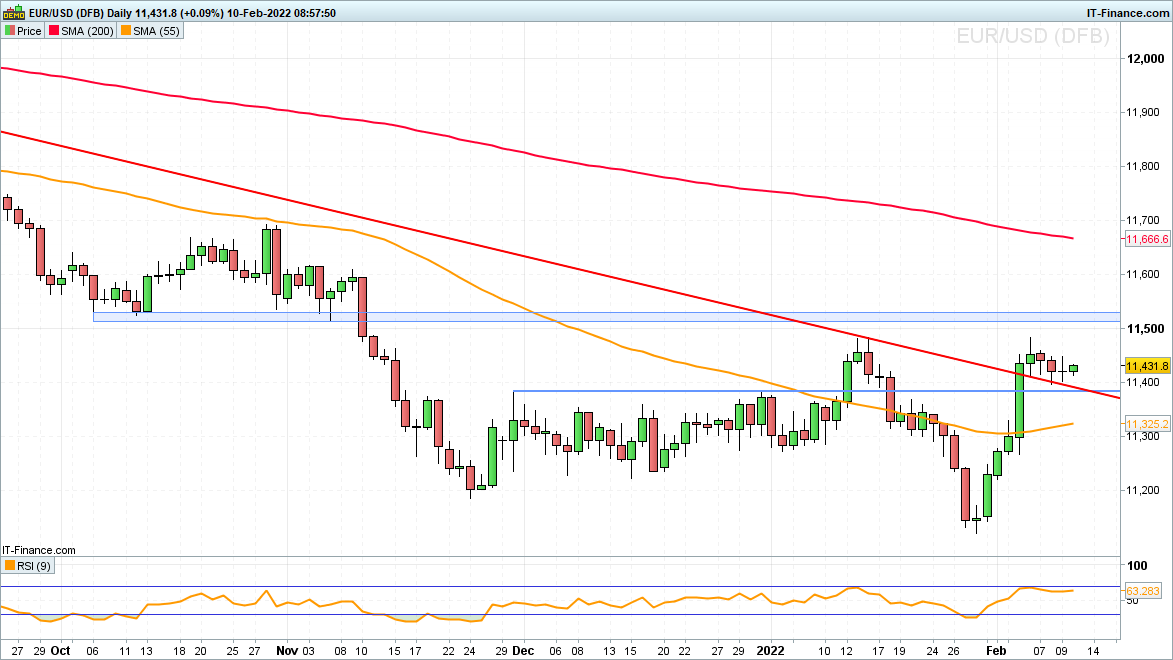
EUR/USD once again weighs on its support line and is likely to slide further
Yesterday EUR/USD briefly shot up to a three-month high at $1.1495 before US consumer price index (CPI) data came in well above market forecasts of 7.3% at a 40-year high of 7.5% in January of 2022, reversing the currency pair’s uptrend.
EUR/USD thus did a fourth ‘return to point of breakout’ in as many days by slipping to the breached 2021-to-2022 downtrend line and 20 January high at $1.1389 to $1.1369. In case of further downside being witnessed, the 55-day moving average (MA) at $1.1326 would be targeted.
The January and current February highs at $1.1482 to $1.1495 now offer solid resistance.
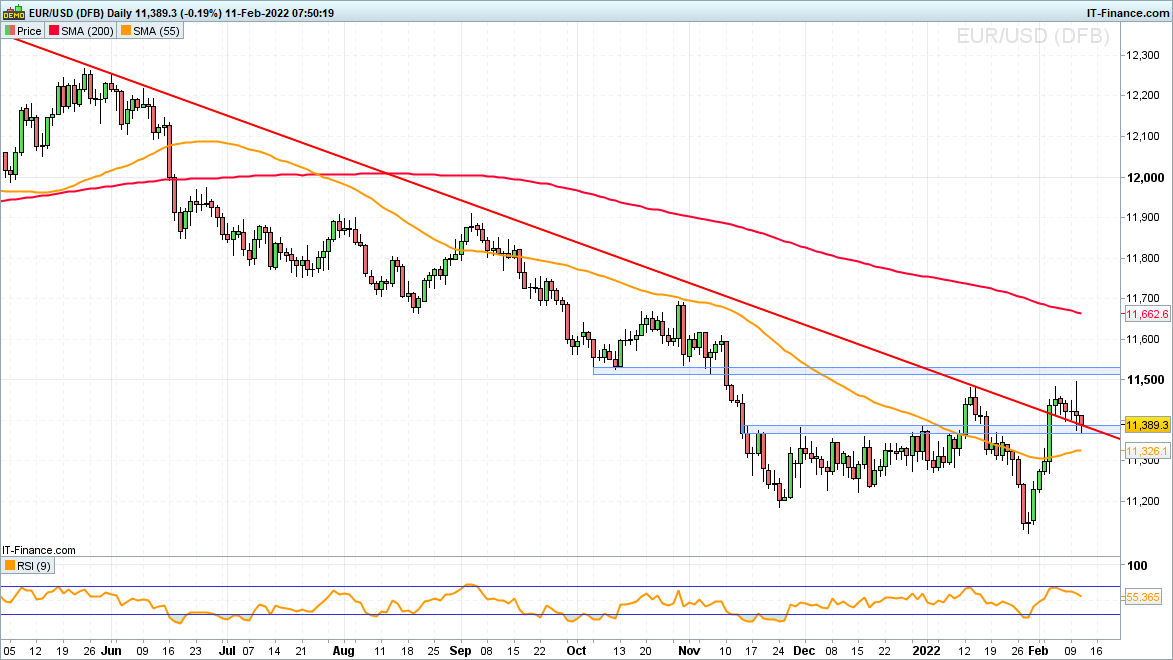 Source: IT-Finance.com
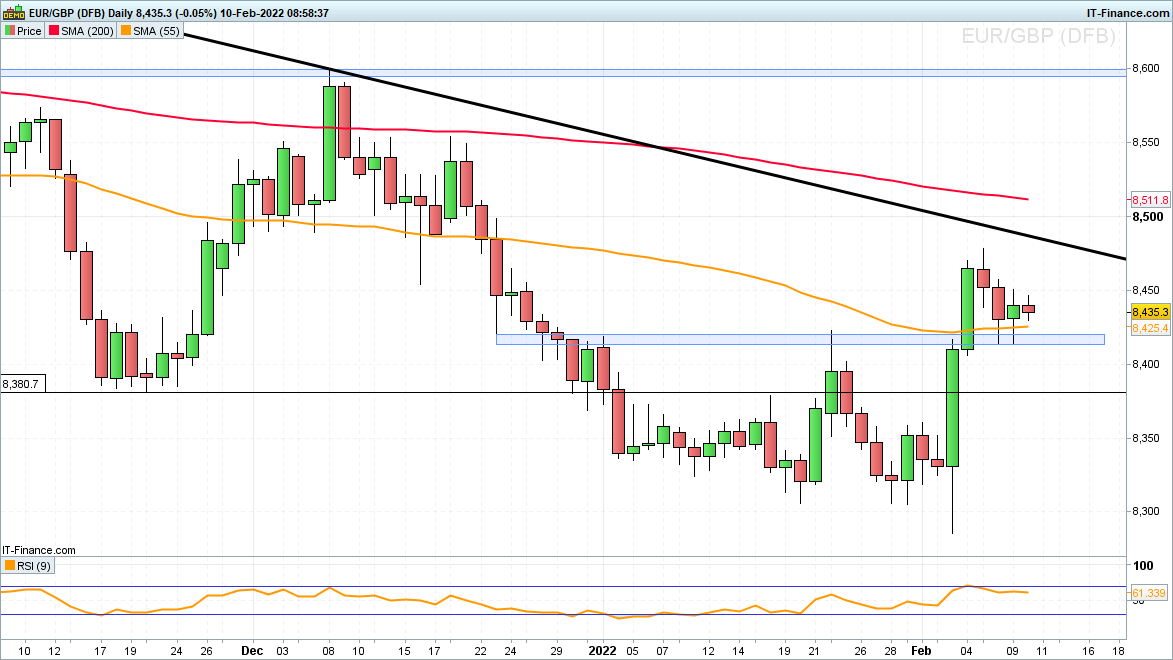
EUR/GBP is likely to decline further still
EUR/GBP now trades below the 55-day simple moving average (SMA) at £0.8424 with it slipping back towards the £0.84 mark and the November trough at £0.8381 on slightly better than expected UK month-on-month gross domestic product (GDP) and industrial production data.
Immediate resistance can be spotted at the £0.8422 late January high and above it at the mid-January £0.8454 low.
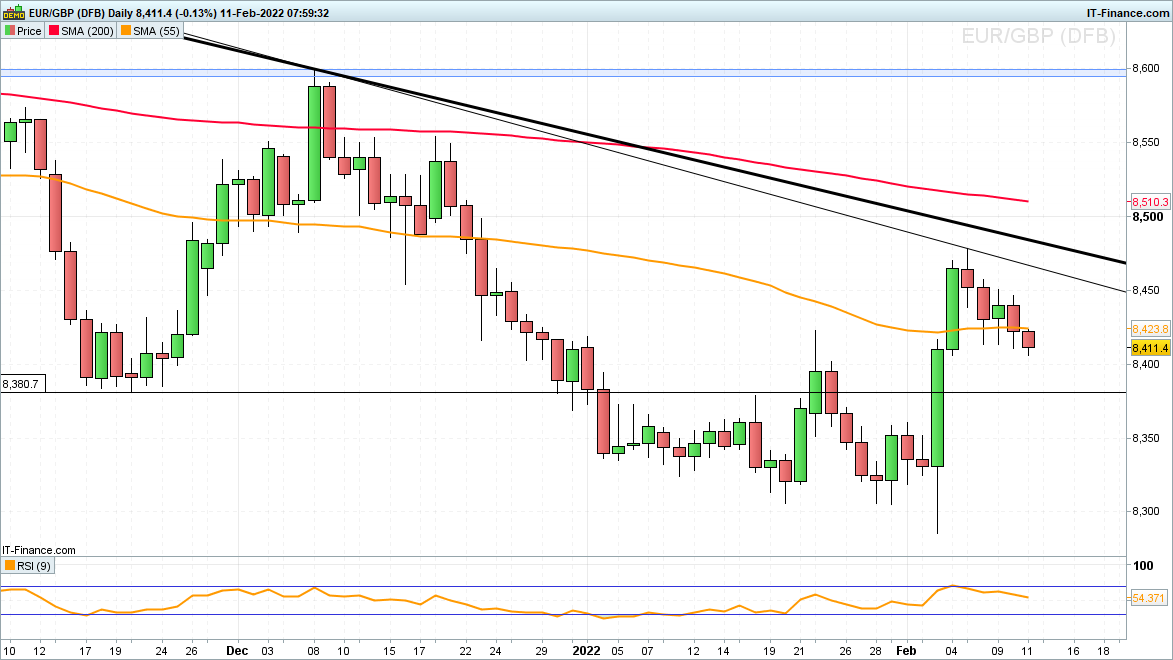 Source: IT-Finance.com
GBP/JPY rally stalls at the October peak
Yesterday GBP/JPY broke through its four-month resistance line at ¥157.55 and briefly rose above the January peak at ¥157.77, close to the October high at ¥158.22 which provoked failure, though.
Despite today’s pullback, the late January uptrend remains intact. A rise above the October high at ¥158.22 would push GBP/JPY to a 5 ½ year high and open the way for major resistance at ¥162.61 to ¥163.87 to be reached. It encompasses the June and August 2009 highs, February 2014 low and the March as well as May 2016 highs and as such may stall the advance when first tested.
Overall bullish pressure should be maintained, while the early February high and one-month support line at ¥156.51 to ¥156.05 underpin.
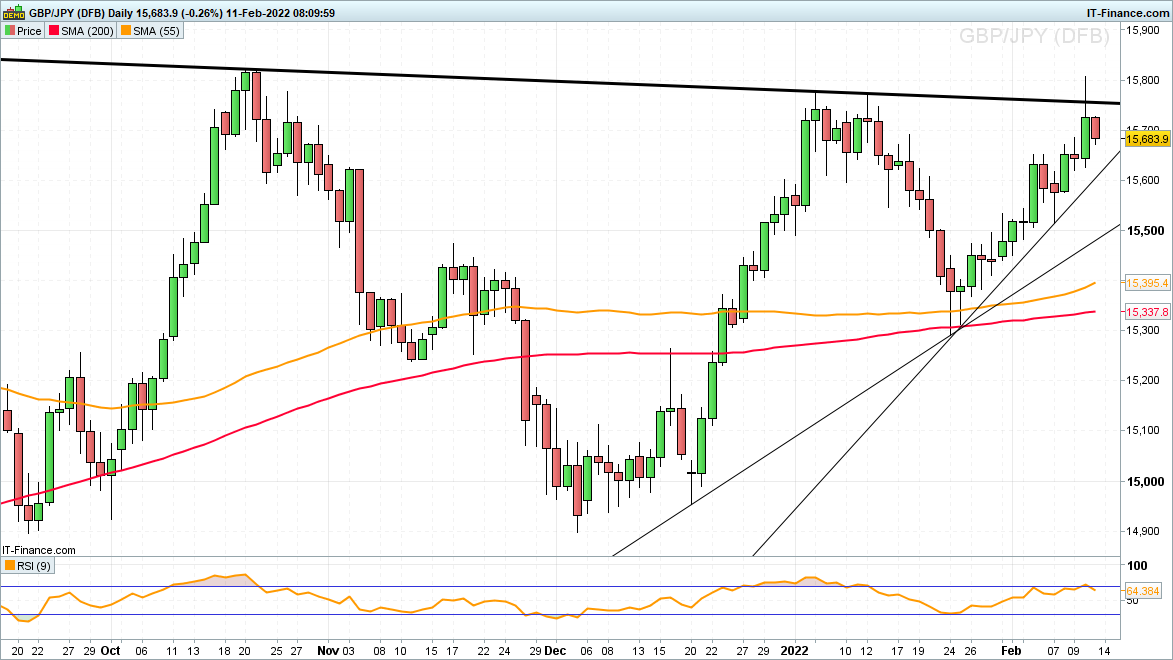 Source: IT-Finance.com
Axel Rudolph | Market Analyst, London
11 February 2022 -
On 05/02/2022 at 00:39, Pat_Rag said:
Hi I have opened the account via promotional email , and funded account as required.
AS part of partnership/ promotion, I should have the tradingview Pro+ accout as complement . However, It is more than 3 weeks now and the account is not activated.
Can someone help me how i can get this activated . IG help desk is really slow. They response after 48 hours and not sure what they need to do to resolve this.
I would appreciate it, if any help or suggestion from community.
Regards,
R
Hi @Pat_Rag,
Have you received the automated email once you opened your IG account? From that email you can apply to TV Pro+ account.
If it works you would have received a username to enable your free Pro+ account.
Could you please clarify what was the latest communication you received?
Thank you - Arvin -
On 31/01/2022 at 23:36, ms2 said:
How do I generate P/L for share dealing account for tax purposes ?
Hi @ms2,
Please find below what you will receive depending on your account type:
If you have received dividends during the tax year, you will be able to view and download your CTC (in pdf format) by going to MyIG > My Account > Statements.
This statement is usually made available one or two months after the end of the UK financial year
More details here
All the best - Arvin -
15 hours ago, Jules_B said:
Thanks, Arvin
But therein lies the problem!
Robinhood insist on new broker initiating the transfer. I'll try and reach out to them again, but so far they have not budged on this.
Hi @Jules_B,
I understand, you can reach out to helpdesk.uk@ig.com or use the live chat feature on the IG website. I believe that their answer would be similar though. Alternatively you can try transfers@ig.com but this email is to send transfer documents over.
I hope that it helps.
All the best - Arvin -
9 minutes ago, Glen1946 said:
I have listed some some share for sale - 1 day only-
they haven't sold but they haven't been added back to my total shares
How can i get them returned to my total shares?
thank you
Hi @Glen1946,
If you order was not executed the shares should be reflecting in your open positions tab. If you are referring to the share price level missing, you may need to edit your book cost :https://www.ig.com/au/help-and-support/investments/share-trading/how-do-i-edit-my-book-cost
Generally speaking the amount of shares should not change unless a trade goes through, this would reflect on your ledger summary.
For further assistance please reach out to helpdesk.au@ig.com or use the live chat feature on the IG website.
All the best - Arvin -
On 01/02/2022 at 09:56, Tja said:
hi all,
could anyone can help me to understand what's the underlying product in FX forwards on IG? I figured that spot prices are probably coming from FXCM, but can't find anything that corresponds to forward prices, and that they have similar expiry dates as futures.
many thanks
Hi @Tja,
Forex/currency forwards are derivatives that give you the obligation to buy or sell FX at a specific price, on a specific date in the future. FX forwards are traded over the counter, and they are not standardised for everyone.
When you trade FX forwards, you are agreeing to trade a currency pair at a set price on a set date in the future. This means you intend to buy one currency (base currency) and sell another (quote currency)at a predetermined price because you believe one of the currencies will strengthen against the other by a specific date.
You can find further information here.I hope that helps.
All the best - Arvin -
On 31/01/2022 at 10:36, vivaneil said:
hi is anyones plattform still on weekend settings mys been on them a week now been in touch with ig but no joy
Hi @vivaneil,
Could you please confirm if the issue is ongoing? Have you tried different browser or internet source?
Thank you - Arvin -
1 hour ago, Sumanta said:
Hi
A suggestion which would make life a lot easier for us please.
Please add commission amount to the position or history flyout pages. otherwise we need to go back to details transaction each time. same happens for exchange commission as well.
can you please also add commission to Position Opened and Closed emails please. it would be great help to get a clear picture and understand my real position.
thanks,
Sumanta
Hi @Sumanta,
Thank you for your message. Your feedback has been forwarded to the relevant department to be reviewed.
All the best - Arvin -
11 hours ago, J-JKirwin said:
Hi Anda, thank you for your quick response.
Surely there Is there another way I can transfer these? IG is the only broker I use.
Hi @J-JKirwin,
Do you hold physical share certificates or are the shares hold by a UK registrar?
https://www.ig.com/uk/help-and-support/investments/transferring-investments/how-do-i-transfer-share-certificates-or-shares-held-with-a-uk-re
Since you sent all the documents the transfer team will be able to asses how to transfer your shares over. You can reach out to transfer.
Alternatively you can reach out to heldpesk.uk@ig.com.
All the best - Arvin -
S&P 500, HANG SENG INDEX, ASX 200 INDEX OUTLOOK:
- Dow Jones, S&P 500 and Nasdaq 100 indexes closed -1.47%, -1.81% and -2.33% respectively
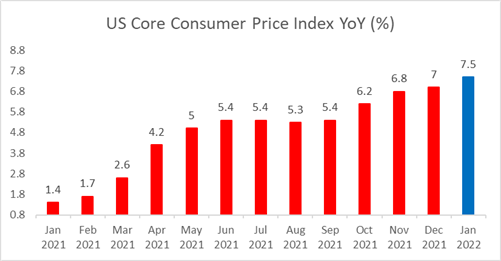
- US CPI hits 7.5% in January, the highest level since 1982 and also above a 7.3% estimate
- Asia-Pacific markets look set to open lower as investors assess rising bets on Fed rate hikes
US Inflation, Treasury Yield, Jobless Claims, Asia-Pacific at Open:
Wall Street equities tumbled on Thursday as US inflation readings topped market expectations, spurring fears that the Fed may tighten monetary policy more aggressively to rein in price levels. The consumer price index (CPI) hit a four decade high of 7.5%, compared to a 7.3% estimate. The core reading, which excludes volatile food and energy items, surged 6% in January, compared to a 5.9% estimate. This suggests that price pressures are probably more ‘entrenched’ than expected, urging the Fed to raise interest rates and end its asset purchasing program at the March policy meeting.
Source: Bloomberg, DailyFX
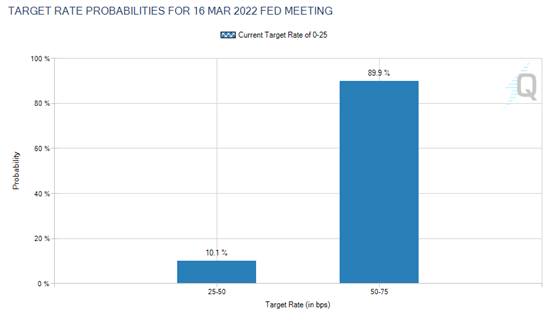
The implied probability of a 50bps rate hike in March has surged to 89.9% from 24% a day ago, according to CME’s FedWatch tool. Meanwhile, St. Louis Fed Chair James Bullard said the central bank should raise rates by 100bps by 1 July, inferring four quarter-point hikes over the next three meetings. He will not rule out the possibility of an emergency rate hike in between the scheduled policy reviews. His hawkish-biased view further strengthened the case of Fed tightening, resulting a broad pullback in equities and bonds overnight.
The Nasdaq 100 index led the decline, as the rate-sensitive and comparatively more expensive tech sector is more vulnerable to interest rate hikes and the withdrawal of liquidity. Yield on 10-year US Treasuries surpassed 2% mark for the first time since August 2019, further weighing on risk assets. This is because higher rates make their intrinsic value lower when future cashflows are discounted back at higher risk-free rates. Real estate and information technology were among the worst performing sectors overnight.
Implied Probability of Rate Hikes for March Fed Meeting
Source: CME
Meanwhile, weekly initial US jobless claims data came in at 223k, compared to a 230k estimate. The number of people filing for unemployment claims has been falling over the past three weeks, underscoring a tight market condition amid a gradual exit from Omicron-related restrictions.
Asia-Pacific markets look set to open lower on Friday following a sour lead on Wall Street.Futures in mainland China, Australia, Hong Kong, Taiwan, Singapore and Indonesia are in the red, whereas those in South Korea, Malaysia and Thailand are in the green. Japanese markets are shut for a holiday.
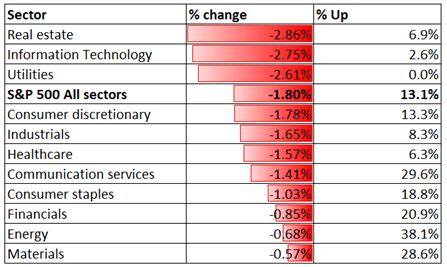
Looking back to Thursday’s close, all 11 S&P 500 sectors ended lower, with 86.9% of the index’s constituents closing in the red. Real estate (-2.86%), information technology (-2.75%) and utilities (-2.61%) were among the worst performers.
S&P 500 Sector Performance 10-02-2021
Source: Bloomberg, DailyFX
S&P 500 Index Technical Analysis
The S&P 500 index may have entered a meaningful correction after breaching below an “Ascending Channel” as highlighted on the chart below. Prices have likely formed a “Double Top” chart pattern, which is commonly viewed as a bearish trend-reversal indicator. Immediate support level can be found at around 4,300 – the previous low. The MACD indicator formed a bullish crossover beneath the neutral midpoint, suggesting that a technical rebound maybe underway but the overall momentum remains weak.
S&P 500 Index– Daily Chart
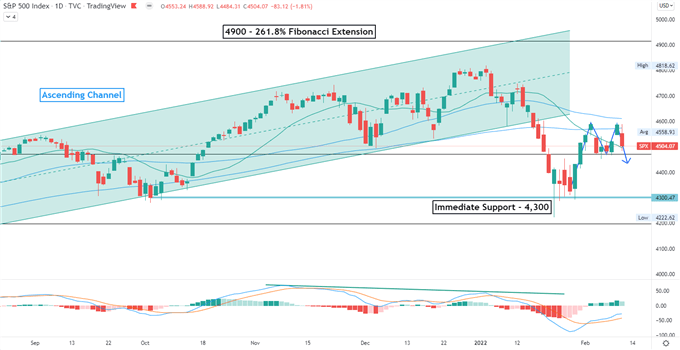
Chart created with TradingView
Hang Seng Index Technical Analysis:
The Hang Seng Index (HSI) has likely broken a “Falling Wedge” pattern from the upside, as highlighted in the chart below. Prices are eyeing a key resistance level of 24,900, breaching which may expose the next resistance level of 25,600. The MACD indicator formed a bullish crossover and trended higher, suggesting that bullish momentum may be dominating.
Hang Seng Index – Daily Chart
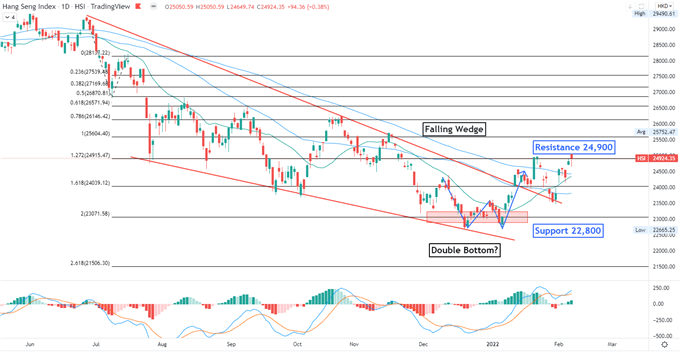
Chart created with TradingView
ASX 200 Index Technical Analysis:
The ASX 200 index is attempting to return to the range-bound zone between 7,200 and 7,500, riding a strong technical upswing. A successful attempt signals a bullish trend reversal and reveals the next resistance level of 7,340. The MACD indicator formed a bullish crossover beneath the neutral midpoint, suggesting that a technical rebound is underway.
ASX 200 Index – Daily Chart
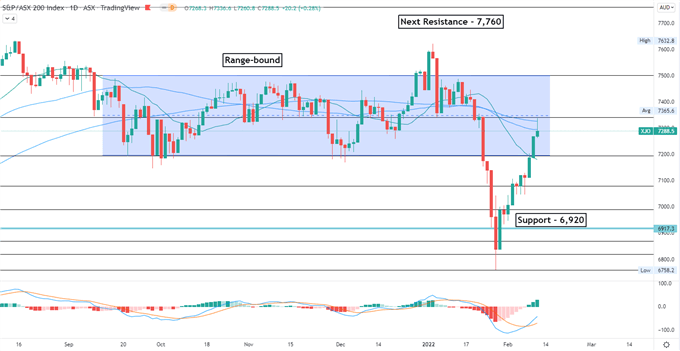
Chart created with TradingView
To contact Margaret, use the Comments section below or @margaretyjy on Twitter
DailyFX provides forex news and technical analysis on the trends that influence the global currency markets.
Margaret Yang, Strategist for DailyFX.com
11 February 2022 -
6 hours ago, SMILLER said:
IG any employee , developer . Is there any plans to integrate IG with trading view as well as some sort of easylangauge /multicharts . Please Please look into this ?
Anyone aware of this being worked on. I like IG for my ISA and long term stock holds but Id love to connect it to trading view or some automated trading ability.
Hi @SMILLER,
IG is aware that it's clients are requesting a TradingView integration. It is discussed internally but there isn't an ETA so far.
All the best - Arvin -
GOLD TECHNICAL OUTLOOK:
- Gold trading around an area of resistance in the near-term
- Long-term chart looks bullish, but may take a good while longer to mean anything
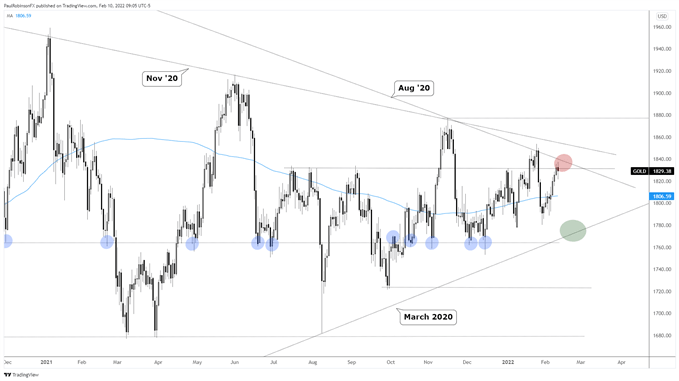
The recent rally in gold price has it running into an area of resistance that in the near-term could shift momentum back to the downside. There is horizontal resistance running over July that is in confluence with a trend-line extending down from the August 2020 high.
This could be enough to create problems looking out over the coming days. It is hard to say with conviction how convincing of a turn lower we may see given the generally choppy trading conditions we have seen since the second half of 2020.
Tactically speaking, the current area may offer an opportunity for would-be shorts who are looking for a reversion type trade, but expectations should be towards only seeing a temporary move lower until we get further clarity.
GOLD DAILY CHART
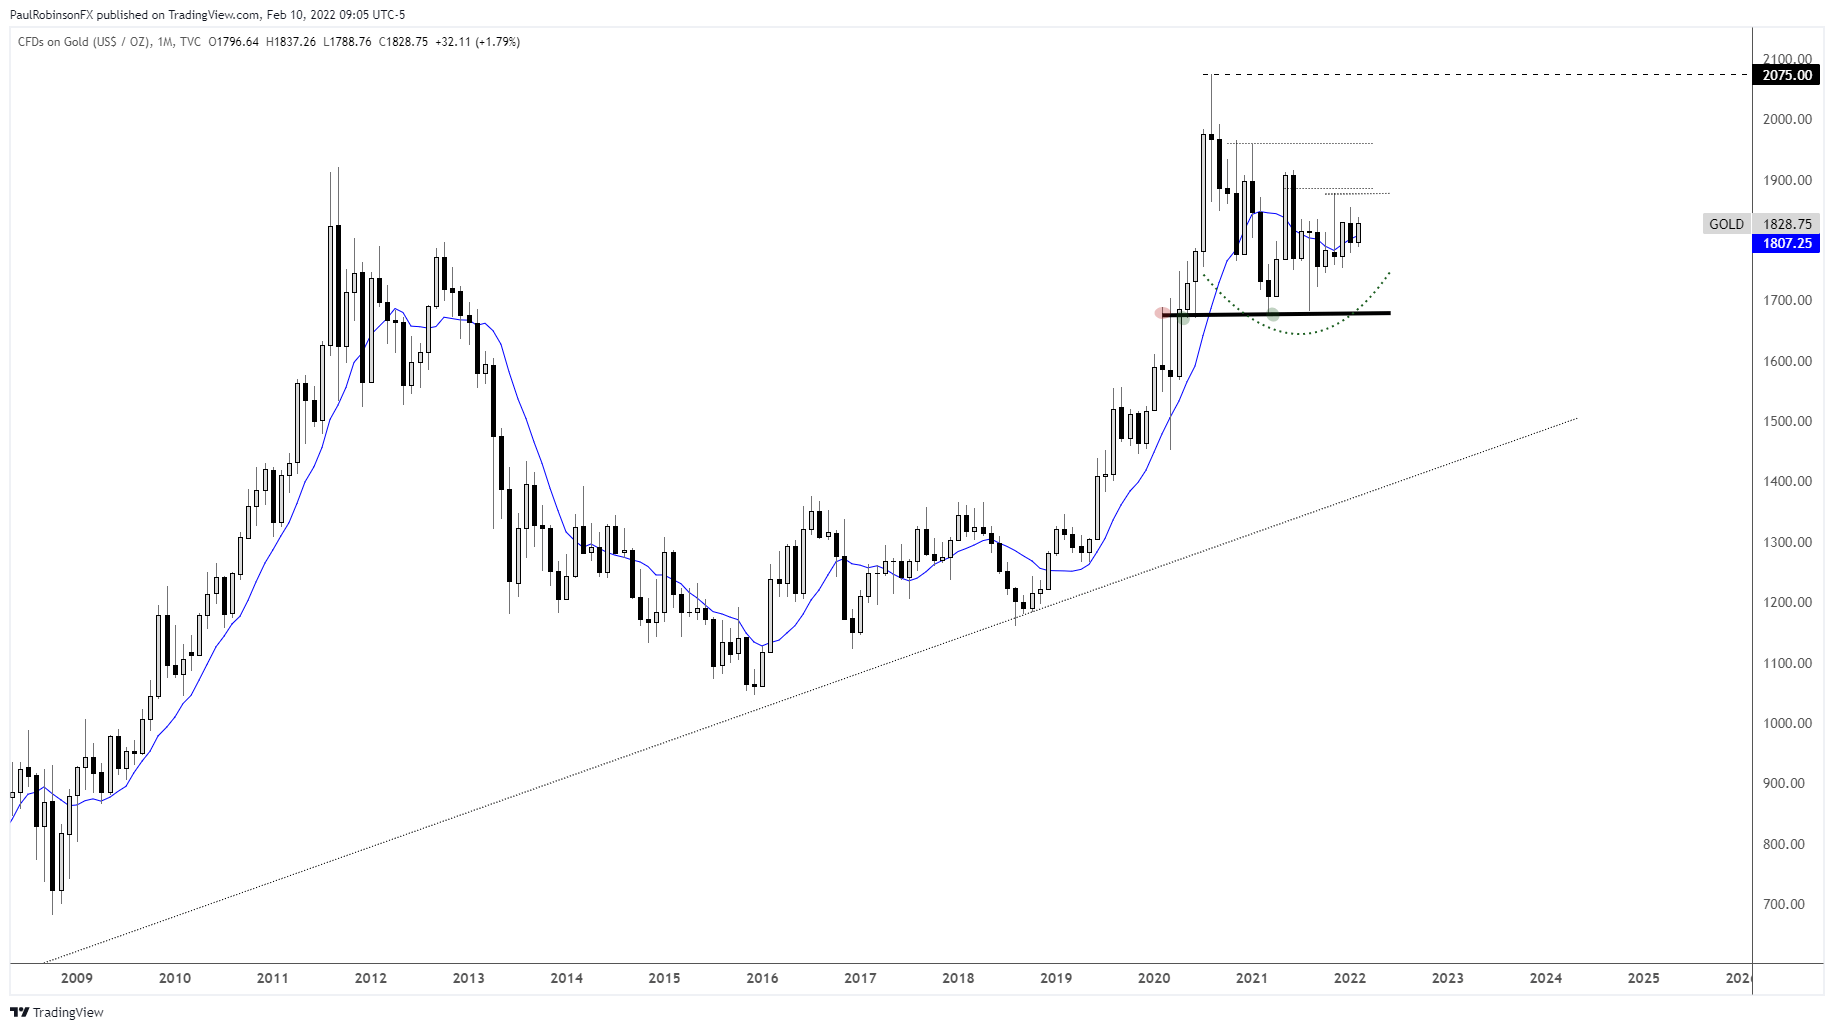
The longer-term picture is a bit clearer. Dialing back to a monthly chart the up trend in gold is still well intact even if it feels like it isn’t given what has happened since 2020. The time since the August 2020 high is looking more and more like a consolidation that will lead to another bull market surge at some point.
The operative words being “at some point”. It’s been over a year-and-a-half period of nothingness and the time for a big move may be a good number of months away. But nevertheless a move higher at this juncture looks like the more probable outcome.
One scenario that could really set things up nicely, and this is only a rough scenario at this time. If we see gold weaken below big support around 1676, the March 2021 low, and quickly recover back above. It would be viewed as a wash-out move that gets remaining longs to capitulate.
Gold has failed to rally with the overall commodity bull market and deliver as an inflation hedge. Bitcoin has been a problem for the ‘old-school store of value’. Gold’s inability to act well has certainly taken its toll on long-term bulls, a final rinse and reverse may be just what gold needs.
But even if that scenario doesn’t evolve and gold starts to surge higher by taking out 1916 for starters, a bullish bias could quickly reassert itself and gear up gold for a move well into new record territory.
GOLD MONTHLY CHART

Resources for Forex Traders
Whether you are a new or experienced trader, we have several resources available to help you; indicator for tracking trader sentiment, quarterly trading forecasts, analytical and educational webinars held daily, trading guides to help you improve trading performance, and one specifically for those who are new to forex.
You can follow Paul on Twitter at @PaulRobinsonFX
DailyFX provides forex news and technical analysis on the trends that influence the global currency markets.
Paul Robinson, Market Analyst, DailyFX
11 February 2022-
1
-
AUSTRALIAN DOLLAR OUTLOOK:
- AUD/JPY rates have been rejected at symmetrical triangle resistance as well as the ascending trendline from the March 2020 and August 2021 lows.
- Similarly, AUD/USD rates have failed after attempting to breakout above bullish falling wedge resistance.
- However, per the IG Client Sentiment Index, both AUD/JPY and AUD/USD rates retain bullish biases.
RISK REVERSAL DRAGS DOWN AUD
Both AUD/JPY and AUD/USD rates have had a strong first two weeks to February, following ‘risk’ higher, generally speaking: higher bond yields, which have hurt safe haven currencies; higher equity markets; and higher commodity prices. But today’s price action is disconcerting, to say the least. Rejections at critical resistance in both pairs suggests that the recent rallies may be exhausted in the short-term.
AUD/USD RATE TECHNICAL ANALYSIS: DAILY CHART (FEBRUARY 2021 TO FEBRUARY 2022) (CHART 1)
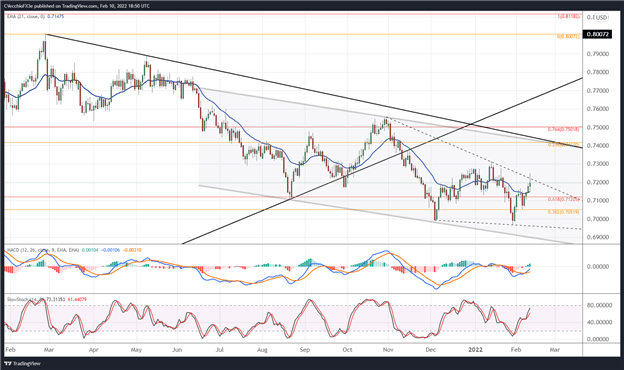
For the past several weeks, AUD/USD rates have remained in the clutches of two multi-month technical patterns, the descending parallel channel in place since the end of June as well as the breakdown below the rising trendline from the March 2020 and August 2021 lows. A third pattern has emerged over the past three-plus months as well: a potential bullish falling wedge. But today’s price action has produced a strong reversal after reaching wedge resistance, the descending trendline from the October 2021 and January 2022 swing highs.
The pair is above their daily 5-, 8-, 13-, and 21-EMA envelope, which is in bullish sequential order. While daily Slow Stochastics are trending higher, they have yet to reach overbought territory, and while daily MACD is trending higher, it remains below its signal line. A lack of agreement among momentum indicators suggests that AUD/USD rates may pullback before another attempt at cracking wedge resistance.
IG CLIENT SENTIMENT INDEX: AUD/USD RATE FORECAST (FEBRUARY 10, 2022) (CHART 2)
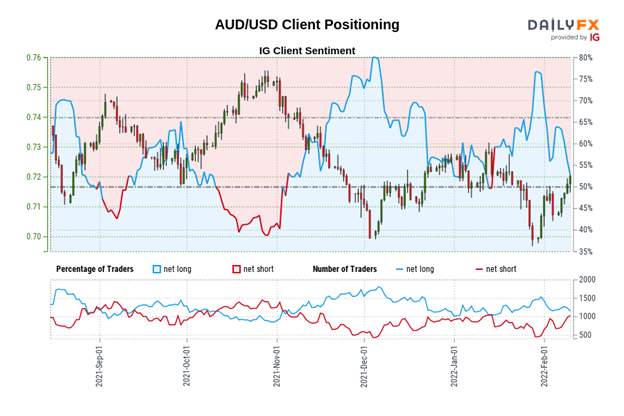
AUD/USD: Retail trader data shows 51.31% of traders are net-long with the ratio of traders long to short at 1.05 to 1. The number of traders net-long is 12.51% lower than yesterday and 8.00% lower from last week, while the number of traders net-short is 0.41% lower than yesterday and 13.79% higher from last week.
We typically take a contrarian view to crowd sentiment, and the fact traders are net-long suggests AUD/USD prices may continue to fall.
Yet traders are less net-long than yesterday and compared with last week. Recent changes in sentiment warn that the current AUD/USD price trend may soon reverse higher despite the fact traders remain net-long.
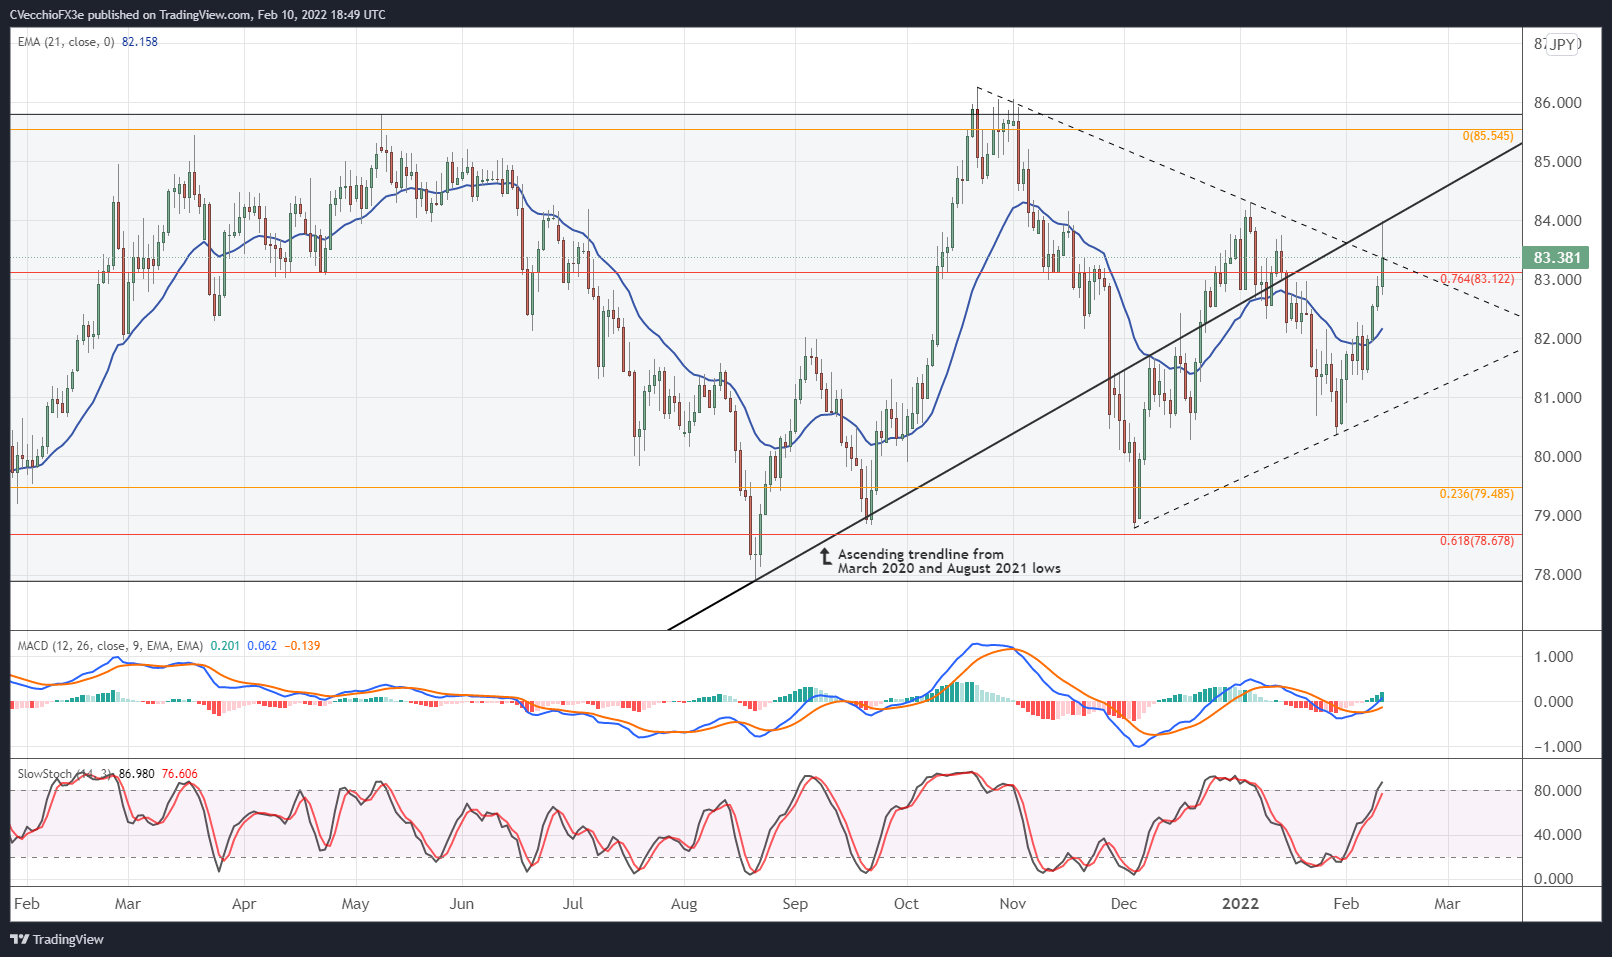
AUD/JPY RATE TECHNICAL ANALYSIS: DAILY CHART (FEBRUARY 2021 TO FEBRUARY 2022) (CHART 3)

AUD/JPY rates remain in the middle of their year-long range, finding resistance at two critical levels today: symmetrical triangle resistance from the October 2021 and January 2022 swing highs; and the ascending trendline from the March 2020 and August 2021 lows. A short-term pullback may transpire before another attempt to break through this confluence of resistance, which when cleared, would signal greater potential for a return to 86.00.
Bullish momentum remains strong, emboldening a ‘buy the dip’ perspective. The pair is above their daily 5-, 8-, 13-, and 21-EMA envelope, which is in bullish sequential order. Daily MACD is beginning to trend higher through its signal line, while daily Slow Stochastics are heading into overbought territory. All things considered, AUD/JPY rates have a more appealing technical setup than AUD/USD rates, should a bullish resolution take place.
IG CLIENT SENTIMENT INDEX: AUD/JPY RATE FORECAST (FEBRUARY 10, 2022) (CHART 4)
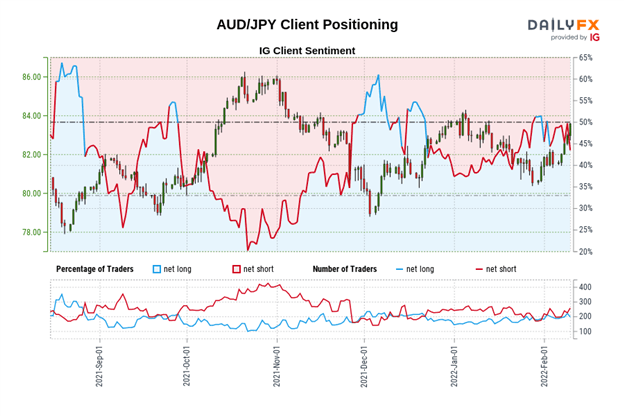
AUD/JPY: Retail trader data shows 39.19% of traders are net-long with the ratio of traders short to long at 1.55 to 1. The number of traders net-long is 16.67% lower than yesterday and 9.84% lower from last week, while the number of traders net-short is 7.56% higher than yesterday and 25.49% higher from last week.
We typically take a contrarian view to crowd sentiment, and the fact traders are net-short suggests AUD/JPY prices may continue to rise.
Traders are further net-short than yesterday and last week, and the combination of current sentiment and recent changes gives us a stronger AUD/JPY-bullish contrarian trading bias.
DailyFX provides forex news and technical analysis on the trends that influence the global currency markets.
Christopher Vecchio, CFA, Senior Strategist
11 February 2022-
 1
1
-
EUR/USD, EUR/GBP and GBP/USD continue to be short-term side-lined ahead of key US CPI data.
EUR/USD recovers from breached resistance line, now support line
EUR/USD’s retracement from its January and early February highs at around $1.1483 did a ‘return to point of breakout’ by slipping back to the breached 2021-to-2022 downtrend line, now because of inverse polarity a support line at $1.1392, before stabilising above it.
Slightly further down the late November and December highs at $1.1386 to $1.1382 may act as additional support as well as the mid-point of Thursday’s long ‘body’ of its candle at $1.1368 ahead of today’s US consumer price index (CPI) data. The ‘body’ shows the distance between the open and the close of a candle.
The January and current February highs at $1.1382 to $1.1383 will need to be exceeded for EUR/USD to continue its ascent towards the next higher October and 5 November lows at $1.1513 to $1.1529.
 Source: IT-Finance.com
EUR/GBP is side-lined
EUR/GBP continues to oscillate around the 55-day simple moving average (SMA) at £0.8425, having found minor support at £0.8413 over the past couple of days.
While this level underpins, resistance above Monday’s high at £0.8478 may be revisited and perhaps also the 2020-to-2022 downtrend line at £0.8486 and even the 200-day SMA at £0.8512.
A slip through the £0.8413 low would probably lead to a tumble back towards the November trough at £0.8381 being seen.
 Source: IT-Finance.com
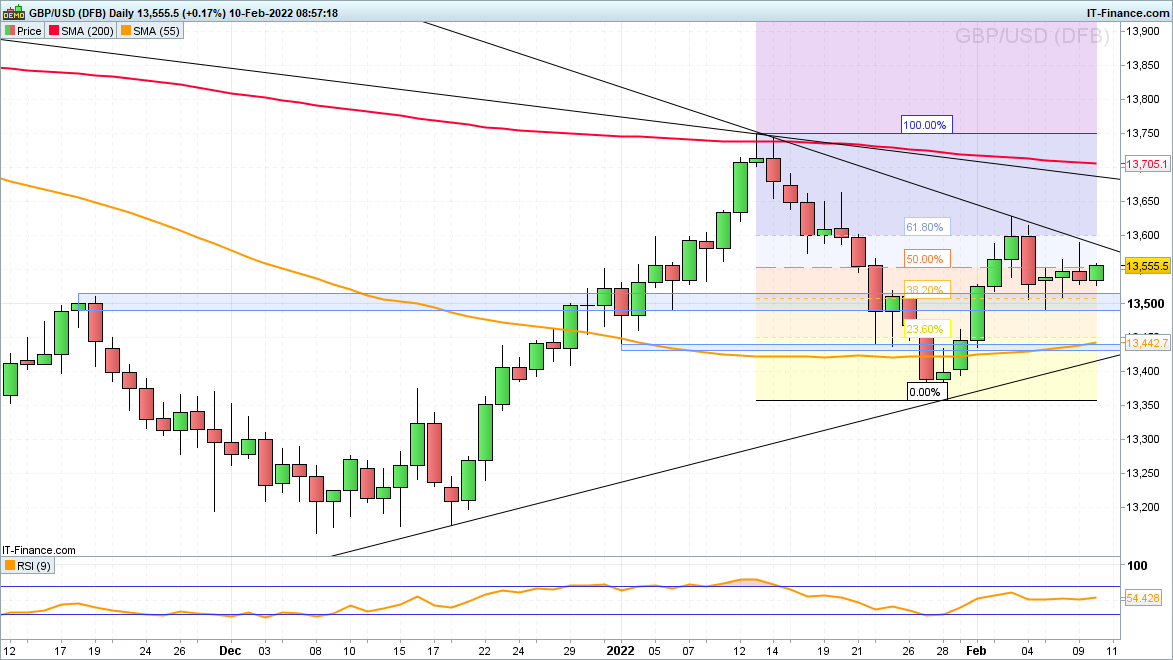
GBP/USD still hovers above minor support ahead of US CPI data
GBP/USD saw a minor retracement from its early February high at $1.3628 to the mid-November high, 38.2% Fibonacci retracement and 6 January low at $1.3513 to $1.349 from where it recovered. Further sideways trading is expected to be seen whilst awaiting US CPI readings later today.
For now, yesterday’s high, two-month downtrend line and 61.8% Fibonacci retracement at $1.3589 to $1.3599 are expected to put a lid on the cross. Slightly above this resistance sits the recent $1.3628 high.
Only a slip through Monday’s $1.349 low would have bearish implications and would push the $1.3442 to $1.3431 support zone to the fore. It consists of the early and late January lows and the 55-day SMA. Further down lies the January trough at $1.3359.
 Source: IT-Finance.com


Help explanation on recent MPLX dividend payment
in Shares and ETFs
Posted
Hi @harpalss,
I believe that the stock is subject to 37% withholding tax hence the dividend received might differ from what was expected. Feel free to reach out to helpdesk.uk@ig.com for further assistance.
All the best - Arvin