

ArvinIG
-
Posts
1,728 -
Joined
-
Last visited
-
Days Won
23
Content Type
Profiles
Forums
Blogs
Events
Community Tutorials
Store
Posts posted by ArvinIG
-
-
WTI crude oil surrenders recent gains, falling more than 25% from last week’s high and oil market’s demand-side expectations take a hit on Chinese cities locking down.
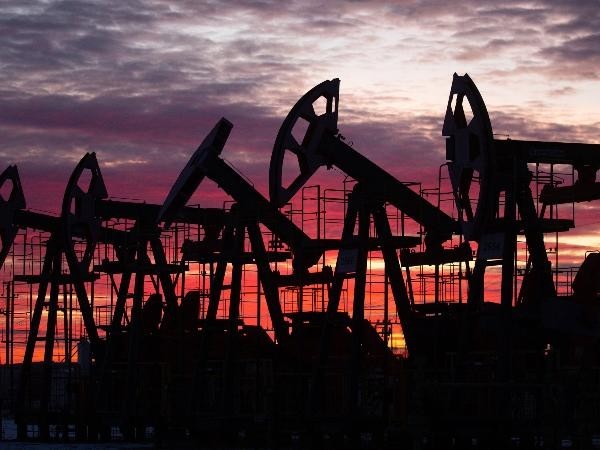
Source: BloombergIt's been quite the month for commodities, and oil is no exception. WTI Crude prices began March at 96.10 a barrel before rising as high as 129.42, which was the highest level traded at since July 2008. Prices have since surrendered those gains, moving back to around 96 a barrel. That marks a drop of more than 25% in just over a week. The surge to that July 2008 high was ignited by Russia’s invasion of Ukraine and the subsequent volley of Western sanctions. Those sanctions remain, and Russia’s assault into Ukraine has only advanced.
The sharp pullback suggests that much of the geopolitical risk premium has evaporated despite the remaining conflict. China’s recent lockdown of its coastal cities, including the manufacturing hub Shenzhen, has also helped to tamp down on prices. China is a major oil importer, and the reduced demand from those lockdowns has helped to ease prices. The potential for further lockdowns in China may also be a factor helping to temper near-term demand expectations.
Meanwhile, US oil production continues to increase. US oil rigs rose to 527 from 519 for the week ending March 11, according to Baker Hughes data. That is the highest level since April 2020, although oil production per rig is down. The decreased production is an unfortunate side effect of shutting down and restarting rigs – it decreases the efficacy. Still, the numbers are encouraging, but it will take time for production to increase to a point where prices would fall much further.
In fact, the US Energy Information Administration (EIA), in its March 2022 Short-Term Energy Outlook (STEO), forecasted WTI prices to average $112 per barrel for the second quarter (April, May, June). That’s around 16% higher than current levels. That said, demand-side issues are likely to drive prices for now while supply slowly but surely increases.
The fundamental upside risks for prices would be if China pulls back from its zero-Covid policy and stops restrictive measures, which would reignite demand prospects from the world’s second-largest economy. Friday will see another weekly US rig count update from Baker Hughes. The recent price surge may have producers attempting to speed up the pace of bringing rigs back online. The weekly percent change in US oil rigs is displayed in the chart below.
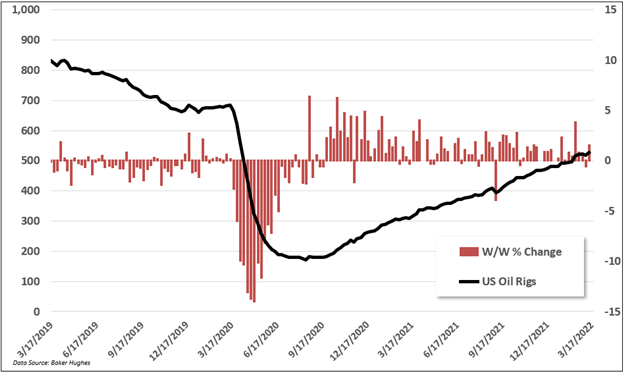
Source: TradingViewFollow Thomas Westwater on Twitter @FxWestwater
This information has been prepared by DailyFX, the partner site of IG offering leading forex news and analysis. This information Advice given in this article is general in nature and is not intended to influence any person’s decisions about investing or financial products.
The material on this page does not contain a record of IG’s trading prices, or an offer of, or solicitation for, a transaction in any financial instrument. IG accepts no responsibility for any use that may be made of these comments and for any consequences that result. No representation or warranty is given as to the accuracy or completeness of this information. Consequently, any person acting on it does so entirely at their own risk.
Thomas Westwater | Analyst, DailyFX, New York City
17 March 2022 -
4 hours ago, Thinker said:
Why is there a 4 point spread on the ASX200 during market hours today?
The VIX is lower than it has been for over 3 weeks so increased volatility can't be the issue?
Also, to increase the spread with no form of notice at all when people have orders in the market with buy, sell, stops & limits is hardly appropriate with no notice!
Hi @Thinker,
Because we price our ASX cash by deriving pricing from ASX futures. Hence, the trading halt in ASX24 did not allow us to price our cash as usual. We had to use Out Of Hours pricing for ASX cash during the halt which resulted in a higher spread.
https://www2.asx.com.au/markets/market-resources/system-status
By scrolling down on the ASX website you will be able to see the technical difficulties they faced today.
All the best - Arvin
-
1 hour ago, MITH said:
why the market time Australia 200 spread high.
Hi @MITH,
Because we price our ASX cash by deriving pricing from ASX futures. Hence, the trading halt in ASX24 did not allow us to price our cash as usual. We had to use Out Of Hours pricing for ASX cash during the halt which resulted in a higher spread.
All the best - Arvin -
20 minutes ago, Pricey520 said:
is there anywhere on the chart that tells you what time the market opens and closes like some other brokers do. I use to find it in info but it has gone now
Hi @Pricey520,
You can find the trading hours on the info tab on the dealing ticket:
You will also find the settlement period, the ticker, and the margin requirements on leverage accounts on the info tab.
I hope that it helps!
All the best - Arvin -
1 hour ago, MITH said:
when the australia 200 issue will solve, How long it ll take.
Hi @MITH,
You can follow the ASX system updates on their website here : https://www2.asx.com.au/markets/market-resources/system-status
ASX resumed recently.
All the best - Arvin -
2 hours ago, jy247 said:
I sold a spread bet on the product "Volatility Index" which as far as I understand is designed to track the VIX. However, when I sold it, the VIX was at 36 and the "Volatility Index" was at 34 so VIX was 2 points higher. Now that VIX has fallen to 26.7, the Volatility Index is at 27.4, so VIX is now almost a full point lower. Note this is not a BID/OFFER issue, which trades about 0.3 wide.
This is also not a 'funding bleed' issue, because the position is costing me money to hold every day, so that cost is not built in.
Does anyone understand the construction of this Volatility Index, and why my trade has underperformed VIX?
Personally I feel quite mislead, as this product is clearly marketed to track VIX.
Grateful for any information.
thanks
Hi @jy247,
The VIX is calculated in real time using the live prices of S&P 500 options – this includes standard CBOE SPX options, which expire on the third Friday of every month, and weekly CBOE SPX options that expire every Friday. You can find more details here.
Please ensure that you are looking at the right price level on the charts by right clicking on the chart and selecting Price:
By default the price is on Mid.
I hope that it helps.
If you need further assistance, please reach out to helpdesk.uk@ig.com.
All the best - Arvin -
1 hour ago, AlexandruD said:
How I can access the trades using a web browser.? I mean MT4 platform CFD.
Hi @AlexandruD,
Unfortunately there is no web browser version of MT4. You will need to install the App or download MT4 on your computer to use your MT4 CFD account.
All the best - Arvin -
15 hours ago, JonJaa said:
Hi Arvin. Thanks very much for your prompt and clear explanation.
Are the historical swap rates perhaps available somewhere, i.e. going back a few years?
Thanks again
Jon
Hi @JonJaa,
After asking IT, unfortunately it seems that it is not possible to access historical swap rates data.
I will raise this point as a feedback to the relevant team to be reviewed.
All the best - Arvin-
 1
1
-
-
On 09/03/2022 at 05:13, pmcguinness07 said:
Dear IG,
Has there been any progress on providing a DRIP feature?
This has been waiting an exceptionally long time, can we please recieve an ETA or a confirmation that the feature will not be provided. The current lack of response is leaving people in a constant state of limbo. This will trigger people to move to alternative providers due to lack of transparency.
Regards
Pearse
On 12/03/2022 at 00:30, Lambchops said:How on earth is this still under review after almost 3 years?!
IG - please either give a proper update with an expected timeline for when this feature will be offered, or be honest and say that nothing is forthcoming.
Thanks
Hi @pmcguinness07 @Lambchops,
Unfortunately at this point in time there is no ETA for DRIP to be available on the platform. As mentioned IG is aware that it is a feature that some clients would like to see but there is no ETA.
All the best - Arvin -
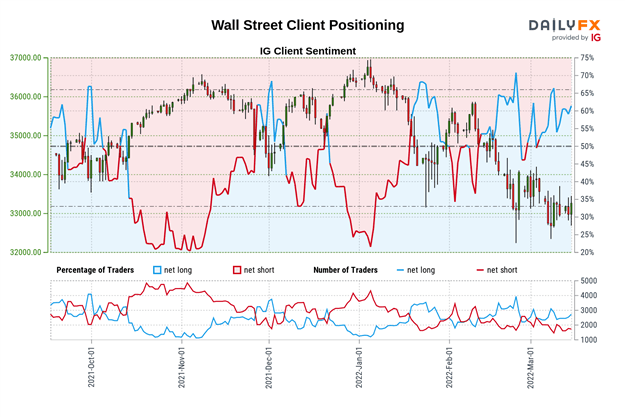
Retail traders are slightly increasing their short exposure on Wall Street; this is before the Fed which could produce market volatility as hikes begin and will S&P 500 and Dow Jones rise if investors increase their bearish views?

Source: BloombergAhead of the Federal Reserve’s interest rate decision, retail traders have been slightly increasing short exposure in Wall Street benchmark stock indices. This can be seen by looking at IG Client Sentiment (IGCS). Short bets in the S&P 500 and Dow Jones have been on the rise in the near term. If this trend in positioning continues, then these indices could have more room to rise ahead.
S&P 500 sentiment outlook - bullish
The IGCS gauge shows that about 58% of retail traders are net-long the S&P 500. Since most traders are still biased to the upside, this suggests prices may continue falling. However, downside exposure has increased by 9.86% and 10.66% compared to yesterday and last week respectively. With that in mind, the combination of current and recent changes in positioning warns that the price trend may soon reverse higher.
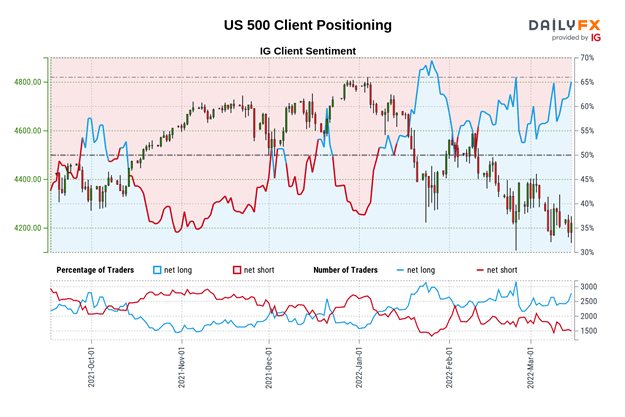
Source: DailyFXS&P 500 futures daily chart
S&P 500 futures are continuing to trade within the boundaries of a Falling Wedge chart formation. While the wedge can be a bullish signal, the near-term trend may remain biased lower if prices continue trading within the boundaries of the formation. Positive RSI divergence is showing that downside momentum is fading, which can at times precede a turn higher. Still, a bearish Death Cross is present between the 50- and 200-day Simple Moving Averages. Downtrend resumption entails clearing the 4126 support point, exposing the May low at 4029. Pushing above the wedge exposes the March 3rd high at 4418.
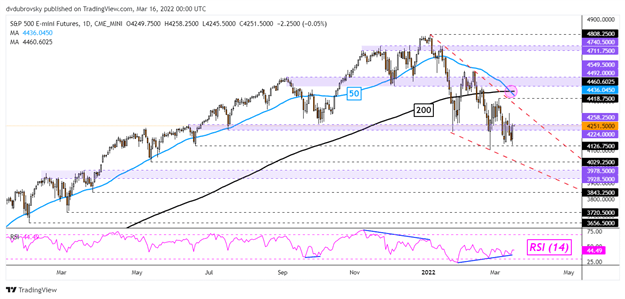
Source: TradingViewDow Jones sentiment outlook - bullish
The IGCS gauge shows that roughly 49% of retail traders are net-long the Dow Jones. Since most traders are now net-short, this hints that prices may continue rising. This is as downside exposure has increased by 30.71% and 18.73% compared yesterday and last week respectively. With that in mind, the combination of current and recent changes in positioning is offering a stronger bullish contrarian trading bias.
Source: DailyFXDow Jones futures daily chart
Dow Jones futures are also trading within the boundaries of a Falling Wedge chart formation. A bearish Death Cross is in play between the 50- and 200-day SMAs as well, offering a downward technical cue. Positive RSI divergence does show that downside momentum is fading. Key resistance seems to be the 34002 inflection point before the wedge ceiling comes into play. Extending the downtrend would expose the 31951 – 32235 support zone, which is made up of late March 2021 lows.
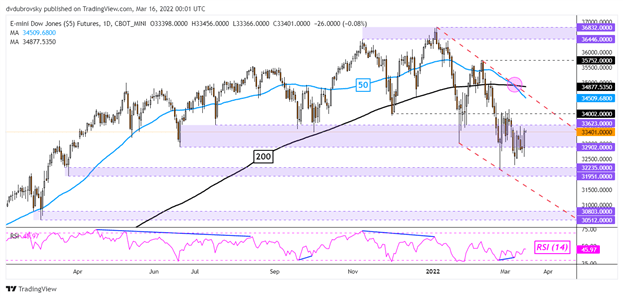
Source: TradingViewFollow Daniel Dubrovsky on Twitter @ddubrovskyFX
This information has been prepared by DailyFX, the partner site of IG offering leading forex news and analysis. This information Advice given in this article is general in nature and is not intended to influence any person’s decisions about investing or financial products.
The material on this page does not contain a record of IG’s trading prices, or an offer of, or solicitation for, a transaction in any financial instrument. IG accepts no responsibility for any use that may be made of these comments and for any consequences that result. No representation or warranty is given as to the accuracy or completeness of this information. Consequently, any person acting on it does so entirely at their own risk.
Daniel Dubrovsky | Currency Analyst, DailyFX, San Francisco
16 March 2022 -
7 hours ago, JonJaa said:
Please confirm/ correct my understanding that follows of the quoted swap bid (swap offer) for CFDs for each forex market: this is the overnight fee in the quote currency if I am long (short) respectively on 1 standard lot of 100,000 units? Also I understand that these figures exclude the IG overnight admin fee? Thanks
Hi @JonJaa,
The daily estimated overnight funding rates for forex (tom-next rate plus our admin fee) and commodities (basis adjustment plus our admin fee) can be viewed in our platform. We call them swap rates.
For short positions we’ll apply the ‘swap bid’ rate, and for long positions we’ll apply the ‘swap offer’ rate.
You can find more details here.
All the best - Arvin-
1
-
-
1 hour ago, TW00100 said:
Is it possible to buy the HKEX 8899.HK shares on IG? as I can only seem to see the NYSE BABA ADR shares listed.
If BABA was to be delisted from the NYSE due to the Foreign Companies Accountable Act, can/will the BABA shares be exchanges for the 8899.HK version on IG? Or will I have to liquidate and buy on a different exchange?
Thanks in advance.
Hi @TW00100,
Alibaba Group Holding Limited (9988.HK) is available to trade on Leverage accounts. If the shares on NYSE happens to be delisted IG won't be able to book the equivalent of 9988 HK as they are on completely different exchanges. You would likely need to sell the NYSE shares and deal on HK.
To deal on HK you will need to use a CFD or Spread bet account, therefore you won't posses the shares.
All the best - Arvin -
On 15/03/2022 at 01:00, Sartois said:
Hi,
Could you add the following please?
Name Of Stock - Carter Bank & Trust
Name of Stock Exchange - NASDAQ
Leverage or share dealing - Share dealing
Ticker - CARE
Market cap - £325.5m
Thanks,
Sartois
On 15/03/2022 at 01:09, Sartois said:Hi again,
Could you add the following please?
Name Of Stock - Perma-Pipe International Holdings
Name of Stock Exchange - NASDAQ
Leverage or share dealing - Share dealing
Ticker - PPIH
Market cap - £57.8m
Thanks,
Sartois
HI @Sartois,
Above stocks were added as requested.
All the best - Arvin -
3 hours ago, harpalss said:
Hi IG,
I'm missing my dividend payment for 3M (ticker: MMM) on my IG share dealing account. I opened a buy position of the stock on the 1st Feb 2022 and the ex-diff date was on the 17th Feb 2022.
I also hold 3M with another broker where the dividend was paid. So I'm rather confused as to why the dividend payment hasn't appeared in my IG account?
Thanks,
Harpal
Hi @harpalss,
The payment date was 12th March US. I believe that it should reflect shortly on your account. As we operate under a custodian model, it can take a bit longer to receive the dividend payments as we are waiting on the custodian to pay the dividends.
If you haven't received your received your dividend by next week feel free to reach out to helpdesk.uk@ig.com to follow up.
All the best - Arvin
-
The Heng Seng index is under the pump this week as China’s recent surge in COVID-19 cases has sent Shanghai and Shenzhen into lockdown.
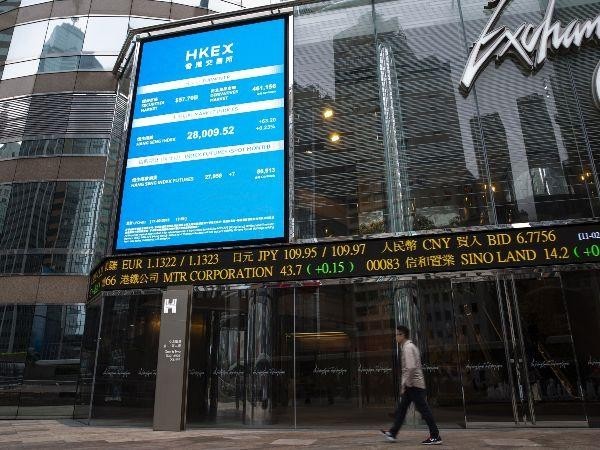
Source: BloombergThe Heng Seng index is under the double whammy this week mounting pressure from global geopolitical tension increases and China’s new Covid wave weighed heavily on investor's sentiment.
The Hang Seng index dived over 2% for the third straight day to breach its six-year-low level since March 2016. Hang Seng Tech marked a new all-time low.
China’s recent surge in COVID-19 cases has sent two of the country’s most developed cities and economic powerhouses, Shanghai and Shenzhen into half-lockdown. The new wave of Covid in China has affected over 50 million people across 27 provinces so far.
Shenzhen, one of the most developed cities with a 17.5 million population, became the largest Chinese city in lockdown since the pandemic started two years ago. As the world’s tech factory and China’s busiest ports, Shenzhen is home to the headquarters of the tech giants Huawei and Tencent and Foxconn, the major supplier for Apple’s iPhone.
The new wave has raised concerns over the beleaguered global supply issues and threatened the country’s economic growth. More importantly, the hope that China would follow the rest of the world to exit their 'zero-case' covid strategy has broken as the top authority has shown great determination in keeping the largest-populated nation virus-free.
Hang Seng index
The Hang Seng index was the 'worst-performer' during the calendar year of 2021, dropping by over 20% while most of the global index enjoyed double-digit growth. Unfortunately, the woe for the Hong Kong listed stocks continues in the New Year: the index has evaporated over 34% from its recent high up to this week, the worst crash since 2008.
The broad-range selloff shows that global investors are escaping from Hong Kong's stock market, which used to be viewed as a golden opportunity to enjoy the Asian dragon’s explosive growth. Apart from signs of economic slowdown, the country’s extreme Covid-19 curbs and the lack of clarity on the end of regulatory crackdowns are the culprits to douse global investors’ enthusiasm.
Hang Seng monthly chart
 Source: TradingView
From a technical standpoint, the falling of Hang Seng was accelerated by the months-long broken trend line and now entered into a steeper descending trajectory.
For the near term, the index has found its support near 19000. The next significant support needs to look back to June 2012, around 18513. The upper boundary of the moving tunnel will limit the high should the index seek for a rebound. At the moment, 19897 will the first target to conquer.
Hang Seng daily chart
 Source: TradingView
Follow Hebe Chen on Twitter @BifeiChen
Hebe Chen | Market Analyst, Australia
15 March 2022 17:19 -
EUR/USD consolidates, EUR/GBP tries to break through resistance and GBP/JPY remains slightly bid ahead of this week’s FED, BoE and BoJ central bank meetings.
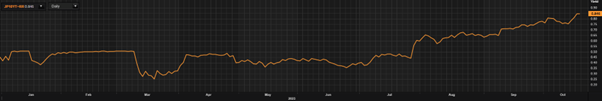
EUR/USD consolidates above its $1.0806 multi-year low ahead of FOMC meeting
EUR/USD keeps holding above Friday and Monday’s $1.0902 low, ahead of this week’s US Federal Reserve (Fed) meeting which is likely to lead to a new cycle of rate hikes with an anticipated 25 basis point (bp) increase in the target Fed funds rate.
Failure at $1.0902 would probably lead to last week’s low at $1.0806 being back in the limelight.While $1.0902 holds, however, a gradual advance back towards the January low and last week’s high at $1.1121 to $1.1122 may ensue. Together with the two-month downtrend line at $1.1149 this area is likely to cap the upside, though. Further up the 55-day simple moving average (SMA) can be spotted at $1.1264.
 Source: IT-Finance.com
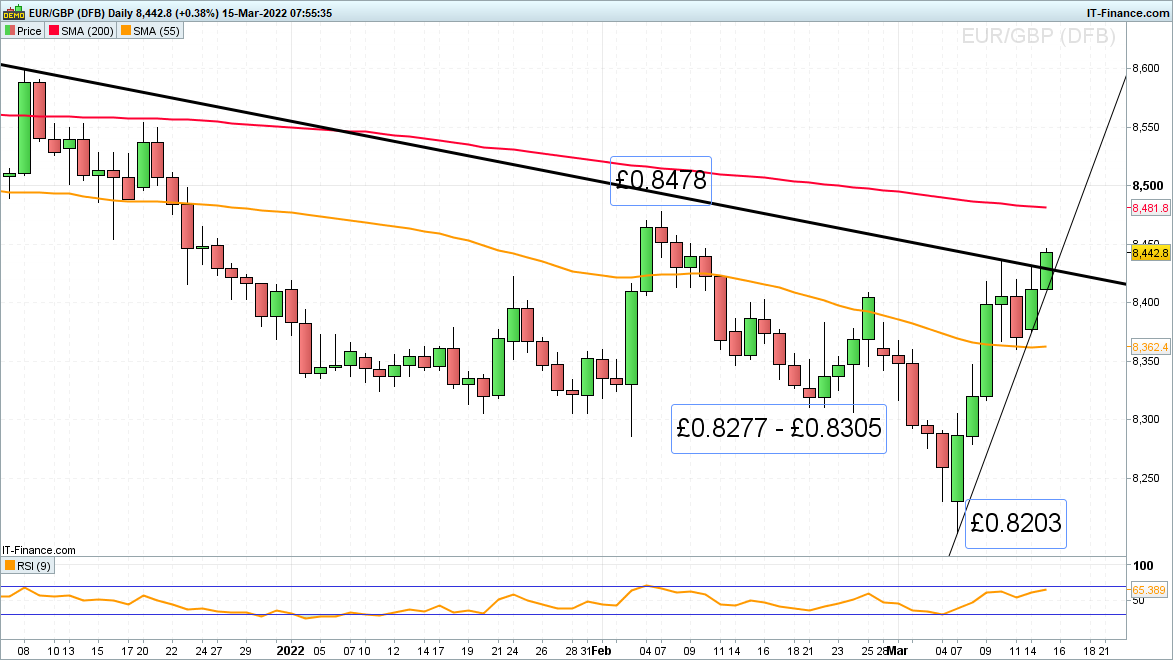
EUR/GBP breaks through four-month downtrend line ahead of BoE rate decision
EUR/GBP has broken through its four-month downtrend line at £0.8428 and risen above last week’s £0.8436 high as investors await the outcome of Wednesday’s Bank of England (BoE) rate decision. The market has priced in a third rate hike in a row, taking the base rate to 0.75%.
The February peak at £0.8478 is now in focus, together with the 200-day SMA at £0.8482.
Potential slips should see support at the late February £0.8408 high and also along the 55-day SMA at £0.8362.
 Source: IT-Finance.com
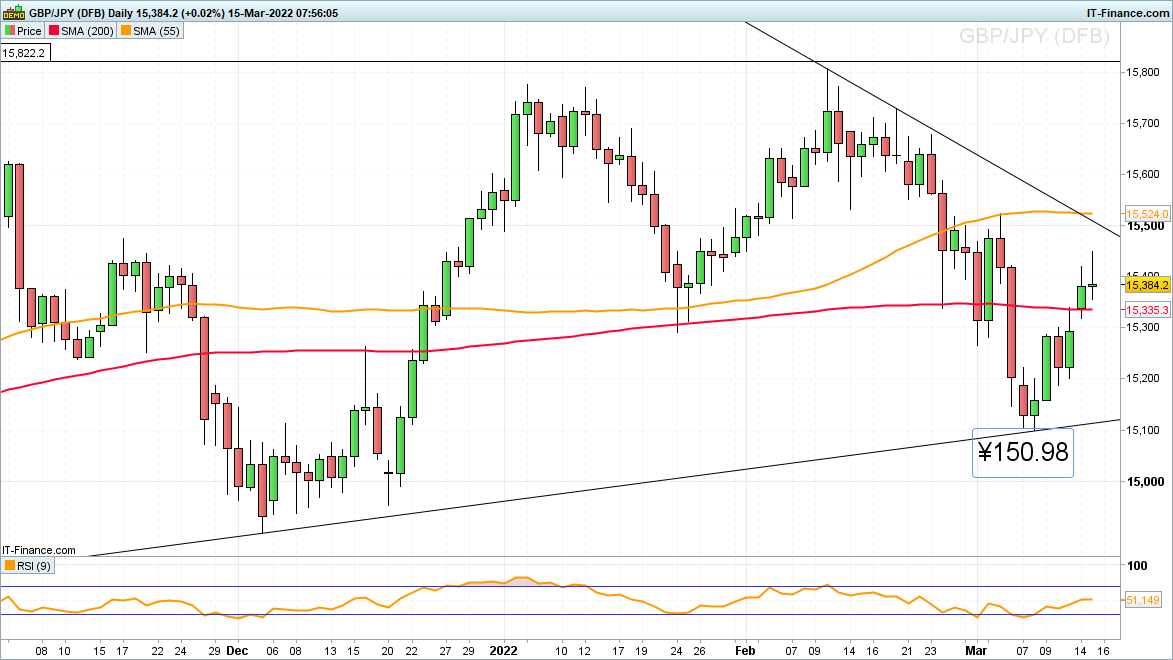
GBP/JPY is heading back up while awaiting BoE and BoJ meetings
GBP/JPY is likely to continue its recovery from the ¥150.98 early March low and targets the one-month downtrend line, early March high and the 55-day SMA at ¥155.08 to ¥155.23 since the BoE is expected to raise rates by another 25 bp while the Bank of Japan (BoJ) is to remain dovish with no change expected.
Minor support is found along the 200-day SMA at ¥153.35 and also between the January and early March lows at ¥152.91 to ¥152.67.
Key support remains to be seen at the current March low at ¥150.98, a slip through which would put the December trough at ¥148.98 back on the map.
 Source: IT-Finance.com
Axel Rudolph | Market Analyst, London
15 March 2022 -
8 hours ago, PythonTrade86 said:
@ArvinIG Yes they are, thank you.
I really found it unfair that IG behaves this way. That is not in the client's interest, to my opinion.
Hi @PythonTrade86,
I believe that the dealing desk didn't add the September options as they are further away, only the closest expiry would be available. But on demand they can make them accessible.
I hope that it helps. If you have any options that are further away that you would like to trade please reach out to IG for them to be available to trade on the platform.
All the best - Arvin -
9 hours ago, PythonTrade86 said:
Hello,
As you can see on this screenshot, SPX options are tradable, apart from the september expiry...
Why is this expiry not available to trade?
I am frustrated that IG decides which expiries we can trade and which we can't. It also happened last week. I would like an explanation, please.
Thank you

Hi @PythonTrade86,
It seems that the dealing desk made the September Options available. Could you please advise if they are available on your side?
Thank you - Arvin
-
On 12/03/2022 at 04:26, Alex111 said:
Hi @Alex111,
As mentioned above we do not have information on the withdrawal process. The payment and compliance team are processing the withdrawal request. It seems that yours request is being processed. It is an exceptional situation therefore the team is doing their best to process the withdrawals as soon as possible.
If you have further question please reply to the email you received regarding this matter.
Thank you for your patience - Arvin-
1
-
-
4 hours ago, als1963 said:
The order has gone from the pending/working order on the IG platform but not off the PRT charts.


Hi @als1963,
Please send your screenshots to helpdesk.uk@ig.com our IT team will be able to investigate and come back to you accordingly.
All the best - Arvin-
1
-
-
2 hours ago, BDS said:
If I order a spread bet overnight, and order level of (for example) plus 20, but the share in question opens at +5, is IG compelled to buy it for me at +5, or can they sell it to me at a higher price, say +15 and thus make some margin of their own?
Hi @BDS,
IG can only book deals at market price. The dealing desk can't place a deal at for example 110 while the current price is 100 and use the 10 points as profit. The only revenue is made on commissions.
If you place an limit or stop order for your order to be triggered at specific levels.
More information here : https://www.ig.com/uk/help-and-support/spread-betting-and-cfds/orders--stops-and-limits/what-is-the-difference-between-a-stop-and-limit-order
All the best - Arvin -
On 12/03/2022 at 05:04, NoForkInClue said:
My payments keep getting declined, IG states bank has refused as details do not match. Contacted bank who said IG need to update their payment protocols (online consumer safety and security). Anyone else have the same issue?
Hi @NoForkInClue,
Do you usually receive a text or email with a code you need to enter to confirm the bank transaction?
Have you change mobile or email address recently?
It seems that the system is unable to complete the 3DS secure process.
Thank you - Arvin -
The NASDAQ Composite index fell 2% today as US CPI inflation hit 7.9%, its highest since 1982. With interest rates expected to rise next week, a further correction could be on the cards.

Source: Bloomberg2022 has not been kind to the NASDAQ Composite. After climbing from a covid-19 pandemic low of 6,880 points on 20 March 2020 to an intraday record of 16,212 points on 22 November 2021, it had dipped to 15,833 points by the start of this year.
And it's now fallen another 20.5% to 12,581 points today. And along the way, it’s displayed nerve-wracking volatility.
As US inflation rises, all eyes now turn to the US Federal Reserve. The higher rates go, the more the ability of the NASDAQ’s tech-heavy stocks to grow on cheap debt becomes constricted.
Nasdaq Composite: record inflation
Like the UK’s Bank of England, the US Federal Reserve is tasked with keeping the Consumer Prices Index inflation rate at 2%. After decades of economic wrangling, this figure appears to be the best middle ground between encouraging spending while maintaining currency value.
But according to the Labor Department, the US annual inflation rate in February hit 7.9%, its highest since 1982. For context, this was the year that Argentina chose to invade the Falklands.
Rising costs for energy, food and shelter drove the gains; and politically, this is dangerous for President Joe Biden, who is facing mid-term elections in November. These sectors are unavoidable rises, that disproportionately hit poorer Americans with less disposable income.
The Federal Reserve is widely expected to increase interest rates as a result. Chair Jerome Powell is on the record saying he is ‘inclined to propose and support a 25-basis-point rate hike’ this month, and further that he is ‘prepared to move more aggressively’ if inflation remains stubbornly high.
However, commenting on the crisis in Ukraine, Powell said the economic outlook is now ‘highly uncertain’ meaning the Reserve had to ‘proceed carefully as we learn more about the implications of the Ukraine war on the economy.’
And far from the complacency of ‘transitory’ inflation, Powell believes that even though there is ‘an expectation that inflation will peak and begin to come down this year,’ that ‘persistently high’ inflation would mean ‘raising the federal funds rate by more than 25 basis points at a meeting or meetings.’
Oil prices are a particularly sore point for Americans right now. Over the past 12 months, gasoline has increased by 38% and natural gas by 23.8%. As the Biden administration has now placed an embargo on Russian oil, which previously constituted 8% of its imported oil, further increases seem inevitable.
And Kpler analyst Matt Smith warns ‘crude is used as an input to produce all manner of products,’ and will continue to drive inflation further. For example, grocery prices are up 8.6% year-on-year, the largest annual leap since 1981.
Nasdaq Composite: rising rates
Moreover, the Ukrainian crisis is likely to send US inflation soaring further. Commodities ranging from Wheat to Gold, Palladium, Aluminium, and Nickel are all at or close to multi-year highs, as a combination of sanctions and blockades restrict exports from the war-torn region.
AllianceBernstein's Eric Winograd says ‘the numbers are eye-watering and there is more to come…the peak in inflation will be much higher than previously thought and will arrive later than previously expected.’ Meanwhile, Wells Fargo's Sarah House believes ‘inflation continues on at a blazing pace…consumers and policymakers remain in a deeply uncomfortable state as a result.’
And Paul Ashworth, chief US economist at Capital Economics, argues ‘given the spike in crude oil and gasoline prices since Russia’s invasion of Ukraine, (inflation) will climb well above 8% in March.’
Wells Fargo’s Director of rates strategy, Michael Schumacher, says ‘25 basis points next week seems just about a lock…Fed’s in a tough spot. It’s getting tougher by the day. It’s hard any time, but especially when you’ve got incredible inflation, and we’ve had the supply chain issues for a while, and now they’ve been exacerbated by Russia-Ukraine.’
Barclays Chief Economist Michael Gapen believes the US will see five rate hikes this year, as ‘we certainly have stagflation influences.’ Meanwhile, Daniele Antonucci, Chief Economist at Quintet, said ‘significant pressure on the Fed to hike by 25 bps at its March meeting…to reach 2-2.5% in the US over the next two years.’
As interest rates rise, the Nasdaq Composite seems set for further volatility. And with many sources of US inflation outside of internal control, the Federal Reserve could run out of easy choices.
Trade what you want, when you want with the UK’s No.1 trading provider.* We have over 80 top global indices with more trading hours than anyone else. Find out more about indices trading or open an account to trade now.
*Based on revenue excluding FX (published financial statements, June 2020).
Charles Archer | Financial Writer, London
15 March 2022 -
On 11/03/2022 at 05:11, DarkMatter731 said:
Name of stock: KFA Mount Lucas Index Strategy ETF
Name of Stock Exchange: NYSE
Leverage or Share dealing: Share dealing (would also like the option to leverage)
Ticker: KMLM
Country of the stock: United States
Market Cap: $44,697,048
On 11/03/2022 at 05:14, DarkMatter731 said:Name of stock: The Core Alternative ETF
Name of Stock Exchange: NYSE
Leverage or Share dealing: Leverage
Ticker: CCOR
Country of the stock: United States
Market Cap: 285,931,600.03
Hi @DarkMatter731,
Both ETF were added on share dealing accounts by the dealing desk.
All the best - Arvin


AUD/USD, AUD/JPY climb as risk-on flows bolster Asian equities
in Foreign Exchange (FX)
Posted
Australian dollar rises amid heavy equity buying across US and Asian stock markets and oil prices climb after China signals it may start to reduce its aggressive Covid strategy.
Friday’s Asia-Pacific outlook
Asia-Pacific traders will look to close the week out on a high note today after Wall Street traders pushed US indexes higher for the third day. The benchmark S&P 500 index gained 1.23%. Asian equity markets also have the advantage of upward momentum. Hong Kong’s Hang Seng Index (HSI) closed over 7% higher on Thursday. The resumption of negotiations between Ukraine and Russia has lifted market sentiment, but fighting in Ukraine has only intensified, according to reports on the ground.
Commodity markets remain highly volatile despite the bullish activity in equity markets. WTI crude oil rose back above 100 per barrel overnight. Brent crude – the global benchmark – rose as well. Oil was on the move amid a new wave of Covid-induced lockdowns. However, Chinese President Xi asked policymakers to reduce the impact of Covid on the Chinese economy on Thursday, according to Xinhua News.
The foreign exchange market has seen heavy risk-on flows. AUD/JPY – a common FX risk gauge – rose to its highest level since early February 2018. Meanwhile, the safe-haven US dollar fell for a third day via the DXY index, with euro strength accounting for much of that drop. Gold was also advantaged from the weaker USD, which pushed spot prices over half a percent higher.
The dollar did gain against the Russian ruble, with USD/RUB rising nearly 7%. S&P cut Russia’s credit rating to CC from CCC-. The credit rating agency warned that another cut is possible. The Bank of Japan (BoJ) will provide today’s main event to close out the week. Analysts expect the central bank to hold steady on providing massive monetary support.
Australian dollar technical forecast
AUD/USD is trading just below the 0.7400 level after a third daily gain. A push above that level would open the door for a test of the March high at 0.7441. MACD is tracking back above its signal line, and the 20-day Simple Moving Average (SMA) is nearing a cross above its 200-day SMA. If prices pullback, the 23.6% Fibonacci retracement may offer a degree of support.
AUD/USD daily chart
Source: TradingView
Follow Thomas Westwater on Twitter @FxWestwater
This information has been prepared by DailyFX, the partner site of IG offering leading forex news and analysis. This information Advice given in this article is general in nature and is not intended to influence any person’s decisions about investing or financial products.
The material on this page does not contain a record of IG’s trading prices, or an offer of, or solicitation for, a transaction in any financial instrument. IG accepts no responsibility for any use that may be made of these comments and for any consequences that result. No representation or warranty is given as to the accuracy or completeness of this information. Consequently, any person acting on it does so entirely at their own risk.
Thomas Westwater | Analyst, DailyFX, New York City
18 March 2022