

ArvinIG
-
Posts
1,728 -
Joined
-
Last visited
-
Days Won
23
Content Type
Profiles
Forums
Blogs
Events
Community Tutorials
Store
Posts posted by ArvinIG
-
-
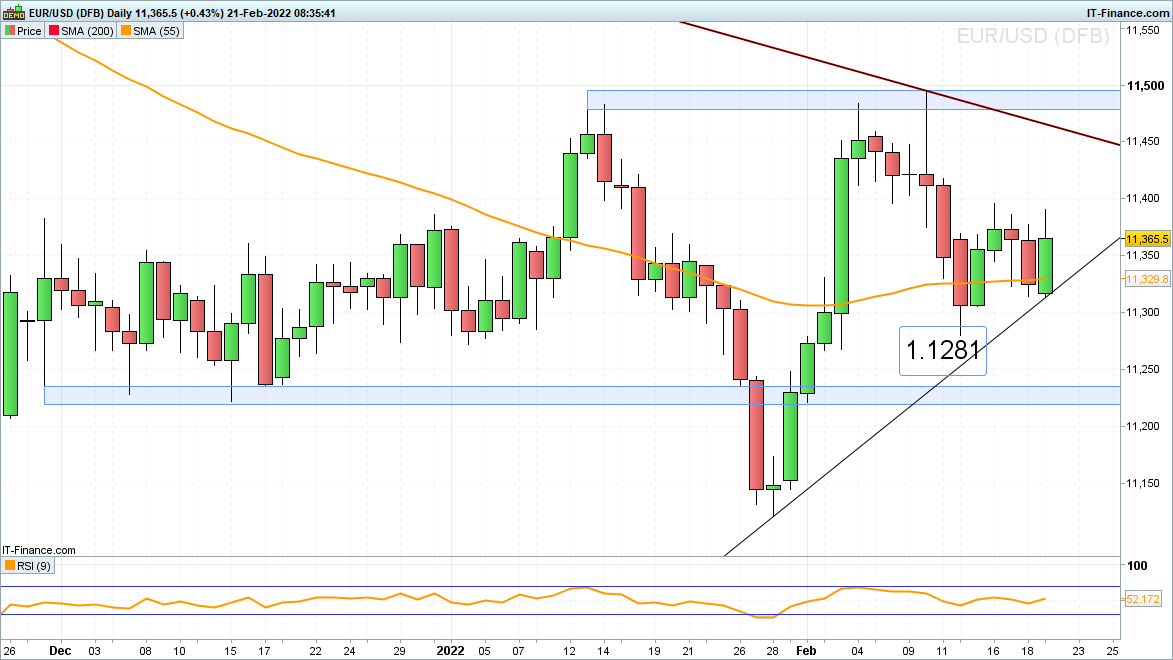
EUR/USD advances on waning war jitters while EUR/GBP slips and GBP/USD rises on Boris Johnson's announcement to remove all Covid-19 restrictions.
EUR/USD rises on hopes of Biden-Putin summit
EUR/USD is seen heading back up again after the US President Biden and the Russian President Putin agreed in principle to meet to discuss the Ukrainian crisis.
On the back of this news EUR/USD bounced off the 55-day simple moving average (SMA) and one-month support line at $1.133 to $1.1314 and is advancing towards the late November, December and last week’s highs at $1.1382 to $1.1396. This area will need to be exceeded, for the January and current February highs at $1.1482 to $1.1495 to be back in the frame.
Only a slide through minor support at today’s $1.1314 low could lead to last week’s low at $1.1281 and the early January low at $1.1272 being revisited.
 Source: IT-Finance.com
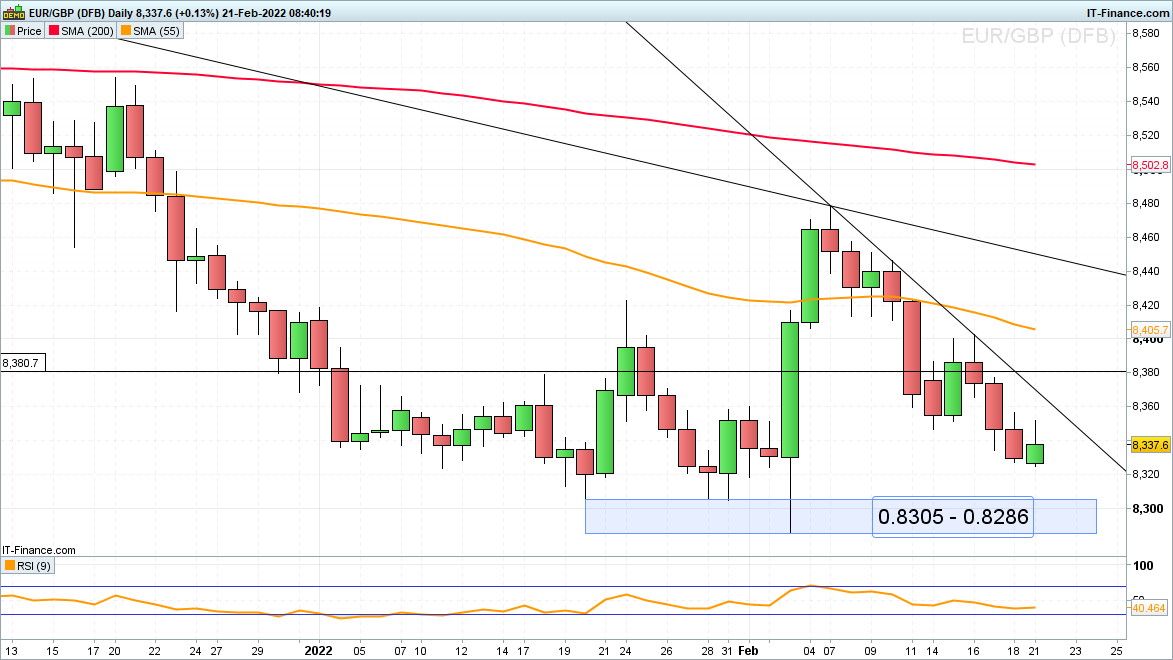
The gradual EUR/GBP slide is ongoing
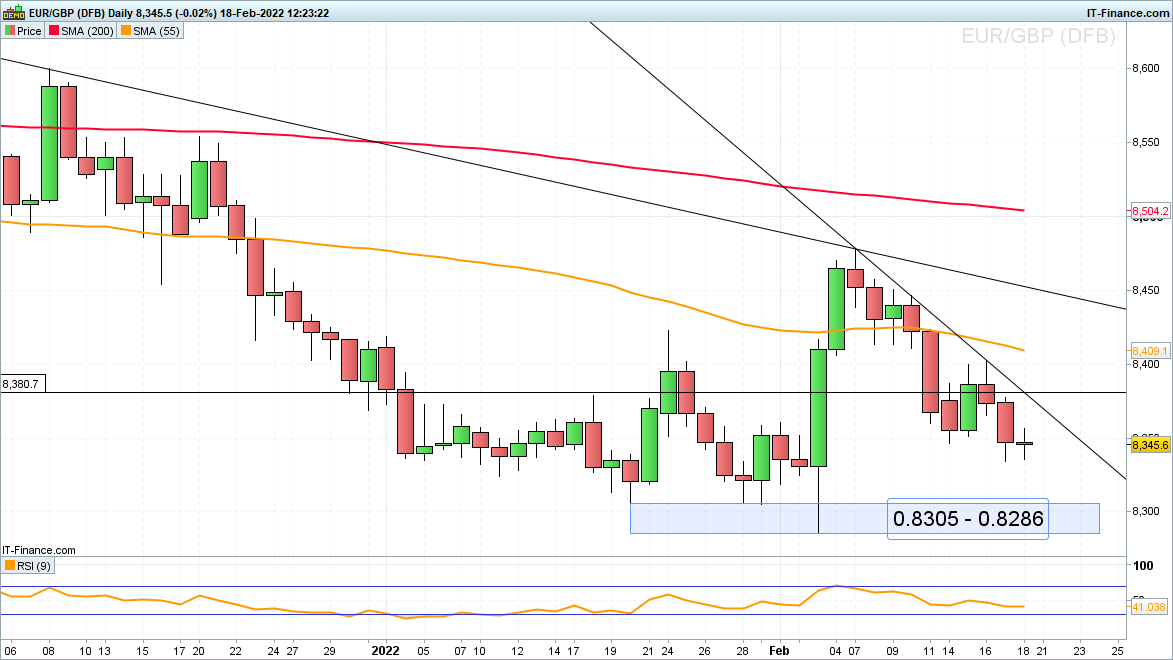
EUR/GBP continues to give back most of its early February swift advance in view of recent sterling strength, benefitting from a Covid-19 post-Omicron growth rebound and expectations for further Bank of England (BoE) interest rate hikes.
The mid-January trough at £0.8324 is currently being tested, below which beckons major support which remains to be seen between the January and early February lows at £0.8305 to £0.8286.
Minor resistance above the one-month resistance line at £0.8369 can be spotted at the £0.8381 November low and also at last week’s £0.8402 high and 55-day SMA at £0.8406.
 Source: IT-Finance.com
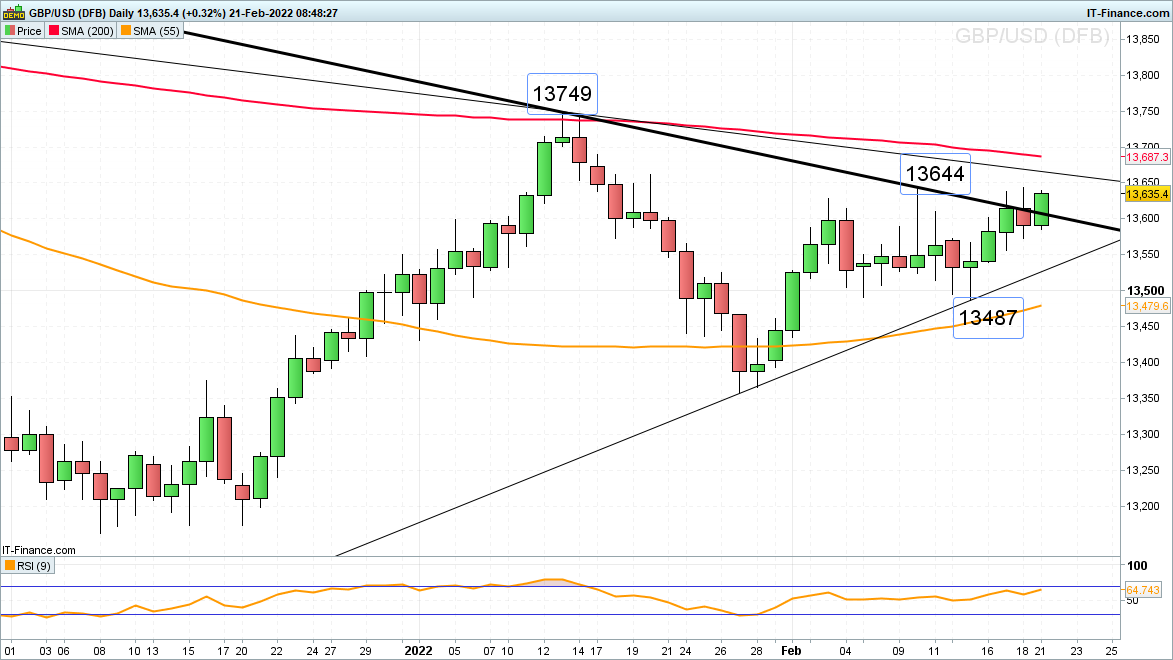
GBP/USD trades near four-week highs
Last week’s strong GBP/USD bounce off the $1.3513 to $1.349 mid-November high, 6 January and 7 February lows, has taken it to a one-month high close to the current February high at $1.3644. This is on the back of the pound sterling strengthening amid expectations for further BoE interest rate hikes and the removal of all remaining Covid-19 restrictions in England, fully opening up the economy.
The 200-day SMA at $1.3687 represents the first technical upside target, followed by the January peak at $1.3749.
Only a currently unexpected fall through last week’s $1.3487 low, would put the $1.348 to $1.3431 support zone back into the picture. It is comprised of the early as well as the 25 and 26 January lows and the 55-day SMA. Further down lies the January trough at $1.3359.
 Source: IT-Finance.com
-
13 minutes ago, Wakaba said:
Registered for an account 2 weeks ago. Uploaded the documents requested. My profile says the ID is approved and bank details verified. However, my account is still not active. Please help.
Hi @Wakaba,
To follow up on your application, please reach out to sales.en@ig.com with your details.
All the best - Arvin -
5 hours ago, bennythebullish said:
Did you work it out?
Hi @bennythebullish,
Unfortunately you won't be able to see this data on the IG platform. it does not reflect either on L2 Data feed.
I will forward your comments to the feedback team to be reviewed.
All the best - Arvin -
On 19/02/2022 at 03:10, Jgreen55 said:
Could you add the following please?
Name Of Stock - Abaxx Technologies Inc.
Name of Stock Exchange - NEO
Leverage or share dealing - Share dealing
Ticker - ABXX
Market cap - 162mn
Hi @Jgreen55,
Unfortunately, if the stock trades on OTC then we are unable to offer, we do not deal in OTC stocks.
All the best - Arvin -
On 15/02/2022 at 01:24, Sartois said:
Hi,
Could I request the following stock be added to the roster?
Name Of Stock - LCNB Corp
Name of Stock Exchange - NASDAQ
Leverage or share dealing - Share dealing
Ticker - LCNB
Market cap - £184.6
Thanks,
Sartois
Hi @Sartois,
LCNB is now online.
All the best - Arvin -
On 03/03/2021 at 01:20, sybessonne said:
Hello,
I'm a developer. I would like to launch trades automatically with the IG API.
But I'm currently suspended. I can't create a session with the API. I think this is because I use it too much maybe.
I have the message :
"errorCode": "error.security.client-suspended"
Could you explain me how to remove the restriction to be allowed to reuse the API ?
Cordially
Hi @sybessonne,
It seems that your Demo account is locked (possibly password) once locked it will be suspended. Please reach out to helpdesk.uk@ig.com or use our live chat feature to contact our helpdesk with your account details to unlock your account.
All the best - Arvin -
On 19/02/2022 at 23:24, amukunthan said:
Hello,
I'm a developer who has recently opened an IG account.
I can't create a session with the API. My demo account says its currently suspended.
I have the message :
"errorCode": "error.security.client-suspended"
Same error with the companion APP.
Please help
Hi @amukunthan,
It seems that your Demo account is locked (possibly password) once locked it will be suspended. Please reach out to helpdesk.uk@ig.com or use our live chat feature to contact our helpdesk with your account details to unlock your account.
All the best - Arvin -
On 19/02/2022 at 15:37, DrAWesM said:
I have 4 open contracts in a crypto currency. The market trades 24/7. However, IG is closed today for trading. Is there a way that I can still close deals?
Hi @DrAWesM,
You should be able to trade Cryptos during the weekend . We are normally open 24 hours a day, from 5pm Saturday to 7am Saturday (AEST). On Saturday mornings the IG platform performs a backup and maintenance.
During this time it might not be available. Alternatively you can call in to reach a dealer on the weekend as IG have staff covering the weekends. If you need further assistance, please reach out to helpdesk.au@ig.com.
All the best - Arvin -
A stronger British pound due to anticipated further BoE interest rate hikes pushes EUR/GBP lower and GBP/USD higher while EUR/USD remains mixed in low volatility trading.
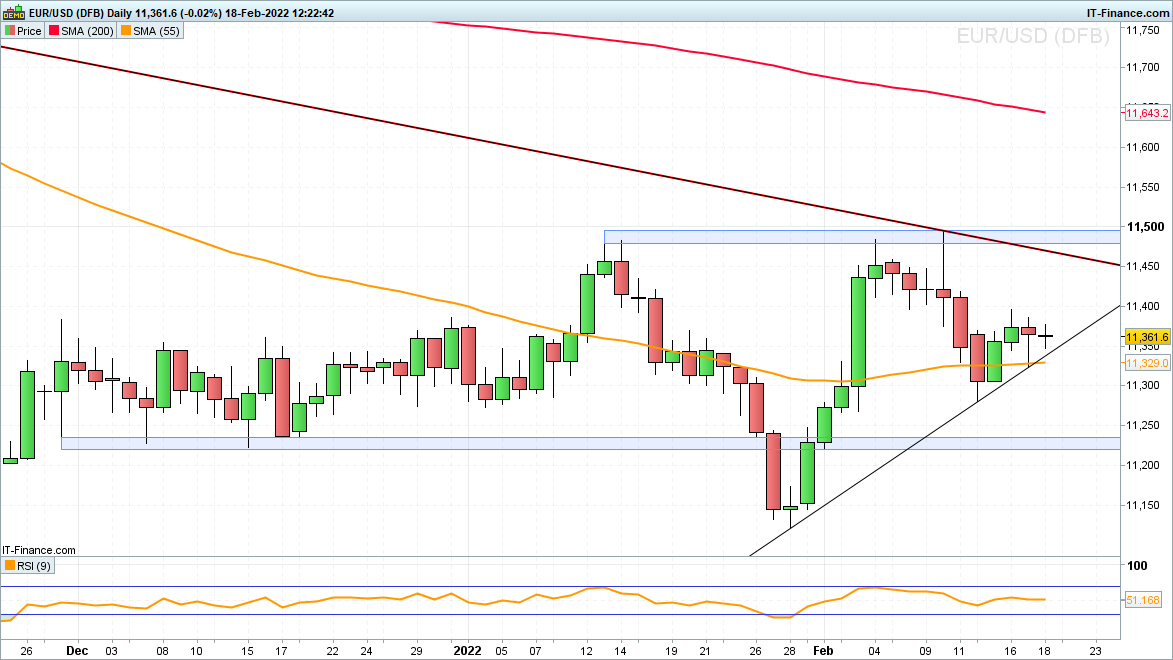
EUR/USD side-lined ahead of next week’s Russia-US meeting
Volatility has been decreasing in the EUR/USD cross over the past couple of days as traders are getting used to the Russia-Ukraine stalemate.
Yesterday EUR/USD bounced off the 55-day simple moving average (SMA) and one-month support line at $1.1338 to $1.1323 and today it is so far trading within a tiny 30 tick range. Minor resistance continues to be seen between late November, December, and this week’s highs at $1.1382 to $1.1396. It will need to be exceeded for the January and current February highs at $1.1482 to $1.1495 to be back in the picture.
Only slide-through support at $1.1323 could lead to this week’s low at $1.1281 and the early January low at $1.1272 being retested.
 Source: IT-Finance.com
The gradual EUR/GBP slide continues
EUR/GBP continues to give back its early February swift gains on the back of recent sterling strength, benefitting from a Covid-19 post-Omicron growth rebound and expectations for further Bank of England (BoE) interest rate hikes.
Were Thursday’s low at £0.8334 to give way, the mid-January trough at £0.8324 would be targeted. Major support remains to be seen between the January and early February lows at £0.8305 to £0.8286.
Minor resistance above the £0.8381 November low and this week’s high at £0.8402 can be found along the 55-day SMA at £0.8409.
 Source: IT-Finance.com
GBP/USD trades near four-week highs
GBP/USD’s strong bounce off the $1.3513 to $1.349 mid-November high, 6 January and 7 February lows, as the pound sterling strengthened amid expectations for further BoE interest rate hikes, has taken it to a one-month high close to last week’s high at $1.3644.
Next up are the 200-day SMA at $1.369 and the January peak at $1.3749.
Only a currently unexpected fall through this week’s $1.3487 low, would push the $1.3455 to $1.3431 support zone back to the fore. It is comprised of the early as well as the 25 and 26 January lows and the 55-day SMA. Further down lies the January trough at $1.3359.
-
On 19/02/2022 at 23:35, Jif said:
Found this after a further search, assuming same issue.
Hi @Jif,
Thank you for you message. Could you please confirm that the Volume issue is happening on a share dealing account only for US stock (which one)?
An incident report has been raised on the matter, I will add your feedback to the incident.
All the best - Arvin -
5 hours ago, AlmostRich said:
Is it true that for retail client the minimum trade size for EUR/USD pair is 0.1 (10 000) or mini lot if web trading platform is used and 0.01 (1 000) or micro lot if MT4 platform is used?
Hi @AlmostRich,
IG offers two types of lots for retail clients for EUR/USD, standard 100 000 and Mini 10 000.
All the best - Arvin -
17 hours ago, Jpn said:
Still issues with charts. Unable to see the charts. Data missing
Hi @Jpn,
The charts seems to be working on the web based platform :
Could you please clarify what type of issue you are facing?
Thank you - Arvin -
12 hours ago, jaykay said:
I have requested a withdrawal and IG requires a bank statement. I consider this a invasion of privacy - my bank statement is a private matter between my bank and myself.
Is this normal ?
Hi @jaykay,
If you are withdrawing with a different method that you deposited your funds with, you may be asked to verify your deposit made to IG. You can upload that document on My IG > Live accounts > Verification.
IG follows a Anti-Money Laundering policy If you are withdrawing your funds through the same method and up to the same amount you deposited you won't need to verify your card or bank account.
If you are depositing funds from one card and withdrawing to another, or depositing from a card and withdrawing by bank transfer for example, you will be asked to verify your card and/or bank account.
I hope that it helps.
All the best - Arvin -
11 hours ago, dan0809 said:
Hi. I just was charged 7pts for devidends for selling FTSE and closig on profit. It took 1/3 of my profit. Is this normal with IG?
Hi @dan0809,
If you were going short the dividend adjustment would have resulted in your account being debited.
Let’s say you’re short two standard lots of Wall Street Cash at 9pm when there is a dividend adjustment of 2.9 points. Our Wall Street Cash price drops by 2.9 points, so your running P&L is increased by 2.9 x 2 x $10 = $58. We therefore debit your ledger with $58, to negate this rise in P&L.
You can find more details here.
I hope that it helps.
All the best - Arvin -
9 hours ago, Kodiak said:
What is this?
Last dealing date 23/02/22 07:50? UK time?

Hi @Kodiak,
Thank you for your message. I have raised the issue to the dealing desk it should be fixed by now. The expiry is by cash closing 20.59 UK time.
All the best - Arvin
-
S&P 500 OUTLOOK:
- Geopolitical tensions fuels volatility and weigh on risk assets
- The S&P 500 drops more than 2% on fears Russia could launch an offensive and invade Ukraine any moment
- Technical analysis suggests the S&P 500 could head lower in the coming days
Most read: Dow, S&P 500, Nasdaq Price Forecasts - Bears Brewing as Risk Rise
Volatility has been extreme on Wall Street this year. The Federal Reserve’s transition to a tighter monetary policy stance in response to soaring inflation has weighed on sentiment, prompting investors to de-risk their portfolios and shun bets on growth and tech plays amid rising Treasury rates.
The simmering conflict in Eastern Europe has made matters worse, contributing to market anxiety and leading stocks to swing wildly with no clear direction. The current price dynamics highlight a key fact: geopolitical tensions are very difficult to trade, especially if the situation is fluid and ambiguous. Against this backdrop, the S&P 500's performance has been mixed this week, down 2.12% to 4,380 on Thursday on risk-off mood and flight to safety, after climbing roughly 1.7% in the previous two sessions.
With the Russia-Ukraine standoff heating up by the hour, volatility will remain elevated and unpredictable, leaving markets at the mercy of the headlines that cross the wires. At this point, it is difficult to say how the crisis will unfold, but the United States and its allies seem convinced that President Putin may launch an offensive and give the order to invade Ukraine soon, perhaps in the "next several days."
Although The Kremlin denies weighing on attack, satellite imagery and intelligence point to a continued buildup of Russian military forces in several locations near the Ukrainian border, a sign that an incursion is possible. To avoid being caught in losing positions, traders may want to wait out and limit directional speculation, at least until there’s concrete evidence diplomacy has created a détente or war has broken out. In any case, we should have more information in the coming days and weeks, but two possible scenarios are highlighted below:
- Russia invades Ukraine – A sharp downward reaction in stocks is likely, although energy stocks could hold up on the expectation that economic sanctions on Moscow could lead to a disruption in energy supplies and thus higher oil and natural gas prices. All in all, any pullback in the broader market may be transitory, as the crisis should not have a material impact on the global economy.
- Democracy prevails, Russia decides to continue dialogue - We could see a relief rally, oil prices could drop significantly as the geopolitical risk premium decreases. As frictions ease, monetary policy should come back into focus, with the Fed meeting in March closely watched.
S&P 500 TECHNICAL ANALYSIS
On Monday I talked about a double top formation in the S&P 500. The bearish pattern has been confirmed, suggesting that the index’s balance of risks is skewed to the downside, a situation that may pave the way for a move towards the 4,300 psychological level in the coming days.
However, if dip buyers resurface and prices reverse higher, the first resistance to consider appears near the 200-day SMA and then at 4,490, this week’s high. If the S&P 500 manages to clear these hurdles, bulls may find momentum to drive the index towards 4,520, the 50% Fibonacci retracement of the January selloff.
S&P 500 TECHNICAL CHART
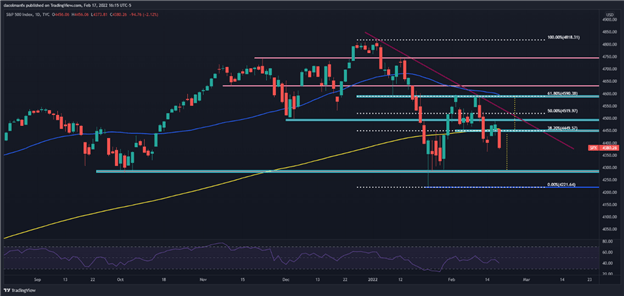
S&P 500 (SPX) Chart by TradingView
EDUCATION TOOLS FOR TRADERS
- Are you just getting started? Download the beginners’ guide for FX traders
- Would you like to know more about your trading personality? Take the DailyFX quiz and find out
- IG's client positioning data provides valuable information on market sentiment. Get your free guide on how to use this powerful trading indicator here.
DailyFX provides forex news and technical analysis on the trends that influence the global currency markets.
Diego Colman, Market Analyst, DailyFX
18 February 2022-
 1
1
-
9 hours ago, gss1 said:Palo Alto was trading at 523-521 and I placed a buy limit order to trigger at 538 the message box said it was likely to fill immediately.I placed the order and it filled immediately at 523.Why would a limit order for 538 fill immediately at 523?
Hi @gss1,
When you place a limit order your order will be filled at requested price or better.
Since the current price was advantageous to buy the order was filled at a lower price at 523 instead of 538. If you would have sell at a higher price than your limit level as you would have sell for a higher price.
If you want to open an order to buy or sell an asset at a price that is less favorable than the current market price, you would use a stop order. More details here.
I hope that it helps.
All the best - Arvin -
AUSTRALIAN DOLLAR TECHNICAL PRICE OUTLOOK: AUD/USD WEEKLY TRADE LEVELS
- Australian Dollar technical trade level update - Weekly Chart
- AUD/USD surges more than 3.3% off January lows- 2022 yearly open resistance in view
- Aussie resistance 7270, 7365/85 (key), 7531- Support 7129, 7066 (key), 6991-7016 (Major pivot)
-
AUD/JPY resistance 83.67, 84.70 (key), 86 – Support 81.30, 80.32, 78.88-79.39 (critical)
The Australian Dollar is attempting to mark a third consecutive weekly advance against the US Dollar this week with AUD/USD now eyeing resistance the objective yearly open. Likewise, AUD/JPY has already failed a test of yearly open resistance with a clean yearly opening-range now intact. Is this just a recovery or is a larger reversal underway for Aussie? These are the updated targets and invalidation levels that matter on the AUD/USD & AUD/JPY weekly price charts. Review my latest Weekly Strategy Webinar for an in-depth breakdown of this Aussie technical setup and more.
AUSTRALIAN DOLLAR PRICE CHART – AUD/USD WEEKLY
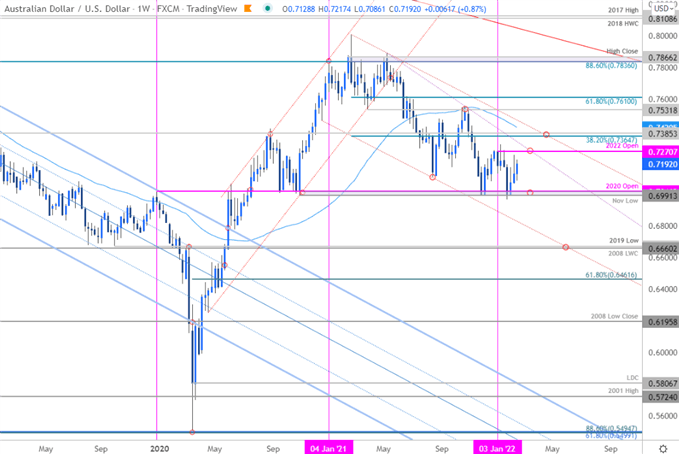
Chart Prepared by Michael Boutros, Technical Strategist; AUD/USD on Tradingview
Notes: In last month’s Australian Dollar Technical Forecast we note that, “The Australian Dollar recovery may be vulnerable while below the yearly open here. From a trading standpoint, the focus is on a break of the January range for guidance…” A decisive break below the monthly opening-range saw Aussie plunge more than 4.7% from the yearly high, back into a critical support pivot at 6991-7016- a region defined by the 2021 low, the 2018 lows, and the 2020 yearly open. The immediate focus is on this potential third-weekly rally off support- just a rebound or a larger reversal?
Yearly-open resistance stands at 7270 backed by a more significant technical confluence at the 38.2% Fibonacci retracement of the 2021 decline / 2017 May low-week close at 7365/85- note that this threshold converges on the 2021 downslope into the open of Q2 with the 52-week moving average just higher at ~7420. Weekly-open support rests at 7129 with near-term bullish invalidation set to the monthly open at 7066- losses should be limited by these levels IF price is indeed heading for a breakout.
Bottom line: The Australian Dollar recovery off key support at the 2021 lows is now approaching the objective 2022 early open- the focus is on a reaction into this zone IF reached. From a trading standpoint, a good region to reduce long-exposure / raise protective stops – losses should be limited by the monthly open with a breach / weekly close above the 52-week moving average needed to suggest a more significant low was registered last month. Review my latest Australian Dollar Price Outlook for a closer look at the near-term AUD/USD technical trade levels.
For a complete breakdown of Michael’s trading strategy, review his Foundations of Technical Analysis series on Building a Trading Strategy
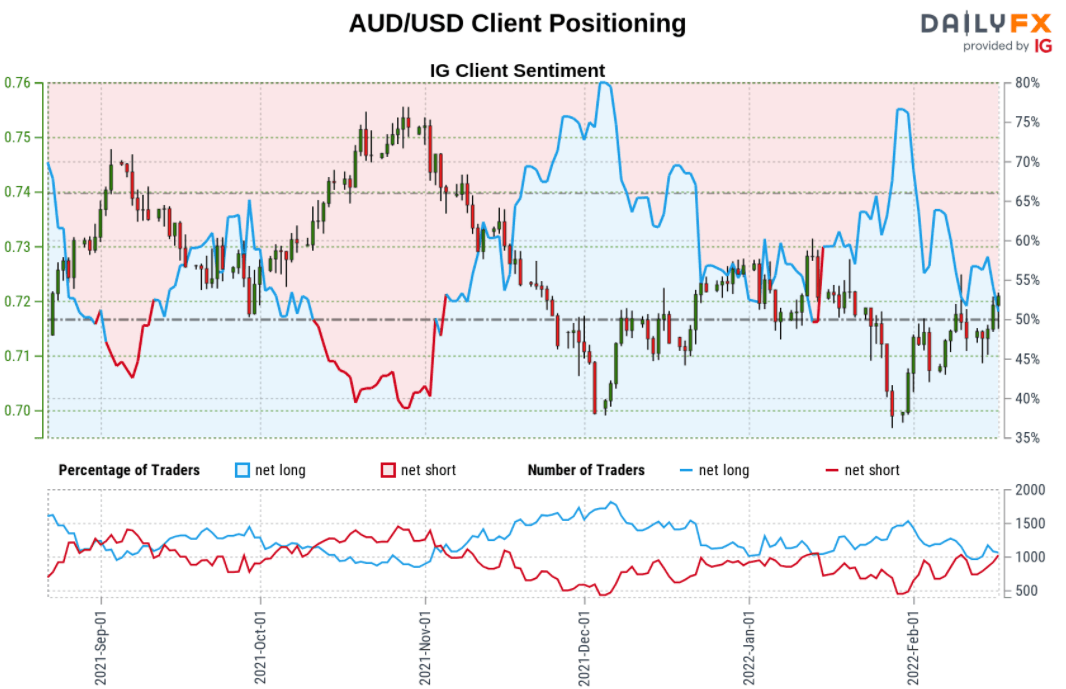
AUSTRALIAN DOLLAR TRADER SENTIMENT – AUD/USD PRICE CHART
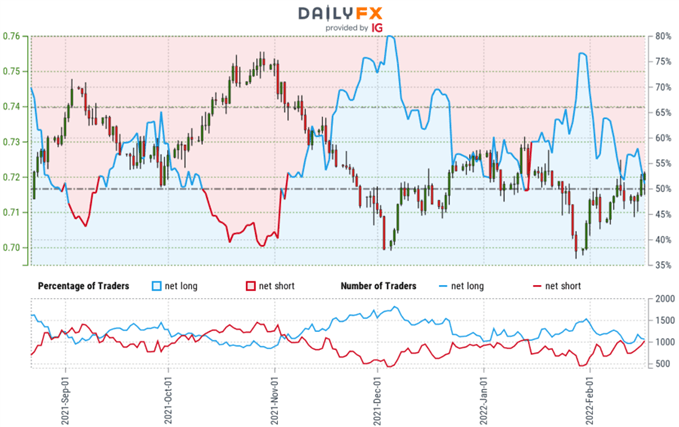
- A summary of IG Client Sentiment shows traders are net-short AUD/USD - the ratio stands at -1.02 (49.45% of traders are long) – typically neutral reading
- Long positions are 6.90% lower than yesterday and 14.94% lower from last week
- Short positions are0.19% lower than yesterday and 1.85% higher from last week
-
We typically take a contrarian view to crowd sentiment, and the fact traders are net-short suggests AUD/USD prices may continue to rise. Traders are further net-short than yesterday and last week, and the combination of current positioning and recent changes gives us a slightly stronger AUD/USD-bullish contrarian trading bias from a sentiment standpoint.

AUSTRALIAN DOLLAR VS JAPANESE YEN PRICE CHART - AUD/JPY WEEKLY
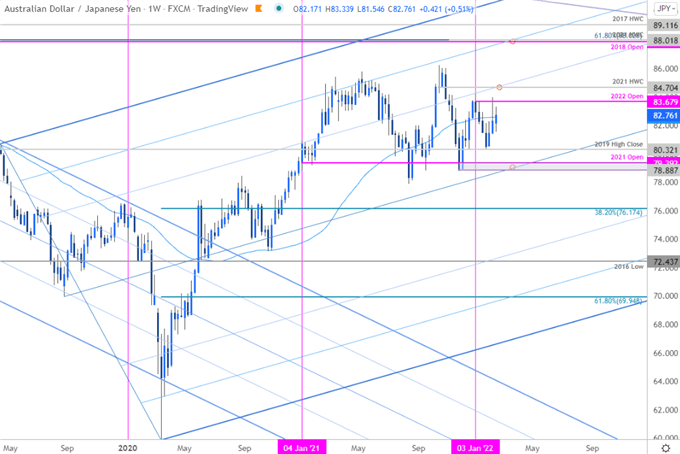
Chart Prepared by Michael Boutros, Technical Strategist; AUD/USD on Tradingview
Notes: A similar scenario can be seen on AUD/JPY with price now attempting to breach above its 52-week moving average at ~82.57. Monthly open support rests at 81.30 backed by the 2019 high close at 80.32- note that this level also represents the yearly opening-range lows and if broke could see a test of a more significant technical confluence at the November low-week close / 2021 yearly-open at 78.88-79.39 – look for a larger reaction there IF reached. A topside breach / close above the yearly open at 83.67 would keep the focus on the 2021 high-week close at 84.70 – a level of interest for possible topside exhaustion IF reached. We’ll touch base on this setup again soon- stay tuned.
---
KEY AUSTRALIA / JAPAN / US DATA RELEASES
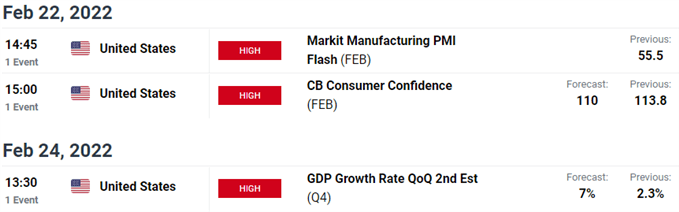
Economic Calendar - latest economic developments and upcoming event risk.
PREVIOUS WEEKLY TECHNICAL CHARTS
- Crude Oil (WTI)
- Japanese Yen (USD/JPY)
- Canadian Dollar (USD/CAD)
- Gold (XAU/USD)
- British Pound (GBP/USD)
- US Dollar Index (DXY)
- New Zealand Dollar (NZD/USD)
- Euro (EUR/USD)
Follow Michael on Twitter @MBForex
DailyFX provides forex news and technical analysis on the trends that influence the global currency markets.
DISCLOSURES
Michael Boutros, Technical Currency Strategist with DailyFX
18 February 2022-
1
-
19 hours ago, igreen said:
Hi All,
I am trying to chart the Relative Strength-RS (not the RSI) of an instrument Vs a Market(Indies), but that is missing on IG Charting. Has anyone found a way of plotting this on the IG platform or PRT platform?
Thank you in advance
Hi @igreen,
Thank you for your message, I have forwarded your request to add a RS tool on the IG charts to the relevant department.
All the best - Arvin -
S&P 500, NIKKEI 225 INDEX, ASX 200 INDEX OUTLOOK:
- Dow Jones, S&P 500 and Nasdaq 100 indexes closed -0.16%, +0.09% and -0.12% respectively
- January’s FOMC minutes delivered few surprises on the Fed’s tightening roadmap
- Asia-Pacific equities look set to open mixed. Crude oil prices pulled back on hopes for Iran nuclear talks
S&P 500, FOMC Minutes, Crude Oil, Asia-Pacific at Open:
The S&P 500 index ended Wednesday’s trading with a small gain as investors shrugged off Russia-Ukraine tensions after Moscow said that some troops were withdrawn from the border. President Vladimir Putin said that the country is seeking a diplomatic solution to resolve disputes with Ukraine, alleviating concerns about an imminent military conflict.
In the near term, geopolitical risks remain in focus as the political skies are far from clear. President Joe Biden warned that the US has not verify Moscow’s claims and an invasion is still possible, leaving risk assets vulnerable to a pullback should the situation in Eastern Europe re-escalate.
January’s FOMC meeting minutes shows that the central bank is preparing to raise interest rates and reduce the size of its bond portfolio soon. Fed officials also noted that “recent inflation readings had continued to significantly exceed the Committee’s longer-run goal and elevated inflation was persisting longer than they had anticipated”. This may pave the way for a faster pace of tightening, especially after January’s CPI readings exceeded market expectations.
The Committee agreed that “it would soon be appropriate to raise the target range for the federal funds rate in light of elevated inflation pressure and the strong labor market”, hinting that a liftoff in March is on the table. Overally, the minutes didn’t deliver much of a surprise, and the tone seems to be more dovish-biased than the market had anticipated. Against this backdrop, equity market reacted mutely while the US Dollar extended lower, setting a mixed tone for APAC markets at open.
Crude oil prices pulled back for a second day from their 7-year highs as tensions surrounding the Ukraine border cooled. Meanwhile, ongoing talks between Iran and world powers to revive the 2015 nuclear agreement reignited hopes for more crude oil supply from the Middle Eastern country, weighing on prices.
WTI Crude Oil - Daily
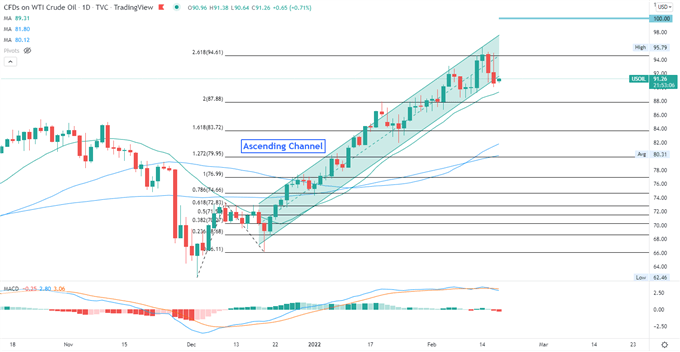
Chart created with TradingView
Asia-Pacific stock markets look set to open mixed on Thursday. Futures in Japan, mainland China, Australia, South Korea, India, Thailand and Indonesia are in the green. Those in Hong Kong, Taiwan and Singapore are in the red.
Australian jobs data beat market expectations on the upside, with 12.9k jobs added in January. But the amount is not substantial enough to alter the outlook for interest rate hikes. The Australian Dollar is little changed after the release of jobs data and the ASX 200 index is trading higher at open.
Looking ahead, investors will be eyeing US initial jobless claims data for clues about the health of the labor market. Find out more from the DailyFX calendar.
Looking back to Wednesday’s close, 7 out of 9 S&P 500 sectors ended higher, with 59.8% of the index’s constituents closing in the green. Energy (+0.76%), materials (+0.65%) and industrials (+0.52%) were among the best performers, whereas communication services (-0.20%) and information technology (-0.17%) trailed behind.
S&P 500 Sector Performance 16-02-2021
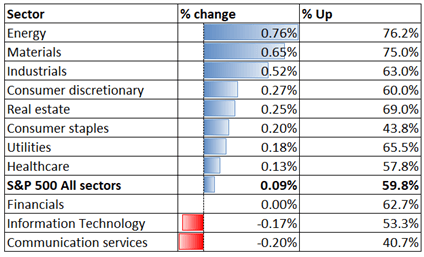
Source: Bloomberg, DailyFX
S&P 500 Index Technical Analysis
The S&P 500 index may have entered a meaningful correction after breaching below an “Ascending Channel” as highlighted on the chart below. Prices have likely formed a “Double Top” chart pattern, which is commonly viewed as a bearish trend-reversal indicator. Immediate support level can be found at around 4,300 – the previous low. The MACD indicator is trending higher beneath the neutral midpoint, suggesting that a technical rebound maybe underway but the overall momentum remains weak.
S&P 500Index – Daily Chart
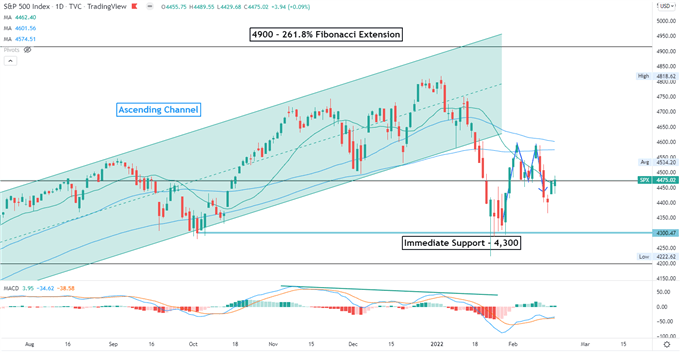
Chart created with TradingView
Nikkei 225 Technical Analysis:
The Nikkei 225 index breached below a “Symmetrical Triangle” pattern and thus opened the door for further downside potential. Prices are attempting for a rebound over the last two weeks, forming a higher high and a higher low. The lower trendline of the “Symmetrical Triangle” has now become immediate resistance. The MACD indicator is trending higher, suggesting that bullish momentum may be building.
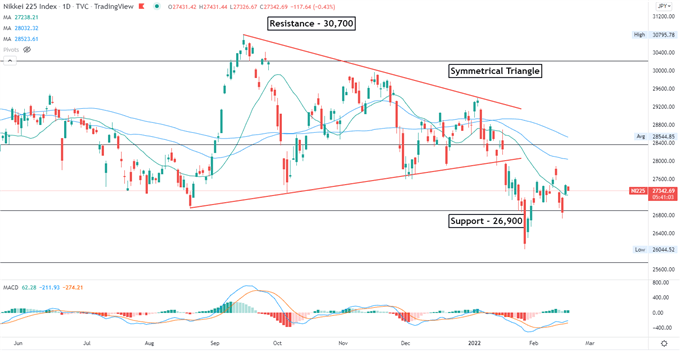
Chart created with TradingView
ASX 200 Index Technical Analysis:
The ASX 200 index returned to the range-bound zone between 7,200 and 7,500, riding a strong technical upswing. Prices have pulled back to the floor of the range looking for immediate support. The MACD indicator formed a bullish crossover beneath the neutral midpoint, suggesting that a technical rebound is underway.
ASX 200 Index – Daily Chart
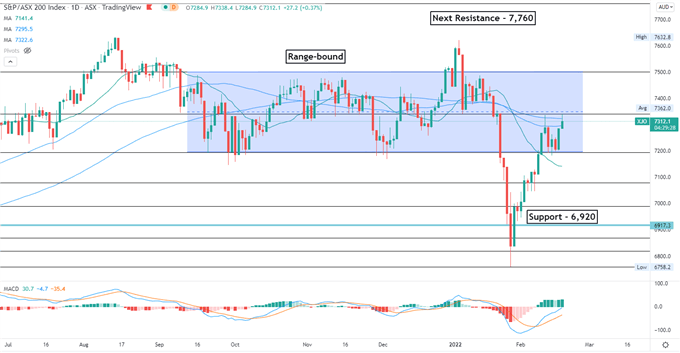
Chart created with TradingView
To contact Margaret, use the Comments section below or @margaretyjy on Twitter
DailyFX provides forex news and technical analysis on the trends that influence the global currency markets.
DISCLOSURES
Margaret Yang, Strategist for DailyFX.com
17 February 2022-
1
-
3 hours ago, Jeffch said:
I had initiated a share transfer about 2 months ago ( transferring out from IG). But there is still one stock that my new broker hasn’t received.
My new broker said they raise few requests to IG but didn’t receive any response, and when I called IG they just kept saying the share has been sent out.
just wondering how can I deal with this?
Hi @Jeffch,
With Broker to Broker transfer out your broker will need to contact our transfer team to get an update on the progress of the transfer.
You can try to reach out to austransfers@ig.com but your shares already left your account. What happens is that your new broker and our broker agree on a date to transfer the shares. Therefore your broker should know when it was done.
All the best - Arvin -
19 hours ago, mondrian said:
I track various daily moving averages but never use the daily time frame for trading. So I actually draw arrows indicating the current position of the various moving averages so I can see where they are on the chart time frame that I trade in. I need to update the arrows every couple of days which is tedious.
It would be helpful to have the option to lock an indicator to a time frame somewhere in it's configuration panel.
Hi @mondrian,
Thank you for your feedback. Effectively you can save indicators and layout and the platform will automatically save the interval you were using previously. But, there is no way to link a layout to a specific interval. I forwarded your feedback to the relevant department.
All the best - Arvin -
19 hours ago, mondrian said:
Current options are linear and percent
Hi @mondrian,
I have forwarded your feedback to the relevant department to be reviewed.
All the best - Arvin -
On 11/02/2022 at 23:09, clarkeif said:
I have this issue as well and a time to fix would be useful.
Hi @clarkeif,
Are you still experiencing issues with the platform?
Thank you - Arvin


Fees on Partially-Filled Orders
in IG Account Support - MyIG Help
Posted
Hi @Jpn,

I apologies for the confusion, as mentioned above, to eliminate any partial fill you can chose the execute & eliminate, but it is possible that your order is not completely filled ( but your order will be then closed). Otherwise you will need to buy the stock at current price if the quantity is available to avoid partial fills.
Alternatively you can change the order type to Market Order:
A market order is an instruction from a trader to their broker to execute a trade immediately at the best available price. Market orders are usually implemented very quickly, provided there is enough liquidity in the market. When a market order has been executed, it is referred to as a ‘filled order’.
If you have further questions, please to reach out to helpdesk.uk@ig.com or use the live chat feature on our website. Our Helpdesk team will be able to assist you further and guide you through the dealing ticket.
I hope that it helps.
Thank you - Arvin