

ArvinIG
-
Posts
1,728 -
Joined
-
Last visited
-
Days Won
23
Content Type
Profiles
Forums
Blogs
Events
Community Tutorials
Store
Posts posted by ArvinIG
-
-
1 hour ago, weeky1 said:
I am having the same problem as noted in the question posted back in 2017 at the below link, but havent been able to find a fix. Does anyone know whether this was sorted?
Hi @weeky1,
Could you please clarify which market is it and what type of account you are using?
Thank you - Arvin -
3 hours ago, Superlamb said:
Hi Team,
Weird thing just happened (21:25:48 2022.03.24)
I clicked on the X to close out three of my open XAUUSD Long trades and instead of closing them out, MT4 / IG opened three short trades on AUDJPY.
I was not on the AUD JPY screen, and i did not have any trades open on the AUDJPY.
Every time I tried to close out the XAUUSD trades using the X, the popup trade screen was to the AUDJPY.
I could not enter a sell order as there was no instant execution available on the commodity at the time of my trade.
This is a weird glitch, can you please explain

Hi @Superlamb,
We might need more details to be able to assist you further. Could you please contact helpdesk.au@ig.com, use our live chat feature or call 1800 601 734, our team will be able to investigate and help you rectify your orders.
All the best - Arvin
-
1 hour ago, Grego999 said:
Yep sure is

Hi @Grego999,
This server is not the IG Demo server you can type manually demo-mt4.ig.com:443 to use the IG MT4 Demo server.
All the best - Arvin -
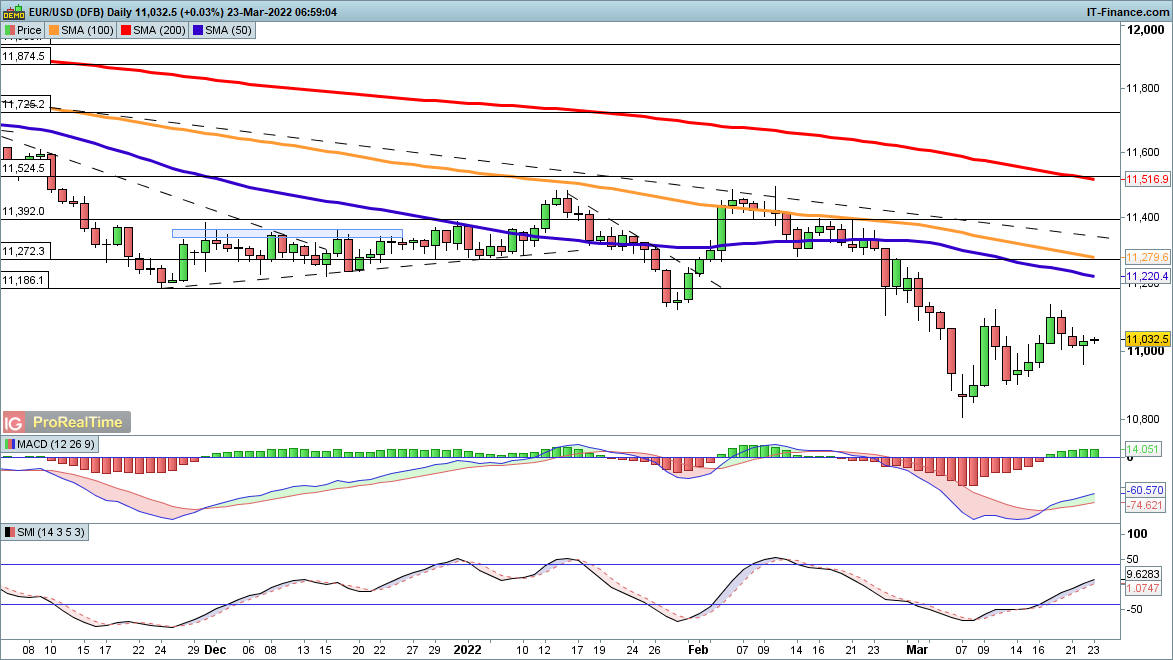
The pound is holding firm in the wake of another strong CPI reading, while EUR/USD and USD/JPY are looking for additional upside.
EUR/USD holds around $1.10
A recovery continues here with EUR/USD in the short term, with a bounce from yesterday’s lows helping to maintain the bullish view. However, the price has yet to attempt a move above $1.11 resistance so far this month.
Even a bounce towards $1.12 leaves the downtrend intact. In the near term a fall back below yesterday’s lows at $1.096 would mark a bearish development and potentially bring the $1.08 level back into view.
 Source: ProRealTime
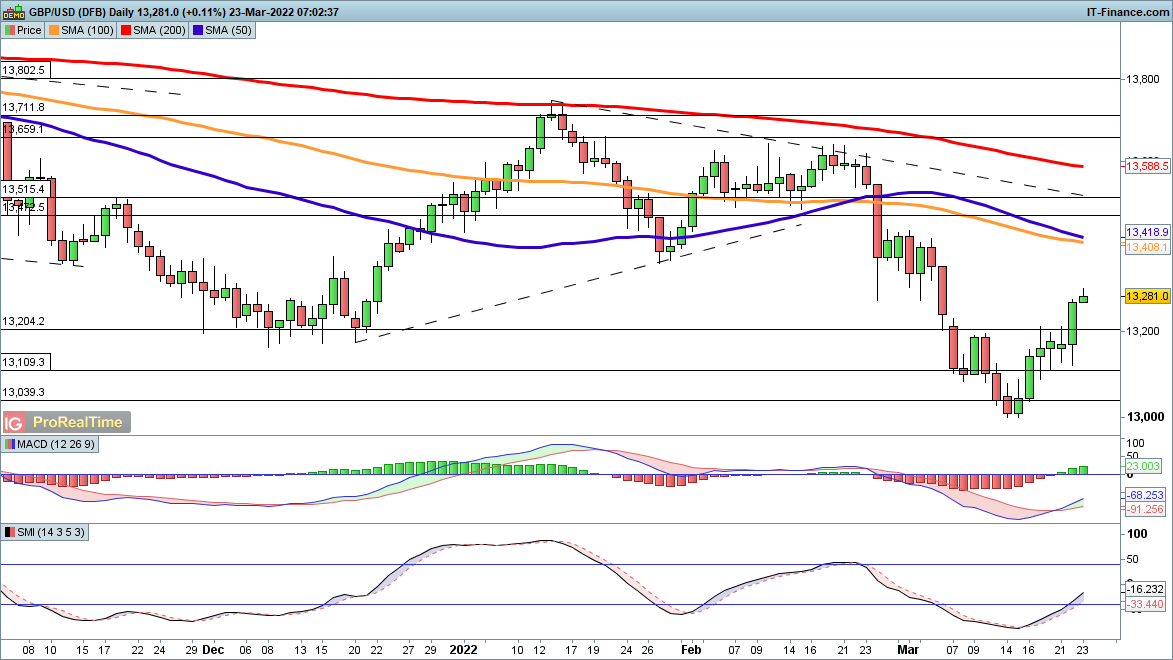
GBP/USD steady after CPI figures
A solid bounce here with GBP/USD yesterday has put new life into the countertrend rebound that has been in progress since the middle of the month. However, this rebound from a lower low is still within a much broader downtrend, and as with EUR/USD, the possibility of a lower high is still strong.
For now, the buyers have the upper hand, and a move back towards $1.34 seems likely. A reversal below $1.32 would suggest a new leg lower is underway.
 Source: ProRealTime
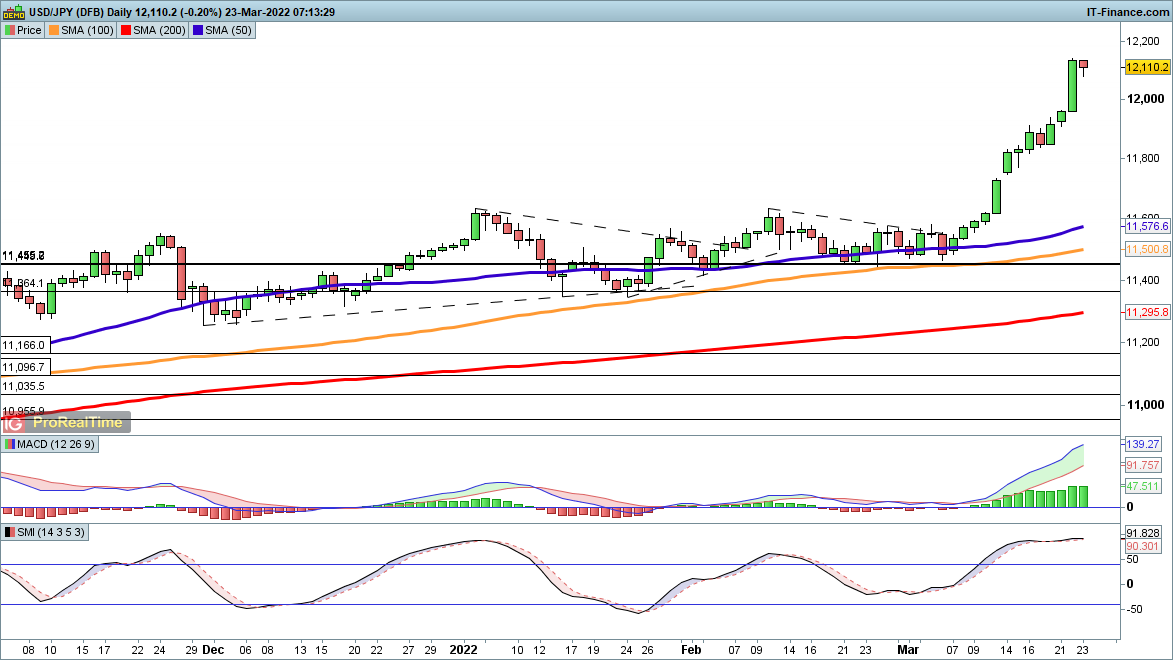
USD/JPY holds near highs
The remarkable bounce in USD/JPY shows no sign of slowing, and indeed it has accelerated in pace, surging through the ¥120.00 level. By any measure this is overextended, but for now bullish momentum continues to carry it higher. The 2007 and 2015 highs at ¥124.00 are now the next big levels to watch on the upside.
Buyers should beware of the potential for a pullback however, with a move back towards the 50-day simple moving average (SMA) creating a higher low and leaving the uptrend intact, even if much of the ground gained over the past three weeks is given back.
 Source: ProRealTime
-
8 hours ago, blackarrow said:
started a demo account under the heading share trading but no access to it.. is a new user being funneled into the risky stuff straight away? feeling uneasy about opening a live account already..
Hi @blackarrow,
Thank you for your post. We are are not offering Share trading on demo accounts as Share trading is DMA meaning the orders goes directly on the market. Therefore you won't be able to play around unlike CFD or Spread betting demo accounts.
The major difference with the CFD account and Share trading is that with share trading you will pay a different set of commission and you will need to pay the full amount of the share as you are not using leverage.
We forwarded your feedback on adding a share trading account to the relevant department.
I hope that it helps.
All the best - Arvin -
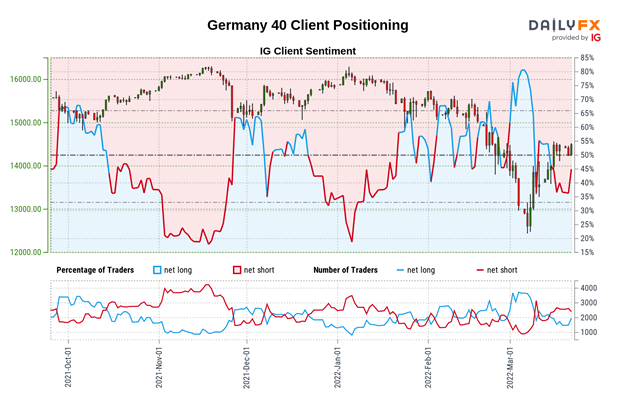
Retail traders are becoming increasingly pessimistic on European equities and rising DAX 40 and FTSE 100 short bets indicate a contrarian market signal.

Source: BloombergEuropean benchmark stock indices have been on the rise recently, pushing more retail investors to sell the rips. This can be seen by using IG Client Sentiment (IGCS). According to the data, downside bets have been on the rise in the DAX 40 and FTSE 100 indices. At times, IGCS can function as a contrarian indicator. If this trend in positioning continues, then the DAX and FTSE could be open to extending recent gains.
DAX 40 sentiment outlook - bullish
The IGCS gauge shows that about 41% of retail traders are net-long the DAX 40. Since most traders are biased to the downside, this hints that prices may continue rising. This is as short exposure has climbed by 18.76% and 20.95% compared to yesterday and last week, respectively. With that in mind, the combination of overall and recent shifts in positioning is offering a bullish contrarian trading bias.
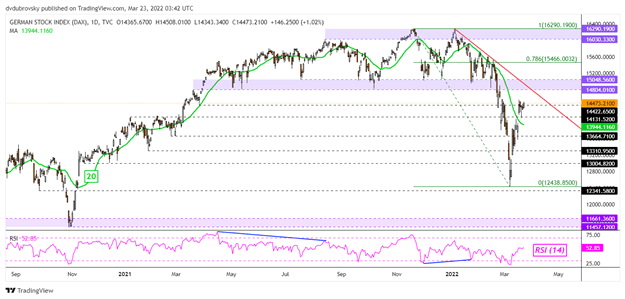
Source: DailyFXDAX 40 daily chart
The DAX 40 index has climbed an impressive +16% since finding a low in early March. This followed deep losses throughout January and February. Prices recently confirmed a break above the 20-day Simple Moving Average (SMA), exposing the falling trendline from December. The latter could be the next key technical test to see if there is more upside momentum to be found here. Clearing the trendline exposes the 78.6% Fibonacci retracement at 15466 before all-time highs kick in above.
Source: TradingViewFTSE 100 sentiment outlook - bullish
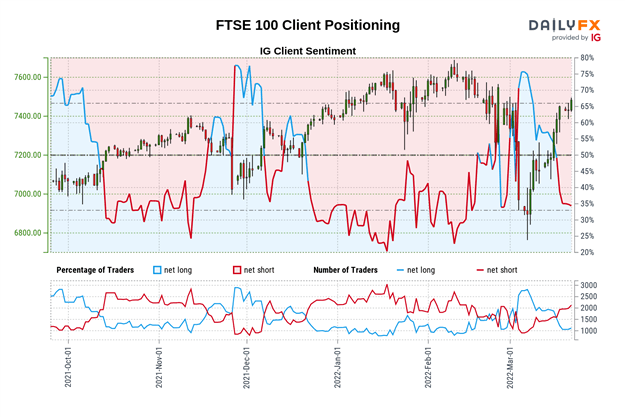
The IGCS gauge shows that about 33% of retail traders are net-long the FTSE 100. Since most investors are biased to the downside, this hints that prices may continue rising. This is as short bets increased by 8.59% and 43.46% compared to yesterday and last week, respectively. With that in mind, the combination of overall and recent shifts in positioning is offering a bullish contrarian trading bias.
Source: DailyFXFTSE 100 daily chart
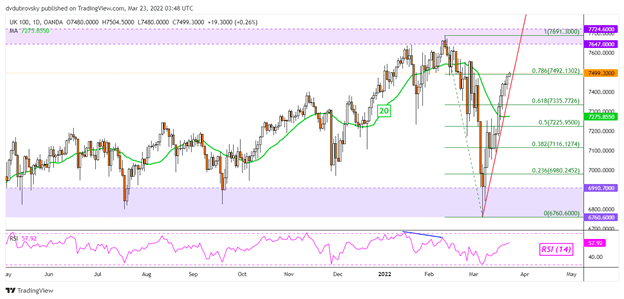
Like the DAX 40, the FTSE 100 is up strongly since finding a low in early March. This followed steep losses in February. Prices have confirmed a breakout above the 20-day SMA and are now testing the 78.6% Fibonacci retracement. Confirming a break above the latter may open the door to retest all-time highs, making for a key zone of resistance between 7646 and 7724. On the downside, keep a close eye on a near-term rising trendline from the beginning of March. Falling under it risks opening the door to losses.
Source: TradingViewFollow Daniel Dubrovsky on Twitter @ddubrovskyFXThis information has been prepared by DailyFX, the partner site of IG offering leading forex news and analysis. This information Advice given in this article is general in nature and is not intended to influence any person’s decisions about investing or financial products.
The material on this page does not contain a record of IG’s trading prices, or an offer of, or solicitation for, a transaction in any financial instrument. IG accepts no responsibility for any use that may be made of these comments and for any consequences that result. No representation or warranty is given as to the accuracy or completeness of this information. Consequently, any person acting on it does so entirely at their own risk.
Daniel Dubrovsky | Currency Analyst, DailyFX, San Francisco
23 March 2022 -
7 hours ago, JamesCurtis said:
Hi,
I was looking to purchase the HANetf Alerian Midstream Energy Dividend UCITS ETF in my IG ISA.
The two tickers are PMLP (in GBP) and MMLP (in USD). I can find the ETF on other platforms so I know the fund is still trading.
When I try to purchase it says it is not permitted in the tax wrapper (ISA), which it should be as it is UCITS.
Please could this be enabled for trading and for the ISA?
Hi @JamesCurtis,
If the ETFs you are after are ISA permitted feel free to add them on this Stock request post to be added:It seems that PMLP is already on the platform :

All the best - Arvin -
3 hours ago, Goldenforest said:
how/ where can I find trade confirmation ?
Hi @Goldenforest,
You should receive a confirmation once a position is opened or closed. Please ensure that your notifications are activated on My IG > Settings > Price and dealings alerts:
Alternatively the trade should reflect in your history.
All the best - Arvin -
EUR/USD upswing is intact for now but there are challenges ahead; EUR/CHF has seen a pullback but remains on firm footing for the moment and short-term momentum favours the euro.
Source: BloombergEUR/USD technical outlook
After making a 2-year low at 1.08062 two weeks ago, EUR/USD has managed to gain some short-term bullish momentum as it crossed above the 10-day simple moving average (SMA) and it’s gradient is positive.
Further bullish momentum may unfold if the price is to cross above the 21-day SMA, but it would take a sustained rally above it to turn the gradient to a positive slope.
Nearby resistance might be at the recent peaks of 1.11212 and 1.11375. Further up, resistance could be at the previous highs and pivot points of 1.12743, 1.12802, 1.13751, 1.13959, 1.14830 and 1.14949.
The slight weakness of the last few sessions has the price nearing an ascending trend line, currently intersecting at 1.0995, a level of potential support.
Below there, the previous lows of 1.0891 and 1.08062 are potential levels of support.
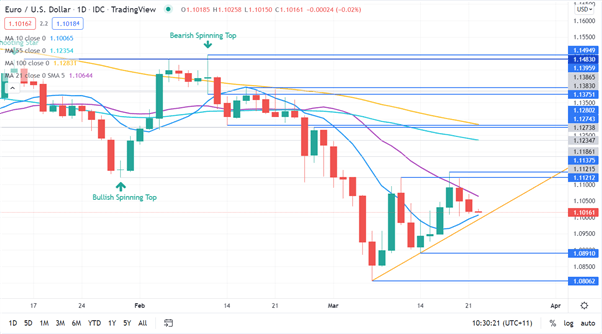
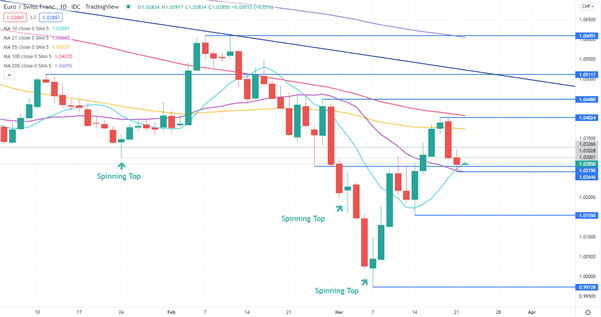
Source: TradingViewEUR/CHF technical outlook
Similar to EUR/USD, EUR/CHF made a 7-year low 2-weeks ago at 0.99728.
It has not traded at these levels since the Swiss National Bank (SNB) abandoned protecting the so-called “Swissy” from what it perceived to be overvaluation.
Yesterday’s price action saw EUR/CHF sneak below support at 1.02790 and touch the 10 and 21-day simple moving average (SMA) before bouncing back above 1.02790.
The next few sessions might be significant for the cross, as a continuation higher is a rejection of that attempt to go lower. While a decisive move below the 21-day SMA may signal short-term bullish momentum has evaporated.
To the downside, immediate support could be at yesterday’s low of 1.02646 which is also the current level of the 21-day SMA. Further down support may lie at the prior lows of 1.01550 and 0.99728.
On the upside, the 55 and 100-day SMAs are straddling the recent peak of 1.04024 and might provide a zone of resistance, as well as the prior high of 1.04480.
A pivot point at 1.05117 also has a descending trend line dissecting near it and could offer resistance. Above there the 200-day SMA is also near the February high of 1.06091, offering potential resistance.
Source: TradingViewFollow Daniel McCarthy on Twitter at @DanMcCarthyFX
This information has been prepared by DailyFX, the partner site of IG offering leading forex news and analysis. This information Advice given in this article is general in nature and is not intended to influence any person’s decisions about investing or financial products.
The material on this page does not contain a record of IG’s trading prices, or an offer of, or solicitation for, a transaction in any financial instrument. IG accepts no responsibility for any use that may be made of these comments and for any consequences that result. No representation or warranty is given as to the accuracy or completeness of this information. Consequently, any person acting on it does so entirely at their own risk
Daniel McCarthy | Strategist
23 March 2022 -
5 hours ago, amilio said:
I manage to re open my cfd accounts .thank you
but I have a second question .... now that I have opened a CFD account . i still cant use L2 platform to trade CFDs..
every time I take a position, the report tells me I have 0 balance ...ps( im using my L2 platform for share dealing and i have over 15k in that account ......
can I not use the money in the account ( L2 ). by simply clicking on the CFD .... and trading ...if not then what account do i need to transfer my money to be able to use the L2 platform to trade CFDs...??
thank you
Hi @amilio,
You can transfer your funds on your share dealing account to your CFD account. You will be able to use this balance to open CFDs positions.
You can transfer funds from My IG > Live accounts > Transfer funds:
I hope that it helps.
All the best - Arvin-
 1
1
-
-
28 minutes ago, Pump_Alpha said:
My account's share dealing status has been on pending for 3 weeks. Can anyone help?
Hi @Pump_Alpha,
Thank you for your post, I reached out to the account opening team. We will send you an email as your application requires further information.
Thank you - Arvin -

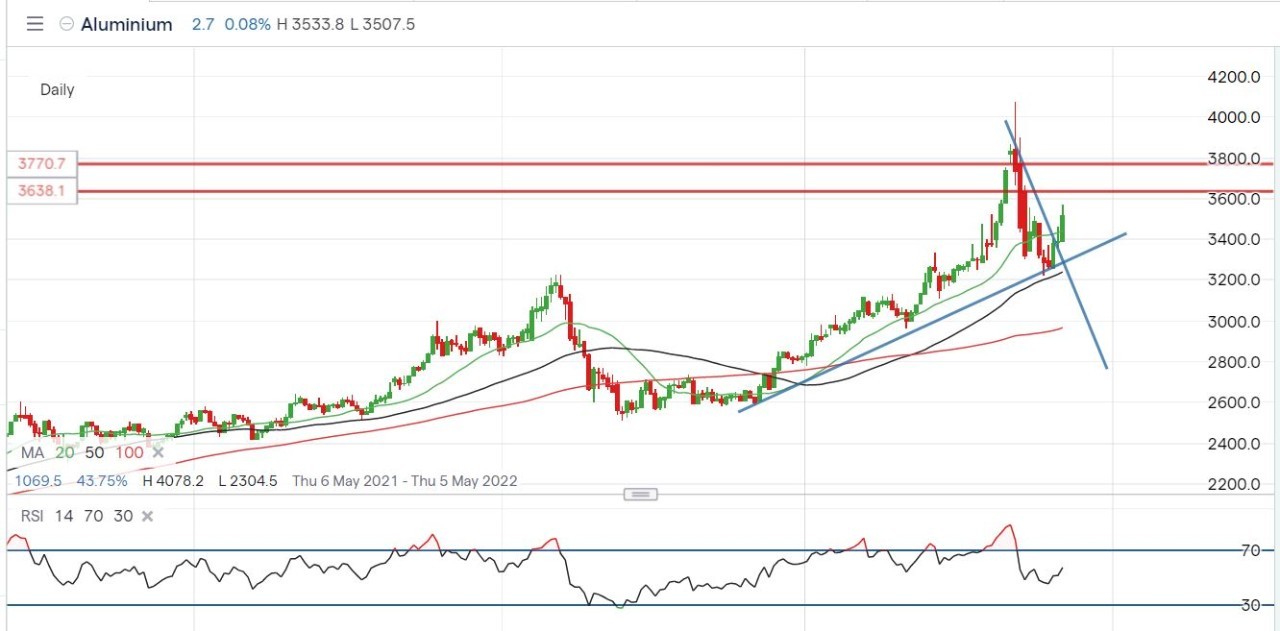
Source: BloombergAluminium
Australia’s ban on alumina and bauxite exports to Russia, the two most essential ingredients for producing aluminium, pushed up the price for the most widely used metal. While aluminium hasn’t been targeted by sanctions, the production of the metal is facing server disruption following the new move.
The 'everyday metal', which is used in everything from the production of cans and smartphones to cars and airplanes, was already running low before the Ukraine war isolated the second-largest exporter from the world economy. As such, the price of aluminium has climbed to its all-time high above $3800 per ton early this month.
The daily chart shows the price has bounced back from 50 MA and targets 20 MA following three consecutive gaining sessions. The long-term bull momentum since December remains valid as demonstrated by the ascending trend line connected by the lows.
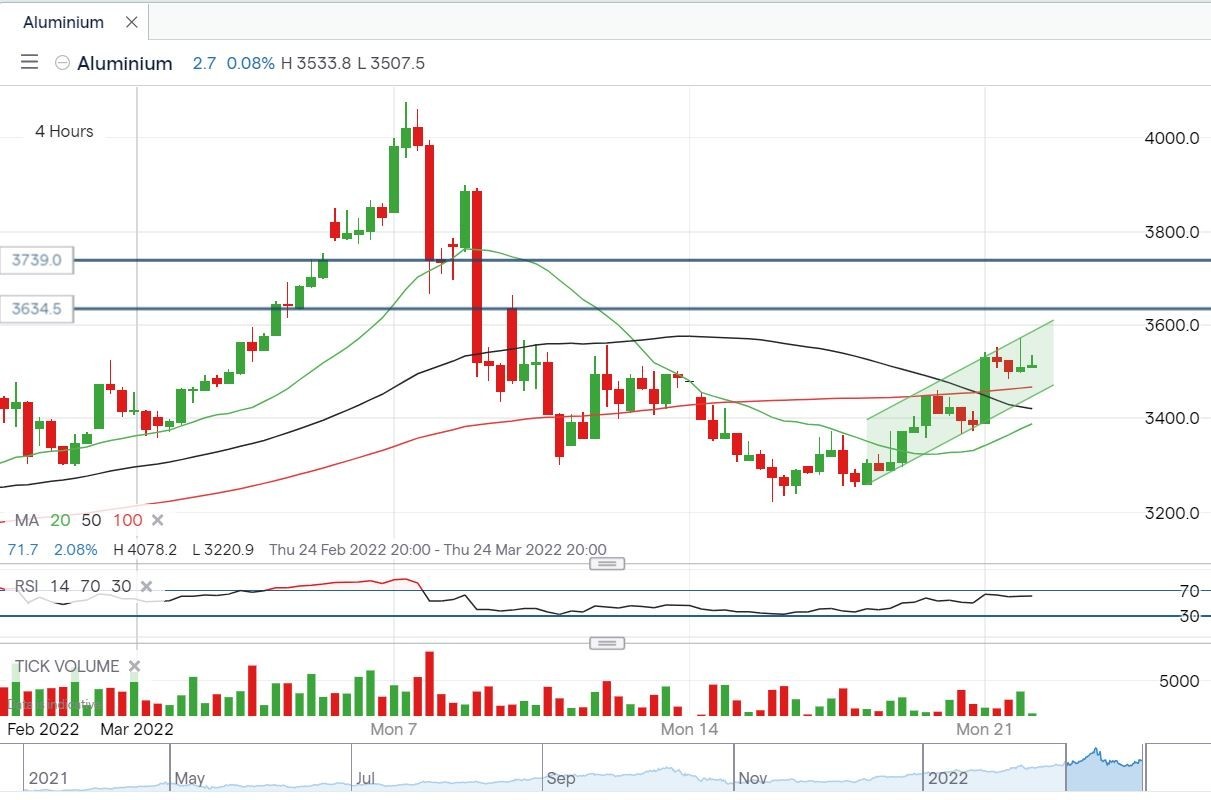
The four-hour chart also suggests the strength of the price as the candlestick is now betraying all the major moving averages and is glued in an upward trajectory.The next resistance is looking at the $3638, which will help the metal regain all the loss in the past two weeks. The months-long trend line will support the price at around $3268 per ton.
Aluminium daily chart
 Source: IG
Aluminium hourly chart
 Source: IG
Brent Crude
The price of Brent Crude oil has been moving up for the sixth straight day and kicked off the new week by more than a 6% jump. Brent Crude, the global benchmark, is trading as high as $114.80 a barrel on Tuesday, enjoying a weekly gain of over 15%. The price rises in the backdrop of EU foreign ministers meeting in Brussels to discuss further sanctions against Russia.
The price of the most crucial energy fell from its decades-high level two weeks ago and is now attempting to move back to its rooftop. The daily chart shows the price has conquered the short-term indicator to stand on the 20 days moving average, with both 50 and 100 MAs are a distance away.
For the near term, the level of $117.4 would be a key hurdle before the price re-enters into the $120 plus zone. A support area between $108 to $109 can be found from the daily trend line.From the sentiment point of view, the RSI in the hourly chart has touched on the oversold territory, which could slow down the bull-bias buying in the near term. However, the RSI level from the daily chart is still under the average level for the past two months, meaning there is potential for the price to edge higher.
Brent Crude daily chart
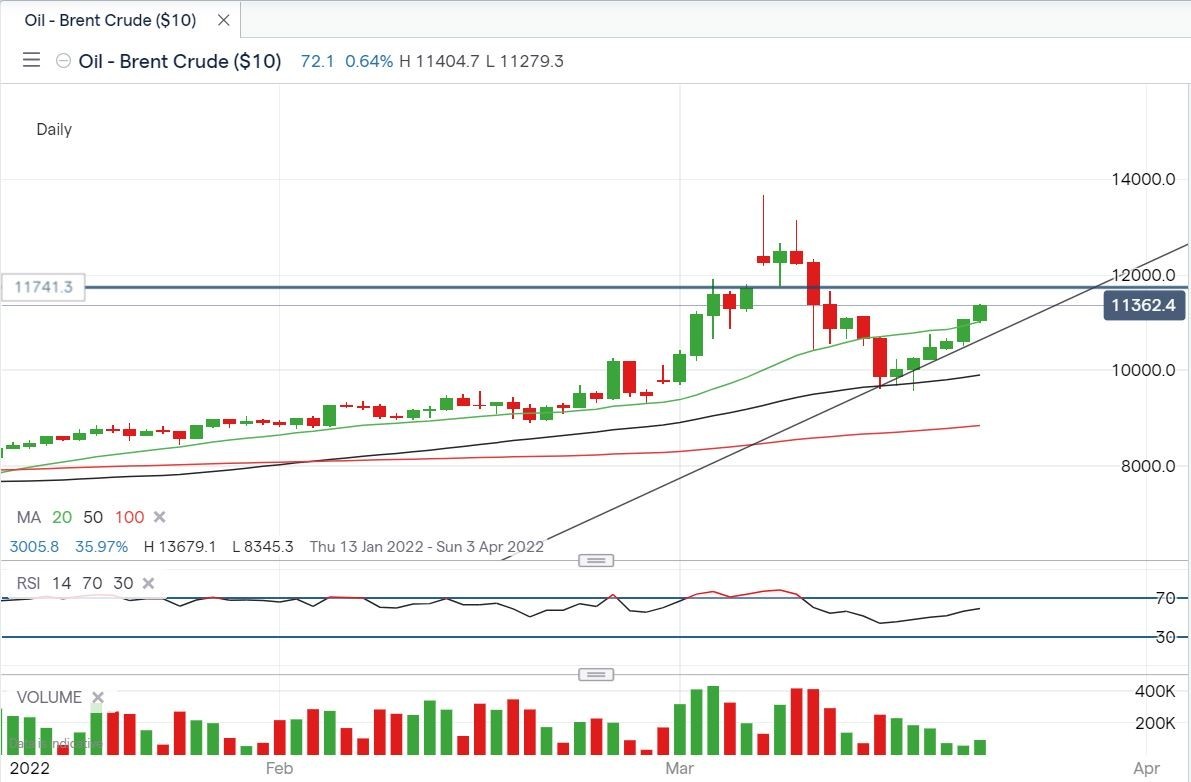 Source: IG
Brent Crude hourly chart
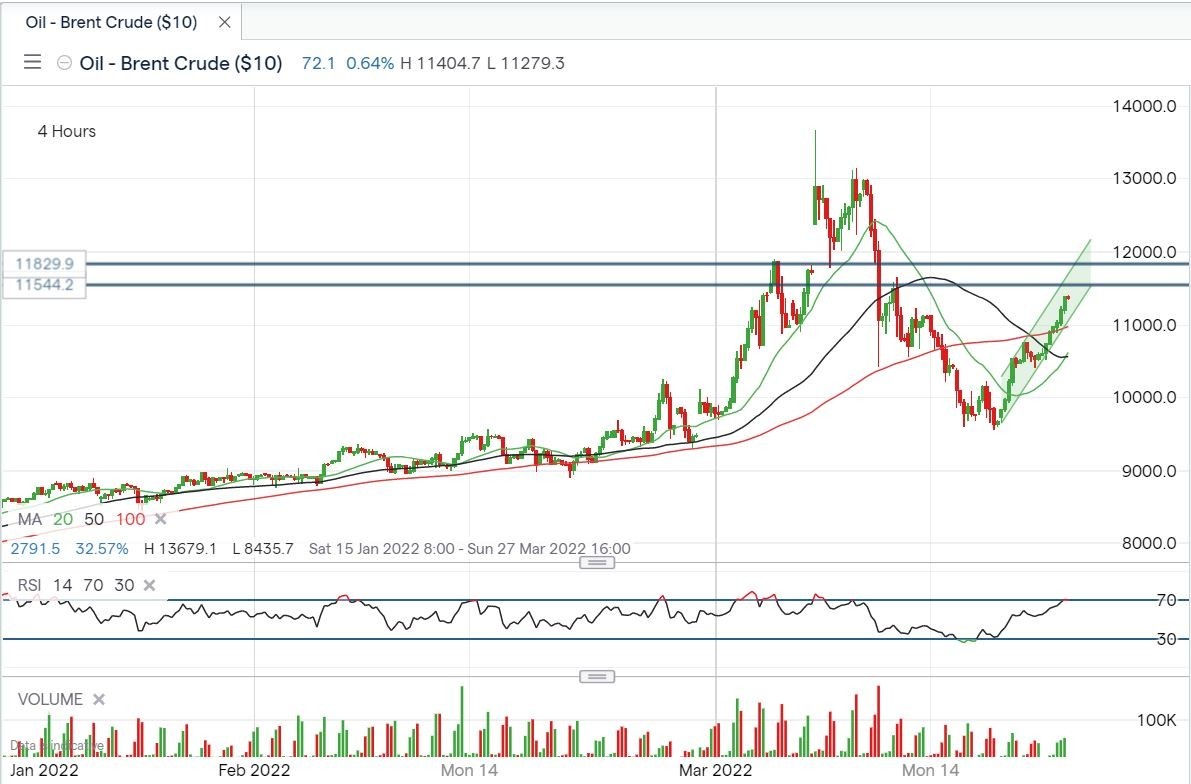 Source: IG
Follow Hebe Chen on Twitter @BifeiChen
Take your position on over 13,000 local and international shares via CFDs or share trading – and trade it all seamlessly from the one account. Learn more about share CFDs or shares trading with us, or open an account to get started today.
Hebe Chen | Market Analyst, Australia
22 March 2022 -
2 hours ago, BlakePicton said:
If I open 3 seperate long trades on one stock, but have one limit order take profit for all 3 entries, do I pay 3x commision on sell or just 1? Thanks
Hi @BlakePicton,
Since it is still considered 3 separate contracts that you entered there will be 3 commissions for each deal/closing.
All the best - Arvin -
On 19/03/2022 at 22:51, hkominos said:
Greetings.
I would like to know what is the official position of IG regarding ISAs for customers moving outside the UK.
As a non-UK taxpayer I assume that account becomes "locked" in the sense that no new positions can be opened but what about the current position and the amounts already in the account? Do they remain ?
What about normal shares accounts?
RegardsHi @hkominos,
Effectively UK ISA and accounts are available for UK tax payer. I do know that if you move out of UK you will need to create a new account in the relevant region you are in as the customer agreements and products will differ accordingly to the local regulations.
Reach out to helpdesk.uk@ig.com or use our live chat feature to confirm if you can keep your ISA account open.
All the best - Arvin -
The four-day rally in AUD/USD appears to be stalling as it struggles to test the yearly high. The exchange rate may consolidate over the remainder of the month if it snaps the series of lower highs and lows.

Source: BloombergAustralian dollar forecast: AUD/USD rally stalls ahead of yearly high
AUD/USD gives back the advance from the start of the week as Federal Reserve Chairman Jerome Powellreiterates that 'the economy is very strong and is well positioned to handle tighter monetary policy,' with the central bank head going onto say that the central bank could 'move more aggressively by raising the federal funds rate by more than 25 basis points' while speaking at the annual conference held by National Association for Business Economics (NABE).
It seems as though the Federal Open Market Committee (FOMC) will prepare American households and businesses for a further shift in monetary policy as Chairman Powell warns that 'an extended period of high inflation could push longer-term expectations uncomfortably higher, which underscores the need for the Committee to move expeditiously,' and a growing number of Fed officials may look to adjust the exit strategy at the next interest rate decision on May 4 as the central bank pledges to 'restore price stability.'
Until then, swings in investor confidence may sway AUD/USD as the rebound in risk appetite appears to be propping up the commodity bloc currencies, and a further advance in the exchange rate may fuel the recent flip in retail sentiment like the behavior seen during the previous year.
 Source: TradingView
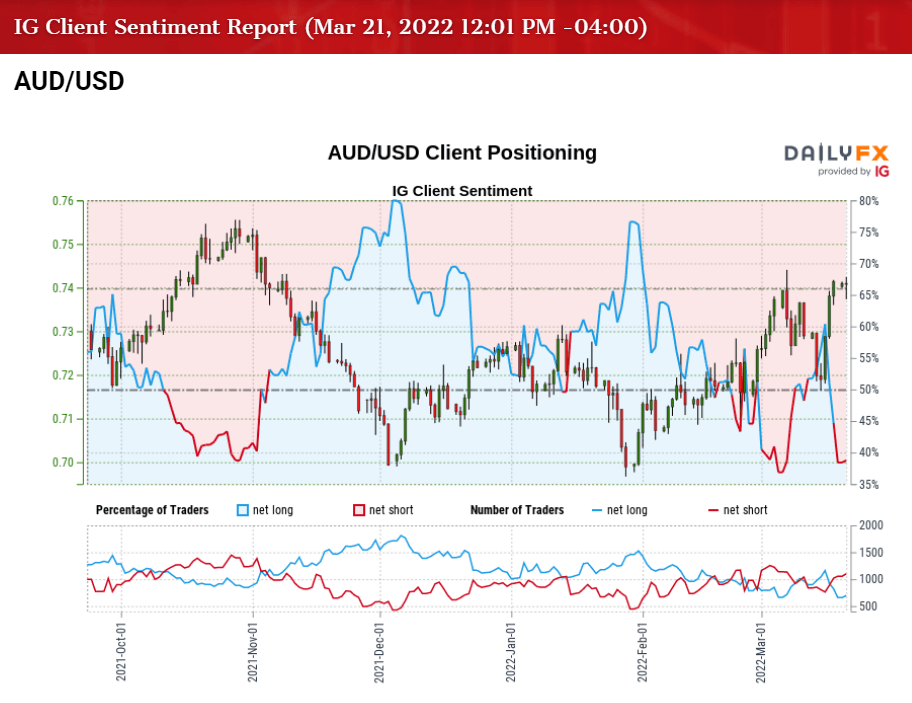
The IG Client Sentiment report shows 37.84% of traders are currently net-long AUD/USD, with the ratio of traders short to long standing at 1.64 to 1.
The number of traders net-long is 15.65% higher than yesterday and 25.76% lower from last week, while the number of traders net-short is 18.48% higher than yesterday and 41.40% higher from last week. The decline in net-long position comes as AUD/USD struggles to retain the advance from the start of the week, while the jump in net-short interest has fueled the recent flip in retail sentiment as 40.65% of traders were net-long the pair during the first full-week of March.
With that said, AUD/USD may attempt to test the yearly high (0.7441) if it manages to retain the series of higher highs and lows carried over from last week, but the advance from the January low (0.6968) may turn out to be a correction in the broader trend as the Fed normalizes monetary policy ahead of the Reserve Bank of Australia (RBA).
AUD/USD rate daily chart
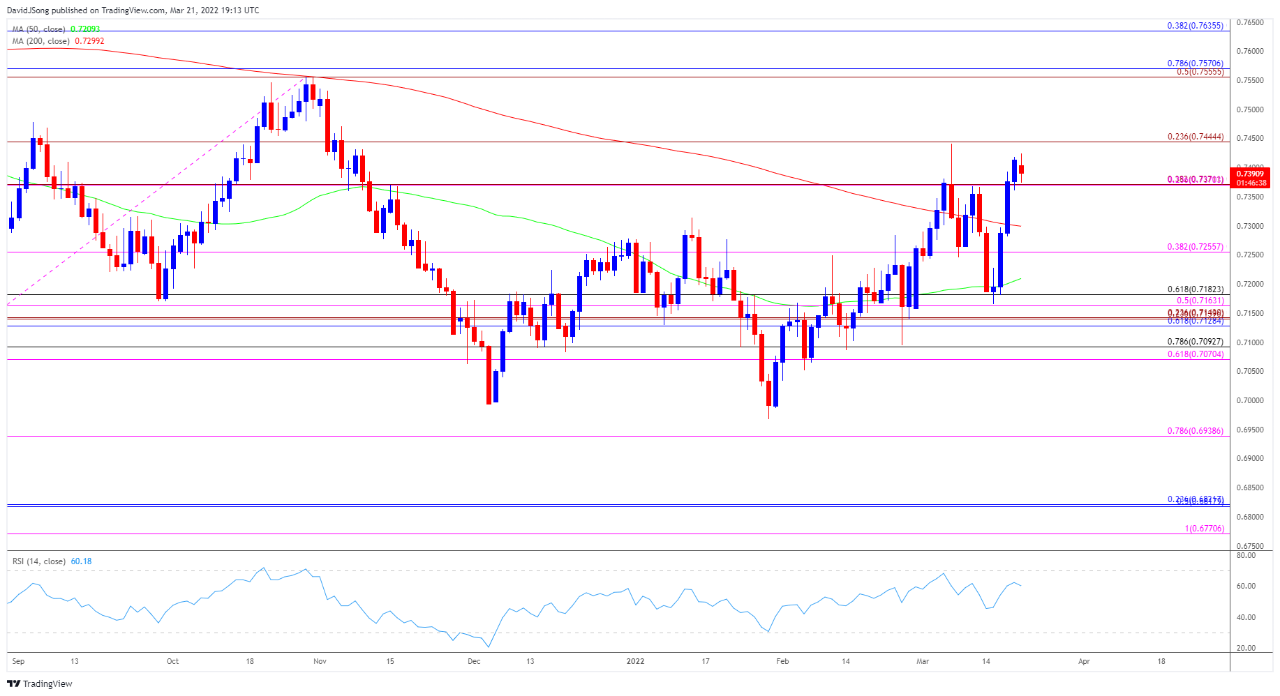 Source: TradingView
- AUD/USD trades above the 200-Day SMA (0.7299) for the first time since June 2021 as it clears the yearly opening range in March, with a break/close above the 0.7440 (23.6% expansion) region opening up the 0.7560 (50% expansion) to 0.7570 (78.6% retracement), which lines up with the October high (0.7556).
- However, AUD/USD may consolidate over the remainder of the month as it struggles to test the yearly high (0.7441), with a move below the 0.7370 (38.2% expansion) region bringing the 0.7260 (38.2% expansion) area back on the radar as the series of higher highs and lows from the monthly low (0.7165) unravels.
- Need a break/close below the Fibonacci overlap around 0.7130 (61.8% retracement) to 0.7180 (61.8% retracement) to open up the 0.7070 (61.8% expansion) to 0.7090 (78.6% retracement) region, with a break of the January low (0.6968) bringing the 0.6940 (78.6% expansion) area on the radar.
Follow David Song on Twitter @DavidJSong
This information has been prepared by DailyFX, the partner site of IG offering leading forex news and analysis. This information Advice given in this article is general in nature and is not intended to influence any person’s decisions about investing or financial products.
The material on this page does not contain a record of IG’s trading prices, or an offer of, or solicitation for, a transaction in any financial instrument. IG accepts no responsibility for any use that may be made of these comments and for any consequences that result. No representation or warranty is given as to the accuracy or completeness of this information. Consequently, any person acting on it does so entirely at their own risk.
David Song | Analyst, DailyFX, New York City
22 March 2022 -
6 hours ago, AJTT101 said:
Hi all - i always have the notifications on so that i can hear a bleep with an order opens or closes - it also pops up in a little box in the top right hand side of the screen. Today however the notifications had stopped dispite me not changing any settings - after much time spent going through the settings to check everything we managed to get the notifications to work on the Demo account but still not on my live account. I did an online chat with IG and was told everything was working fine their end. Can anyone throw any light on what might have happened - everything is switched on to confirm notifications should be appearing. I have tried logging in on 4 different computers and i'm getting the same on all of them. Very frustrating as i rely on the bleep to alert me when a trade has triggered or closed.
Appreciate any input
regards
AJ
Hi @AJTT101,
You can customise your price and dealing alerts on My IG > Settings > Price and dealing alert:
I hope that it helps
All the best - Arvin -
Despite the Fed’s commitment to sharply accelerate its removal of accommodation, the S&P 500 earned a 6.1 percent weekly charge and one of the best four-day stretch of gains in decades.

Source: BloombergRisk appetite musters an impressive rally despite headwinds
The past decade has shown that us that market sentiment is hardy. In the face of trade wars, economic throttling and even an ongoing pandemic; markets have consistently reverted back to a ‘risk on’ mentality. As such, perhaps it isn’t that surprising that US indices and other sentiment benchmarks charged higher this past week despite the third week of Russia’s assault on Ukraine while the Federal Reserve stated clearly its intentions to drain excess liquidity from the market in a bid to fight rampant inflation. It would certainly be ‘convenient’ for bullish interests to prevail in this traditionally long-only asset class, but the financial backdrop is not nearly as inspiring of conviction as it once was. There are serious issues with forecasts for economic expansion, market returns that are falling behind rising costs and a very public removal of the ‘central bank put’.
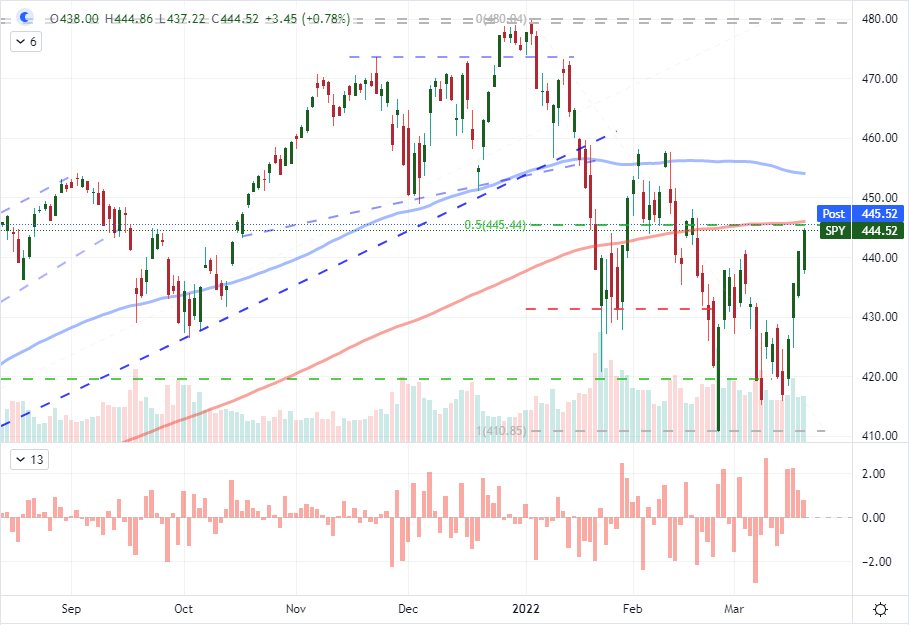
There isn’t a definitive, singularly important and scheduled event that can set the tone in the week ahead, but there is plenty for traders and investors to chew on. While the incoming feed of market motivators is important to watch, I am worried first and foremost about collective sentiment. For the S&P 500, we will enter the new week with a meaningful technical milestone that can provide a further lift if broken or exact pressure for a reversal. The midpoint of 2022’s range and the 200-day moving average happen to align at 4,470 on the index and 445 on the SPDR ETF.
Chart of SPY S&P 500 ETF with 100-day mov avg with 3-day rate of change (daily)
 Source: TradingView
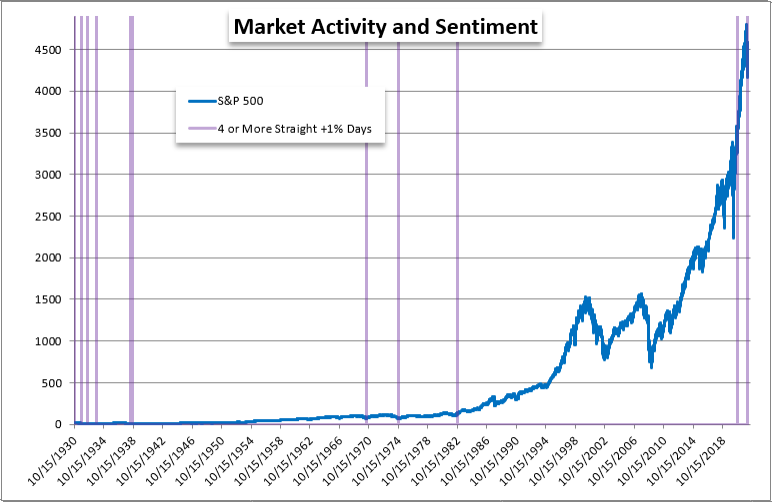
While my analysis is frequently tailored to the next 24 to 48 hours of trade, it worth considering a bigger picture as equity indices and other central assets determine their next phase. In the context of the first quarter of the year, we have seen a sizable bounce in a larger bearish shift – itself a move that is attempting to change tack on the post pandemic bull trend. Though the rebound has been relatively short lived thus far, it was nevertheless an impressive charge. In fact, in each of the four days through Friday, the S&P 500 managed to print a one percent or greater gain on each of the green candles. We haven’t seen such an impressive bullish consistence since early November 2020 after the US Presidential election (which saw a seven-day climb of that magnitude). Before that, we hadn’t see that kind of move since 1982; and there were only a handful of these instances going back to 1930. In short, last week offered an unmistakably bullish performance; but that does not guarantee a long-standing trend.
Poll: where will S&P 500 end the week
Poll from twitter.com, @JohnKicklighterThe two major themes to keep tabs on
As we move into the new trading week, the top two themes that we have been tracking through March will remain my principal concerns for volatility – whether it express in bullish or bearish movement. The situation in Ukraine remains ultimately unpredictable given that Russia has yet to take efforts to broker a ceasefire seriously. Through this past week, the meeting between US President Biden and Chinese President Xi failed to produce a definitive commitment from the world’s second largest economy to back away from supporting the militaristic aggressor.
I’ll keep a wary eye on the headlines to see if peace suddenly breaks out to support a relief rally or if the cumulative sanctions bites into global economic potential to the detriment of risk trends. Otherwise, monetary policy will be the more predictable matter. We are leaving behind a week of rate hikes – by the Fed, Bank of England, Brazilian Central Bank – but there has been noticeably little gain in local currencies or the implications of risk aversion. That is genuinely a surprise, but can we expect another lasting disconnect from central bank warnings as balance sheets legitimately shrink? I think it can last for ‘longer than I think rational’, but it will eventually anchor markets.
Chart of relative monetary policy of the major central banks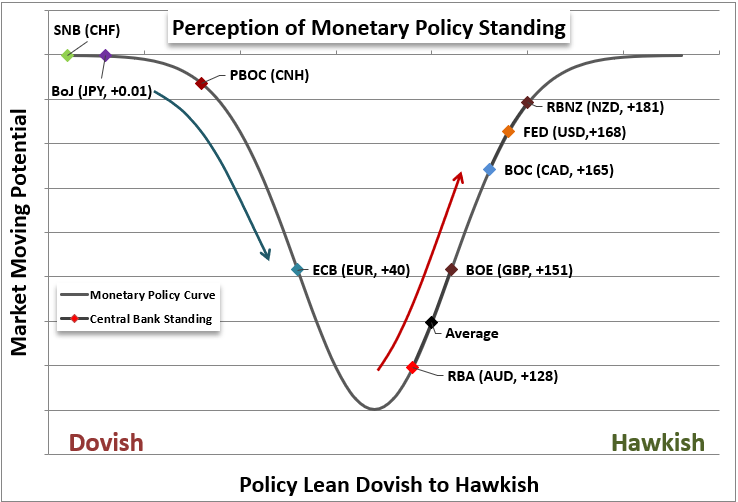
Chart created by John KicklighterSpeaking of monetary policy, the Federal Reserve’s turn at the podium this past week was the most aggressive take overall. While it wasn’t a 100 basis point move like its Brazilian counterpart, the US authority has vastly more influence over the global markets. A 25 basis point hike and an official forecast projecting a hike at each of the next six meetings this year (next is scheduled for May 4th) is very hawkish even in historical terms. Furthermore, the rhetoric around stimulus withdrawal is turning even the doves into raptors.
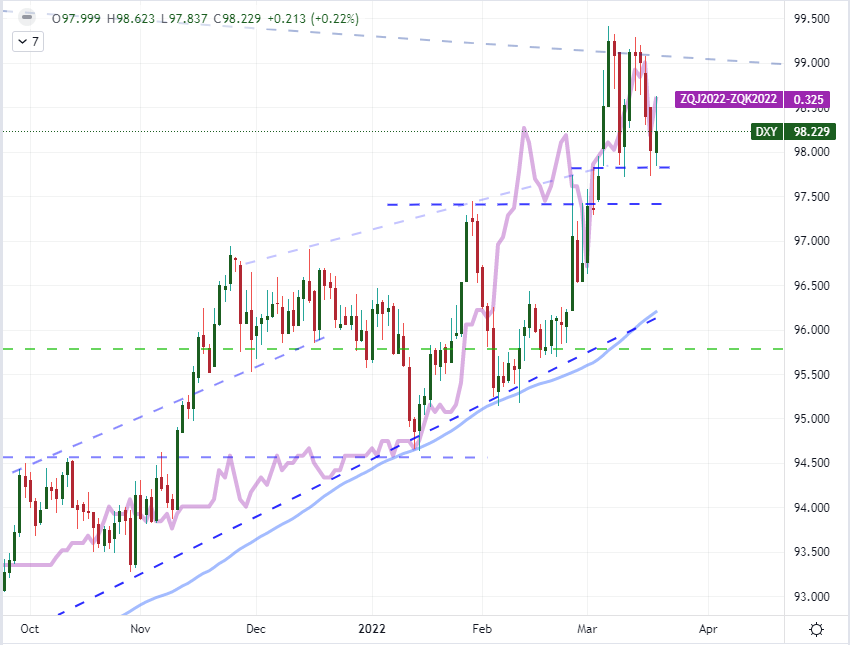
On Friday this past week, one of the most dovish members of the Federal Reserve – Minneapolis Fed President Neel Kashkari – said he supported a much faster reduction of the balance sheet (called quantitative tightening). That will raise long-term rates with previous Fed Chairman Ben Bernanke equating every $150-200 billion in stimulus to a 25 basis point rate hike. The balance sheet has grown from approximately $1 trillion to nearly $9 trillion from 2008 to present. With this ahead, I find it remarkable that the Dollar hasn’t at least pushed a new multi-year high. Yet, with other central banks seen as turning more hawkish, it acts to water down the Greenback’s appeal…but for how long?
Chart of DXY dollar index with 100-day SMA overlaid with implied may Fed rate hike (daily)
 Source: TradingView
The other event risk and markets to watch
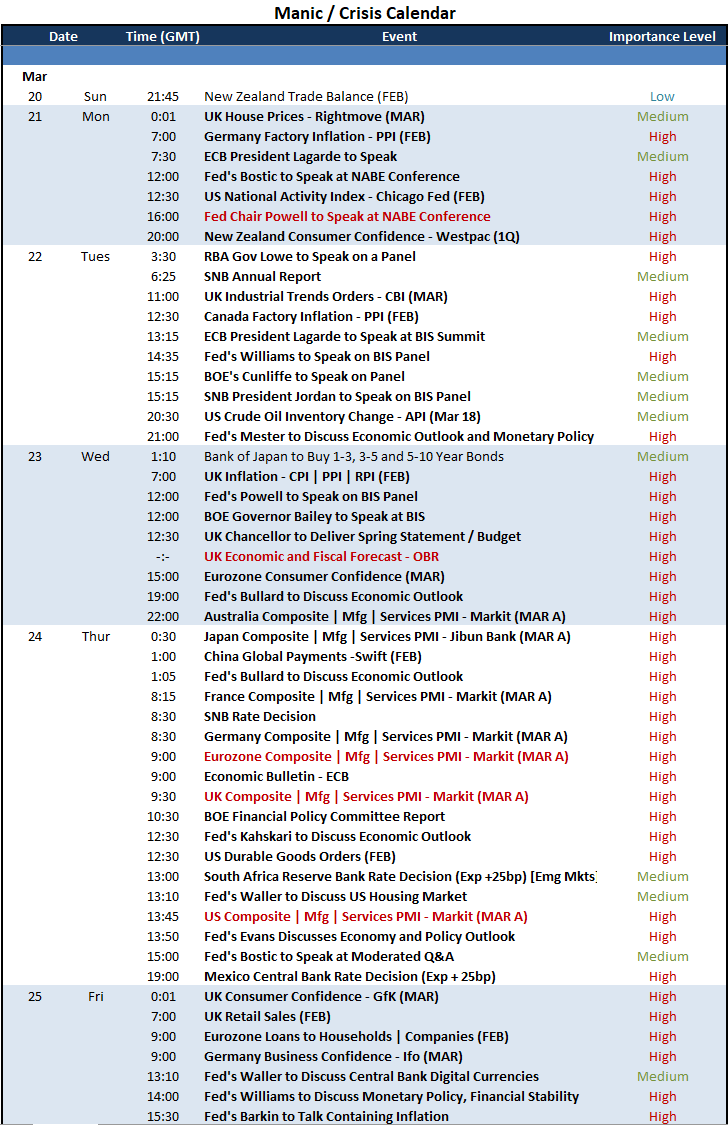
Outside of the dominant fundamental and speculative tracks, there is plenty to watch over the coming week. While we may not have a FOMC rate decision, there is plenty on the monetary policy front that is worthy of analysis. For data points, you have updates like the UK inflation data on Wednesday. However, I am paying closer attention to the many central bank speeches scheduled throughout the week. The Fed has the greatest representation among speakers through the five-day span with a virtual parade of speakers spanning both the hawkish to dovish ends of the scale. Fed Chair Powell will start it off on Wednesday with a speech at an NABE conference and will speak again later in the week. Heads of the ECB, BOE, SNB and RBA are all due to offer their views throughout the week. Speaking of the UK, I will also take in the Chancellor of the Exchequer’s spring address with updated growth forecasts from the OBR. Another data-led theme to watch will be the release of the March PMIs for the major developed world economies. These are key proxies for official GDP for a period (March) that has been exposed to tumult.
Calendar of major economic events
Calendar created by John KicklighterAmong the many markets to watch over the coming week, I am most interested in the highly risk sensitive assets. The S&P 500 at the midpoint of its 2022 bear trend is just one of these key measures. The Yen crosses present another vary interesting mix. These pairs benefit risk appetite trends, growing interest rate differentials and high commodity prices. All three have been a factor in the charge we have seen through the past week, but we have seen raw material inflation slow, and I am dubious of the continued charge in sentiment. Of these three influences, if risk aversion kicks in, it would likely override the market and pull markets down.
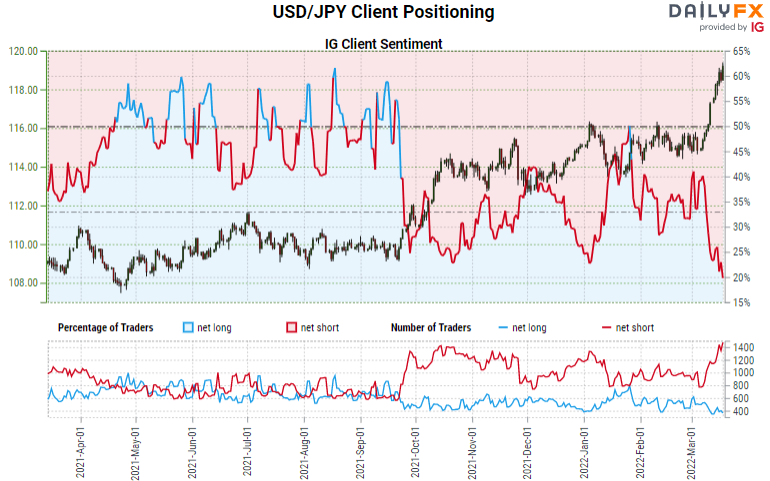
That said, I have a lower risk tolerance and will look for confirmation in technical, fundamental and market conditions terms rather than try to pick tops. Among the crosses, I like GBPJPY, CADJPY, AUDJPY and others. However, USDJPY remains the most remarkable in technical terms and retail speculation has been particularly remarkable. Looking at client positioning at IG, 80 percent of those with an exposure to the major pair has a short on. This is a contrarian reading at extremes, but retail traders aren’t always wrong.
 Source: TradingView
Follow John Kicklighter on Twitter @JohnKicklighter
This information has been prepared by DailyFX, the partner site of IG offering leading forex news and analysis. This information Advice given in this article is general in nature and is not intended to influence any person’s decisions about investing or financial products.
The material on this page does not contain a record of IG’s trading prices, or an offer of, or solicitation for, a transaction in any financial instrument. IG accepts no responsibility for any use that may be made of these comments and for any consequences that result. No representation or warranty is given as to the accuracy or completeness of this information. Consequently, any person acting on it does so entirely at their own risk.
John Kicklighter | Analyst, DailyFX, New York City
21 March 2022 -
36 minutes ago, RBR said:
Can I buy shares and sell them one hour later?
Hi RBR,
You can sell your share as soon as you buy them, once the buy is complete you will see them appear in the positions tab.
All the best - Arvin
-
1
-
-
3 hours ago, lide54 said:
How many trades per month do I have to execute in order to get the rebate. ASX Trading acc
Hi @lide54,
You will need to trade at least 3 times in the previous month :
If you trade 3 times or month in the quarter the Subscription fee will also be waived, more info here.
I hope that it helps.
All the best - Arvin -
On 20/03/2022 at 04:27, AbdulS said:
I have been demoing on IG Demo account for a while and have just created a Live account. My Demo account has couple of watch list that I would like to transfer to my Live account to avoid spending time/effort and keeping it all in one account.
Is this possible?
Appreciate your response.
Thanks
Hi @AbdulS,
Thank you for your post.
Unfortunately you will have to recreate the Watchlists as the Demo server is running on a different server as the live account servers.
All the best - Arvin -
On 19/03/2022 at 06:51, Markymarky said:
How do I open a Sipp on this platform?
Hi @Markymarky,
Regretfully, we’re currently not able to take on any new SIPP applications. We hope to offer new SIPP accounts soon and are working on contracting with a new provider.
All the best - Arvin -
On 19/03/2022 at 04:36, fomafoma said:
Hi Folks,
I'm getting an unusual error where I can't transfer between accounts.

Hi @fomafoma,
Please reach out to helpdesk.uk@ig.com our team will be able to investigate and assist you further.
Please ensure that the funds you are trying to transfer are settled.
All the best - Arvin -
20 hours ago, Marcipops said:
I am using Lightstreamer to stream tick data: https://labs.ig.com/streaming-api-reference
There is an issue when receiving ticks through midnight as you can see from this data extract below.
UPDATE_TIME Publish time of last price update (UK local time, i.e. GMT or BST) BID Bid price OFFER Offer price 23:59:40 7317.9 7321.9 23:59:41 7317.7 7321.7 23:59:42 7317.4 7321.4 23:59:48 7317.1 7321.1 23:59:52 7317.4 7321.4 23:59:59 7317.2 7321.2 23:59:59 7317.1 7321.1 23:59:59 7317.2 7321.2 00:00:00 7317.1 7321.1 00:00:00 7316.7 7320.7 00:00:01 7317.2 7321.2 00:00:01 7317.1 7321.1 00:00:01 7317.2 7321.2 00:00:01 7317.1 7321.1 For each tick, I am recording the date of each tick from my local clock, so I can know the exact date time of the tick.
The data marked in amber is being labelled by my program as belonging to the same date as the data in black, when it should be labelling it belonging to the next day. From this, it seems that like my local clock is a couple of seconds behind the ig clock.
For example tick data received with UPDATE_TIME = 00:00 is for the next day, but is being recorded as the same day by my program using current date from local clock.
I was therefore looking on labs.ig.com for a way of obtaining the date of the tick message, so I could record the ig date of the tick against its time. But that approach would have a problem if the date changes after fetching the date and before collecting the tick.
Presume the opposite is also true, someone's local computer clock might be ahead of ig. Therefore with the extract above, incorrectly labelling the tick received at UPDATE_TIME = 23:59:40 with the date of the next day.
This could be completely resolved of course if the tick data had date as well as time.
Is there a workaround?
Many thanks
Hi @Marcipops,
Feel free to reach out to webapisupport@ig.com for API support.
All the best - Arvin -
2 hours ago, MITH said:
Hi
Australia 200 market closing time it was shown 7295 but your settlement price shows 7307. Why this much differentHi @MITH,
It is possible that your position was closed manually by the dealing desk. Please reach out to heldpesk@ig.com.sg for further investigation.
All the best - Arvin


Unable to login to IG US
in IG Account Support - MyIG Help
Posted
Hi @sahilkansagara,
Could you please confirm if you have been able to access your account? We tried to login on our dummy US account and there was no issue.
Thank you - Arvin