

ArvinIG
-
Posts
1,728 -
Joined
-
Last visited
-
Days Won
23
Content Type
Profiles
Forums
Blogs
Events
Community Tutorials
Store
Posts posted by ArvinIG
-
-
5 hours ago, FishMilan said:
Hi,
I don't have access to ProReal Time.
However it doesn't make sense that if the you or I am trading US stocks then we need to know the US time on the charts. I think it would be an easy improvement to your out of box charts.
David
Hi @FishMilan,
If you are referring to the time zone of your account and the time displayed on the chart:
You won't be able to change the time zone unless you open an account with another office that AUS.
I will forward your feedback to the development team to add a feature to change the time zone, with US time for US stock, UK time for UK stocks for example.
All the best - Arvin -
Main talking points:
- What is a Forex Trading Strategy?
- Forex Strategies: A Top-level Overview
- Price Action Trading
- Range Trading Strategy
- Trend Trading Strategy
- Position Trading
- Day Trading Strategy
- Forex Scalping Strategy
- Swing Trading
- Carry Trade Strategy
Discover what type of forex trader is buried within your DNA with our interactive DNA FX Quiz
WHAT IS A FOREX TRADING STRATEGY?
A forex trading strategy defines a system that a forex trader uses to determine when to buy or sell a currency pair. There are various forex strategies that traders can use including technical analysis or fundamental analysis. A good forex trading strategy allows for a trader to analyse the market and confidently execute trades with sound risk management techniques.
FOREX STRATEGIES: A TOP-LEVEL OVERVIEW
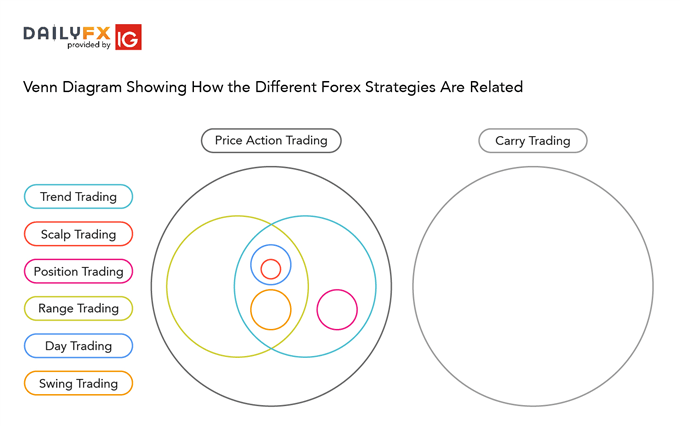
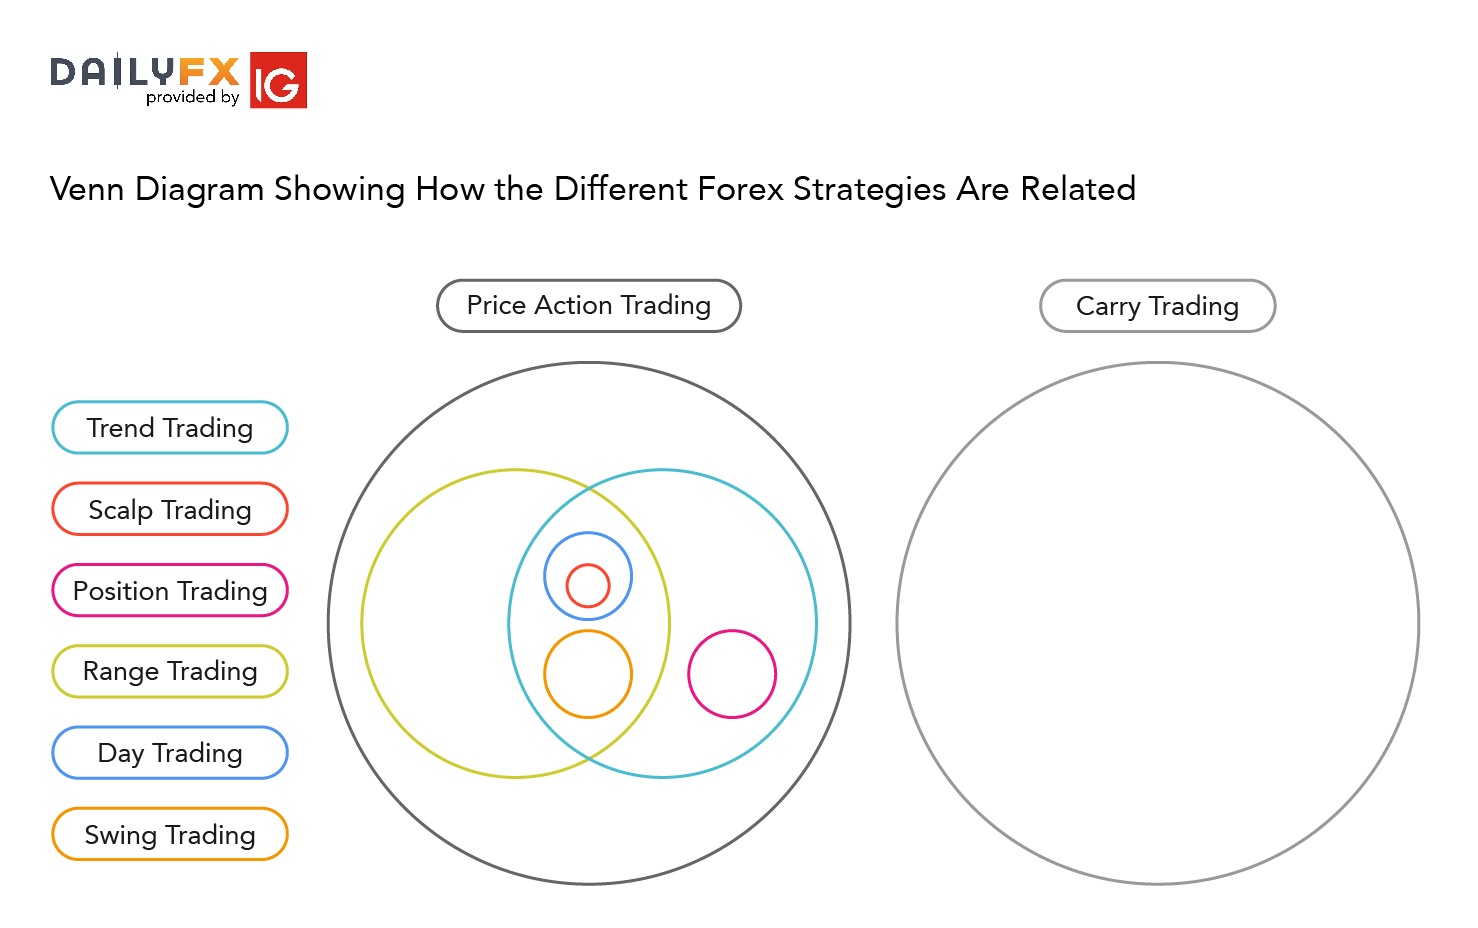
Forex strategies can be divided into a distinct organisational structure which can assist traders in locating the most applicable strategy. The diagram below illustrates how each strategy falls into the overall structure and the relationship between the forex strategies.
FOREX TRADING STRATEGIES THAT WORK
Forex trading requires putting together multiple factors to formulate a trading strategy that works for you. There are countless strategies that can be followed, however, understanding and being comfortable with the strategy is essential. Every trader has unique goals and resources, which must be taken into consideration when selecting the suitable strategy.
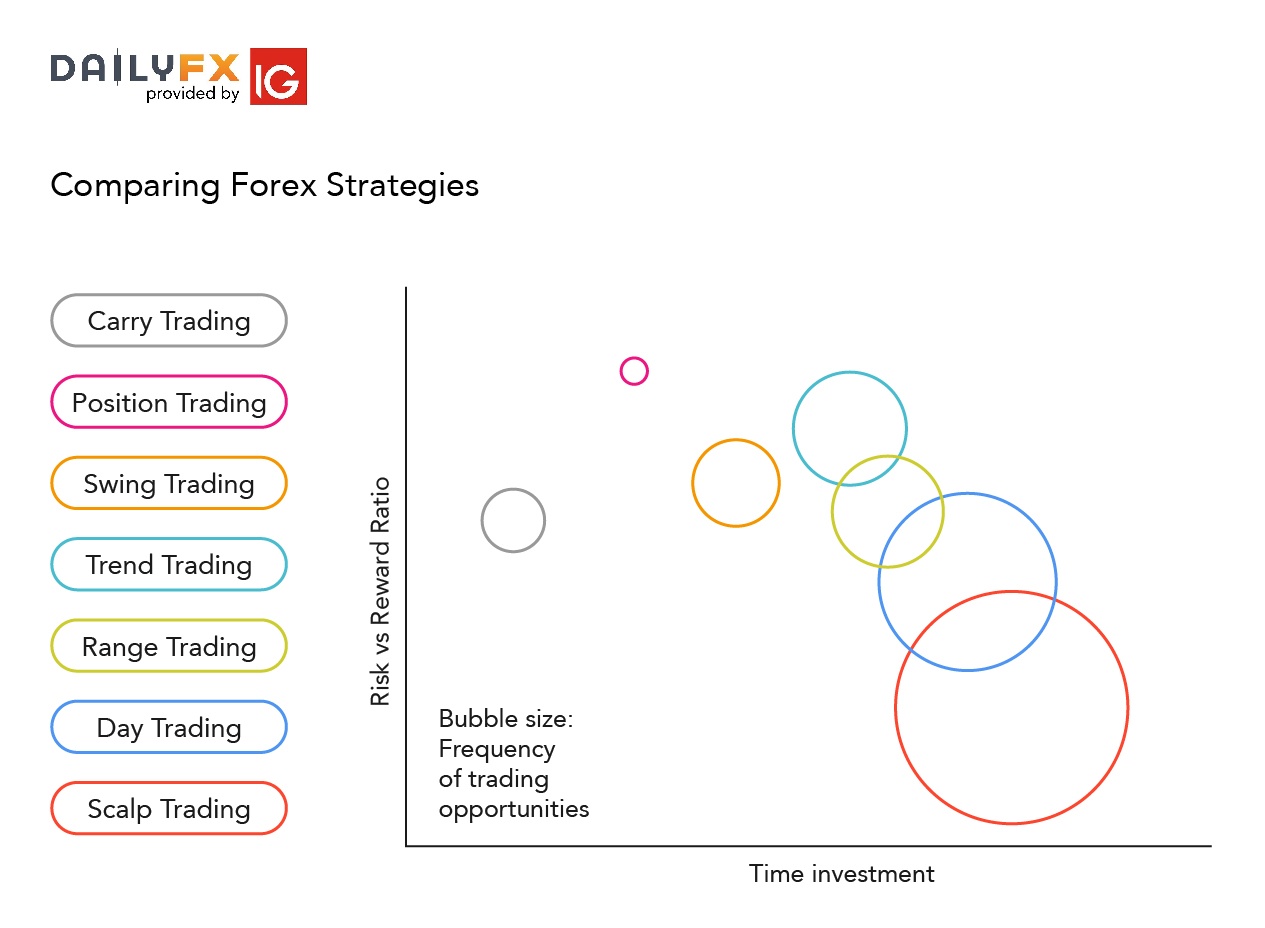
There are three criteria traders can use to compare different strategies on their suitability:
- Time resource required
- Frequency of trading opportunities
- Typical distance to target
To easily compare the forex strategies on the three criteria, we've laid them out in a bubble chart. On the vertical axis is ‘Risk-Reward Ratio’ with strategies at the top of the graph having higher reward for the risk taken on each trade. Position trading typically is the strategy with the highest risk reward ratio. On the horizontal axis is time investment that represents how much time is required to actively monitor the trades. The strategy that demands the most in terms of your time resource is scalp trading due to the high frequency of trades being placed on a regular basis.

1. PRICE ACTION TRADING
Price action trading involves the study of historical prices to formulate technical trading strategies. Price action can be used as a stand-alone technique or in conjunction with an indicator. Fundamentals are seldom used; however, it is not unheard of to incorporate economic events as a substantiating factor. There are several other strategies that fall within the price action bracket as outlined above.
Length of trade:
Price action trading can be utilised over varying time periods (long, medium and short-term). The ability to use multiple time frames for analysis makes price action trading valued by many traders.
Entry/Exit points:
There are many methods to determine support/resistance levels which are generally used as entry/exit points:
Within price action, there is range, trend, day, scalping, swing and position trading. These strategies adhere to different forms of trading requirements which will be outlined in detail below. The examples show varying techniques to trade these strategies to show just how diverse trading can be, along with a variety of bespoke options for traders to choose from.
2. RANGE TRADING STRATEGY
Range trading includes identifying support and resistance points whereby traders will place trades around these key levels. This strategy works well in market without significant volatility and no discernible trend. Technical analysis is the primary tool used with this strategy.
Length of trade:
There is no set length per trade as range bound strategies can work for any time frame. Managing risk is an integral part of this method as breakouts can occur. Consequently, a range trader would like to close any current range bound positions.
Entry/Exit points:
Oscillators are most commonly used as timing tools. Relative Strength Index (RSI), Commodity Channel Index (CCI) and stochastics are a few of the more popular oscillators. Price action is sometimes used in conjunction with oscillators to further validate range bound signals or breakouts.
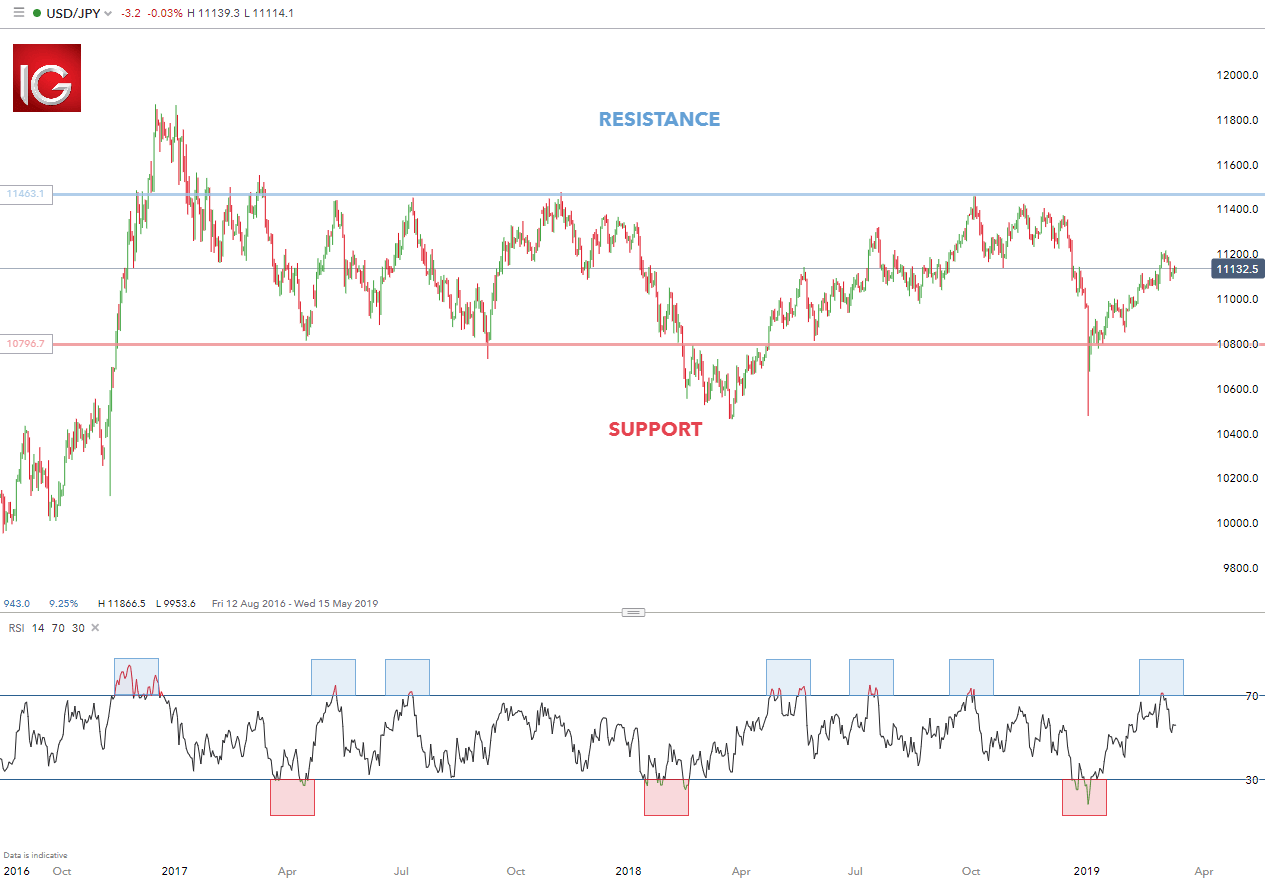
Example 1: USD/JPY Range Trading

USD/JPY has been exhibiting a prolonged range bound price level over the past few years. The chart above illustrates a clear support and resistance band which traders use as entry/exit points. The RSI oscillator demonstrates timing of entry/exit points as highlighted by the shaded blue and red boxes – blue: overbought and red: oversold.
Range trading can result in fruitful risk-reward ratios however, this comes along with lengthy time investment per trade. Use the pros and cons below to align your goals as a trader and how much resources you have.
Pros:
- Substantial number of trading opportunities
- Favourable risk-to reward ratio
Cons:
- Requires lengthy periods of time investment
- Entails strong appreciation of technical analysis
3. TREND TRADING STRATEGY
Trend trading is a simple forex strategy used by many traders of all experience levels. Trend trading attempts to yield positive returns by exploiting a markets directional momentum.
Length of trade:
Trend trading generally takes place over the medium to long-term time horizon as trends themselves fluctuate in length. As with price action, multiple time frame analysis can be adopted in trend trading.
Entry/Exit points:
Entry points are usually designated by an oscillator (RSI, CCI etc) and exit points are calculated based on a positive risk-reward ratio. Using stop level distances, traders can either equal that distance or exceed it to maintain a positive risk-reward ratio e.g. If the stop level was placed 50 pips away, the take profit level wold be set at 50 pips or more away from the entry point.
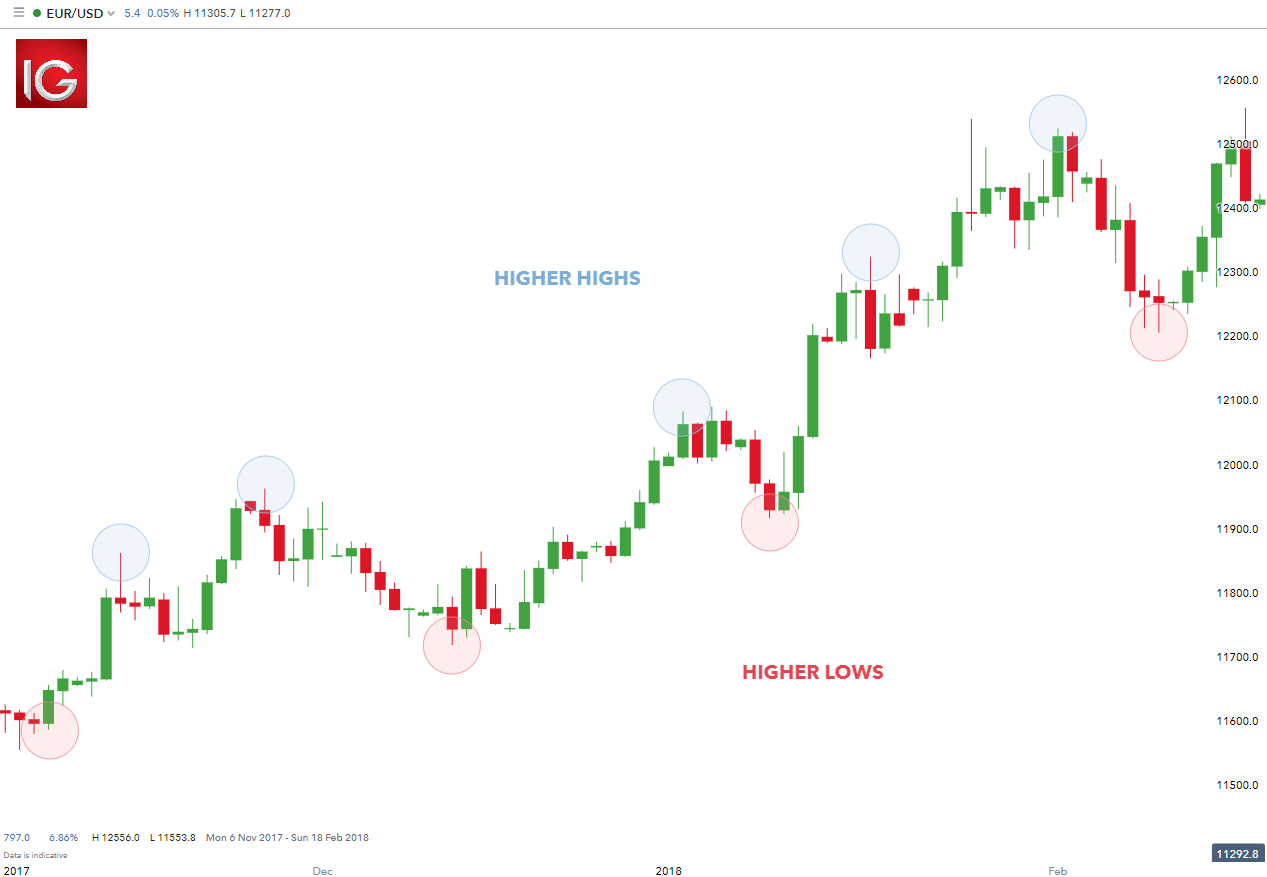
Example 2: Identifying the Trend
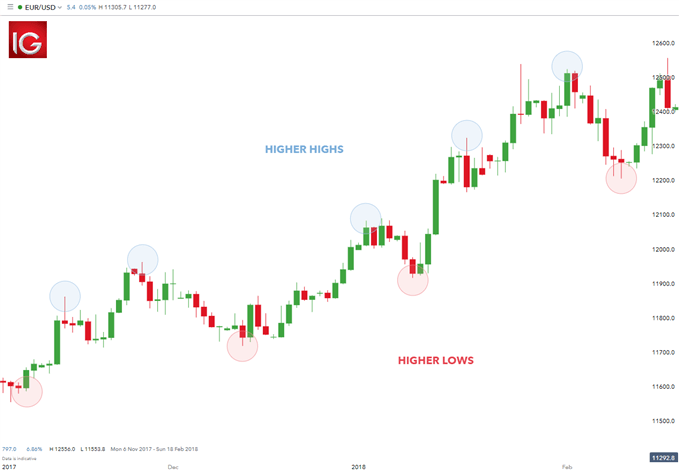
In the simple example above, EUR/USD exhibits an upward trend validated by higher highs and higher lows. The opposite would be true for a downward trend.
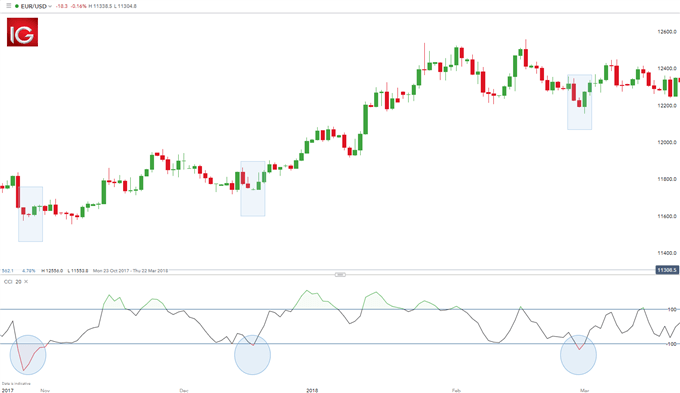
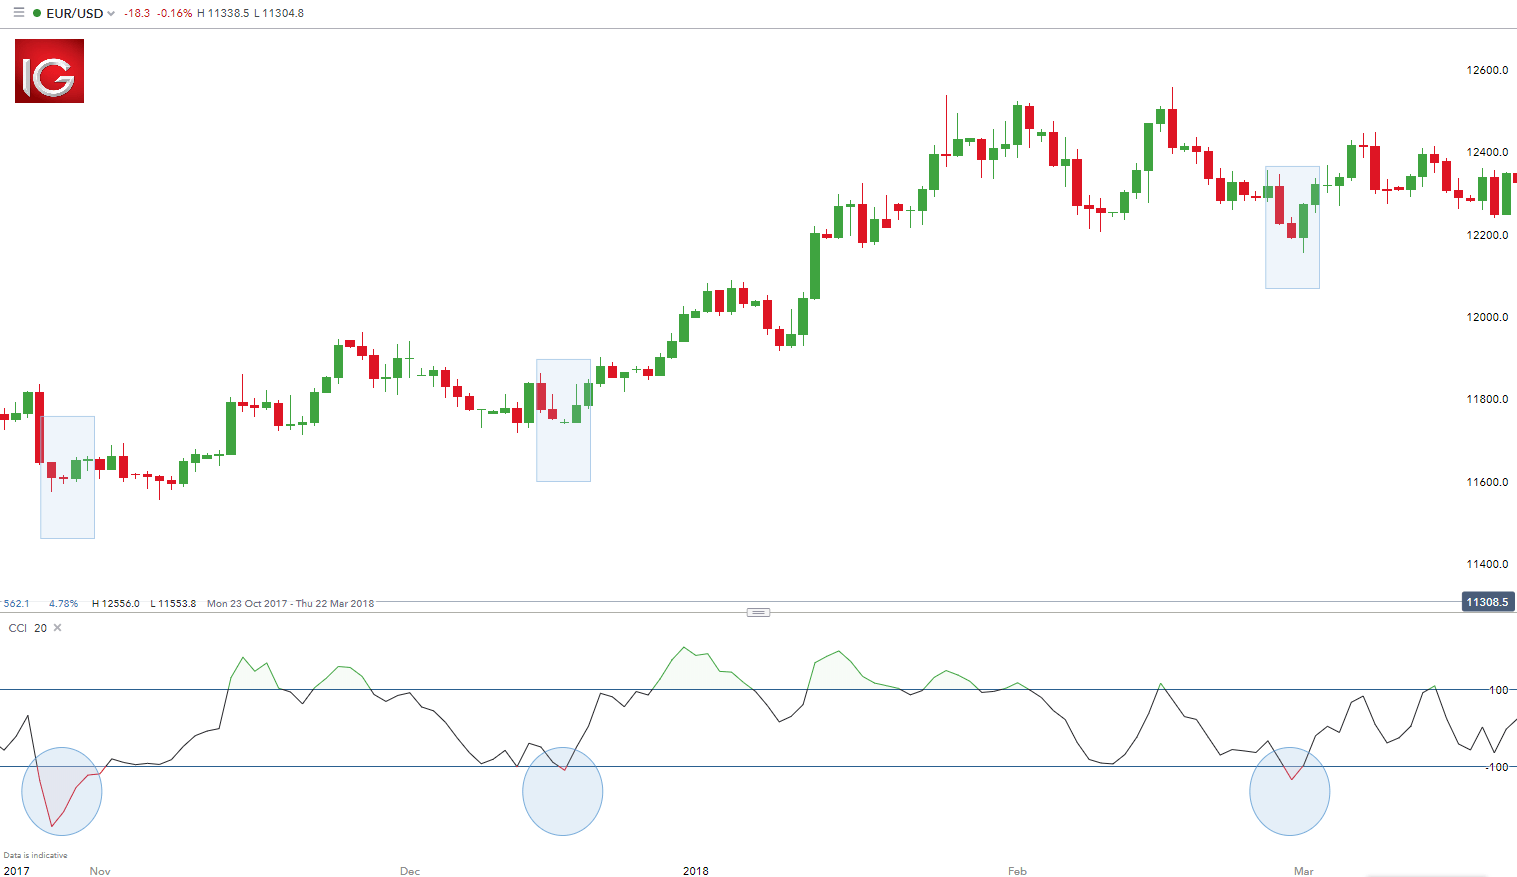
EUR/USD Trading the Trend
When you see a strong trend in the market, trade it in the direction of the trend. For example, the strong uptrend in EUR/USD above.
Using the (CCI) as a tool to time entries, notice how each time CCI dipped below -100 (highlighted in blue), prices responded with a rally. Not all trades will work out this way, but because the trend is being followed, each dip caused more buyers to come into the market and push prices higher. In conclusion, identifying a strong trend is important for a fruitful trend trading strategy.
Trend trading can be reasonably labour intensive with many variables to consider. The list of pros and cons may assist you in identifying if trend trading is for you.
Pros:
- Substantial number of trading opportunities
- Favourable risk-to reward ratio
Cons:
- Requires lengthy periods of time investment
- Entails strong appreciation of technical analysis
4. POSITION TRADING
Position trading is a long-term strategy primarily focused on fundamental factors however, technical methods can be used such as Elliot Wave Theory. Smaller more minor market fluctuations are not considered in this strategy as they do not affect the broader market picture. This strategy can be employed on all markets from stocks to forex.
Length of trade:
As mentioned above, position trades have a long-term outlook (weeks, months or even years!) reserved for the more persevering trader. Understanding how economic factors affect markets or thorough technical predispositions, is essential in forecasting trade ideas.
Entry/Exit points:
Key levels on longer time frame charts (weekly/monthly) hold valuable information for position traders due to the comprehensive view of the market. Entry and exit points can be judged using technical analysis as per the other strategies.
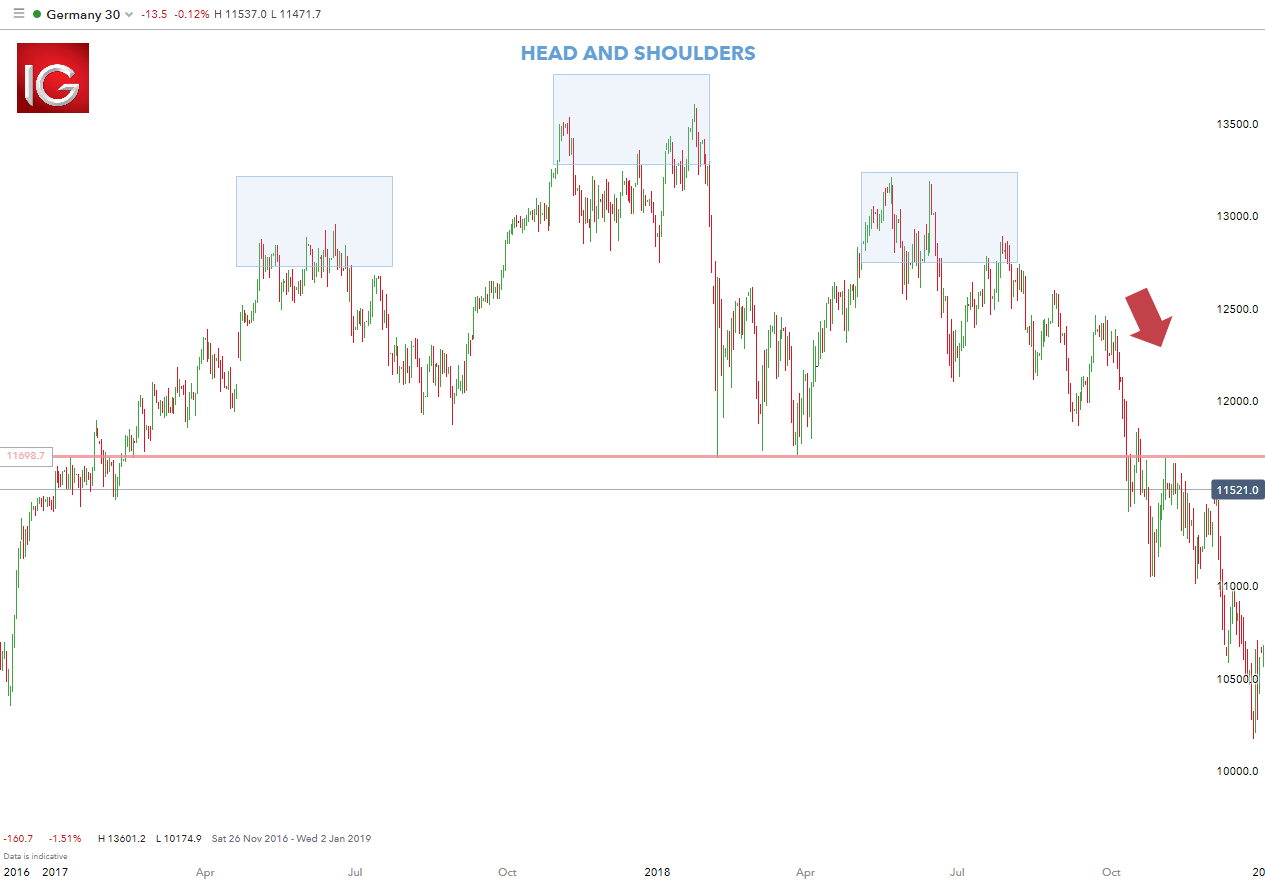
Example 3: Germany 30 (DAX) Position Trading
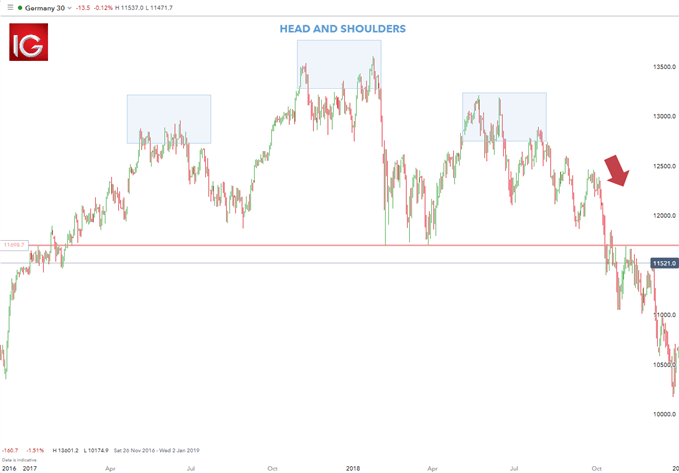
The Germany 30 chart above depicts an approximate two year head and shoulders pattern, which aligns with a probable fall below the neckline (horizontal red line) subsequent to the right-hand shoulder. In this selected example, the downward fall of the Germany 30 played out as planned technically as well as fundamentally. Towards the end of 2018, Germany went through a technical recession along with the US/China trade war hurting the automotive industry. Brexit negotiations did not help matters as the possibility of the UK leaving the EU would most likely negatively impact the German economy as well. In this case, understanding technical patterns as well as having strong fundamental foundations allowed for combining technical and fundamental analysis to structure a strong trade idea.
List of Pros and Cons based on your goals as a trader and how much resources you have.
Pros:
- Requires minimal time investment
- Highly positive risk-to reward ratio
Cons:
- Very few trading opportunities
- Entails strong appreciation of technical and fundamental analysis
5. DAY TRADING STRATEGY
Day trading is a strategy designed to trade financial instruments within the same trading day. That is, all positions are closed before market close. This can be a single trade or multiple trades throughout the day.
Length of trade:
Trade times range from very short-term (matter of minutes) or short-term (hours), as long as the trade is opened and closed within the trading day.
Entry/Exit points:
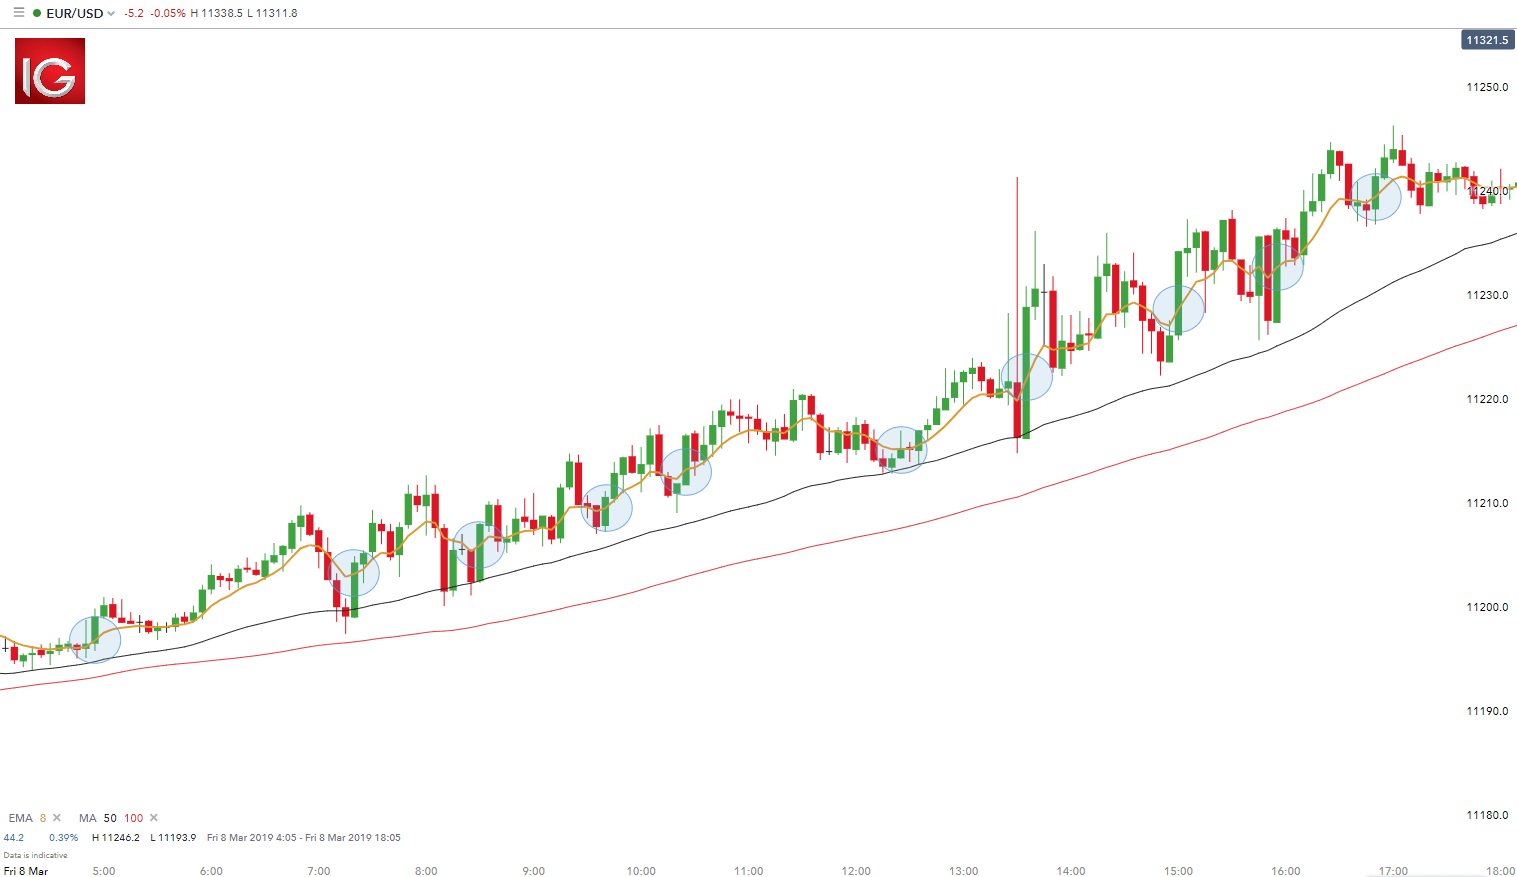
Traders in the example below will look to enter positions at the when the price breaks through the 8 period EMA in the direction of the trend (blue circle) and exit using a 1:1 risk-reward ratio.
Example 4: EUR/USD Day Trading
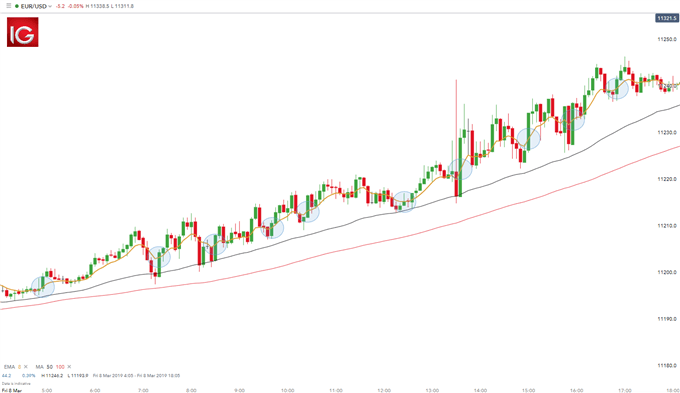
The chart above shows a representative day trading setup using moving averages to identify the trend which is long in this case as the price is above the MA lines (red and black). Entry positions are highlighted in blue with stop levels placed at the previous price break. Take profit levels will equate to the stop distance in the direction of the trend.
The pros and cons listed below should be considered before pursuing this strategy. Day trading involves much time and effort for little reward, as seen from the EUR/USD example above.
Pros:
- Substantial number of trading opportunities
- Median risk-to reward ratio
Cons:
- Requires lengthy periods of time investment
- Entails strong appreciation of technical analysis
6. FOREX SCALPING STRATEGY
Scalping in forex is a common term used to describe the process of taking small profits on a frequent basis. This is achieved by opening and closing multiple positions throughout the day. This can be done manually or via an algorithm which uses predefined guidelines as to when/where to enter and exit positions. The most liquid forex pairs are preferred as spreads are generally tighter, making the short-term nature of the strategy fitting.
Length of trade:
Scalping entails short-term trades with minimal return, usually operating on smaller time frame charts (30 min – 1min).
Entry/Exit points:
Like most technical strategies, identifying the trend is step 1. Many scalpers use indicators such as the moving average to verify the trend. Using these key levels of the trend on longer time frames allows the trader to see the bigger picture. These levels will create support and resistance bands. Scalping within this band can then be attempted on smaller time frames using oscillators such as the RSI. Stops are placed a few pips away to avoid large movements against the trade. The MACD indicator is another useful tool that can be exercised by the trader to enter/exit trades.
Example 5: EUR/USD Scalping Strategy
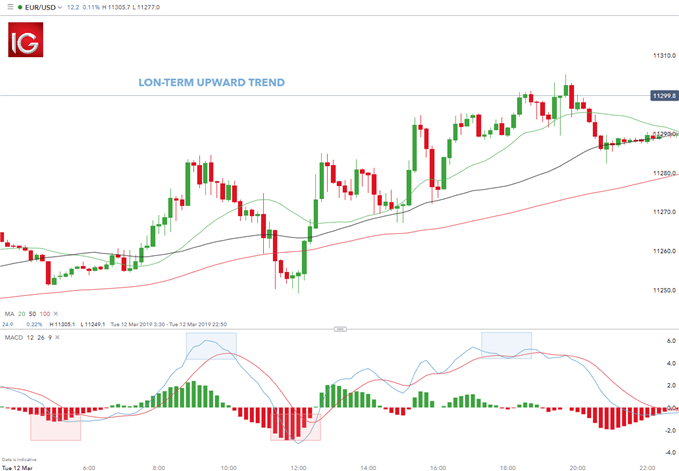
The EUR/USD 10 minute above shows a typical example of a scalping strategy. The long-term trend is confirmed by the moving average (price above 200 MA). The smaller time frame is then used to target entry/exit points. Timing of entry points are featured by the red rectangle in the bias of the trader (long). Traders can also close long positions using the MACD when the MACD (blue line) crosses over the signal line (red line) highlighted by the blue rectangles.
Traders use the same theory to set up their algorithms however, without the manual execution of the trader.
With this practical scalp trading example above, use the list of pros and cons below to select an appropriate trading strategy that best suits you.
Pros:
- Greatest number of trading opportunities from all forex strategies
Cons:
- Requires lengthy periods of time investment
- Entails strong appreciation of technical analysis
- Lowest risk-to reward ratio
7. SWING TRADING
Swing trading is a speculative strategy whereby traders look to take advantage of rang bound as well as trending markets. By picking ‘tops’ and ‘bottoms’, traders can enter long and short positions accordingly.
Length of trade:
Swing trades are considered medium-term as positions are generally held anywhere between a few hours to a few days. Longer-term trends are favoured as traders can capitalise on the trend at multiple points along the trend.
Entry/Exit points:
Much like the range bound strategy, oscillators and indicators can be used to select optimal entry/exit positions and times. The only difference being that swing trading applies to both trending and range bound markets.
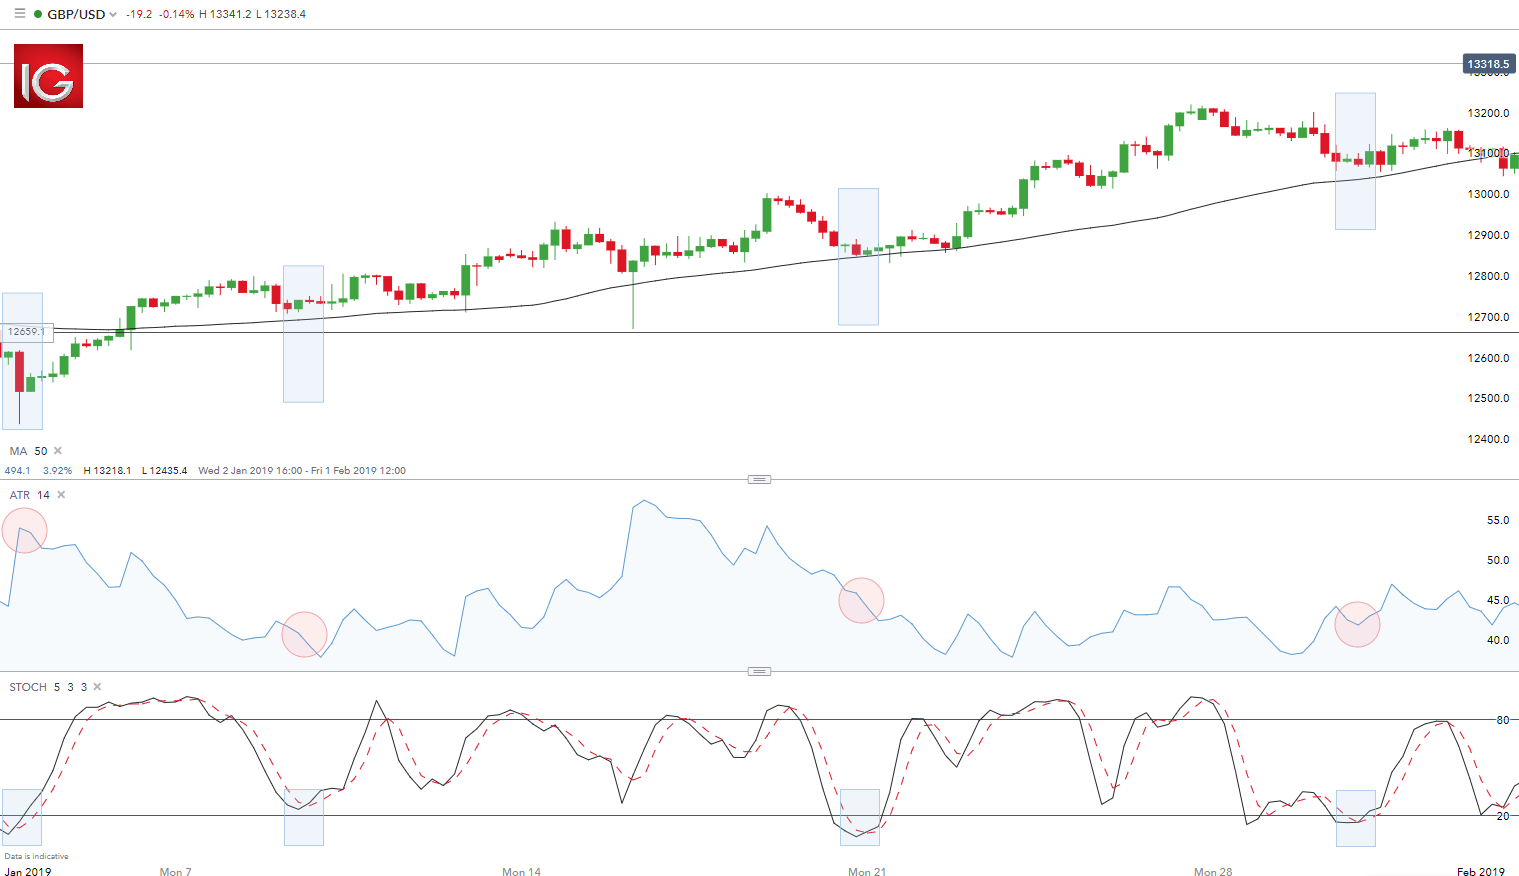
Example 6: GBP/USD Swing Trading Strategy
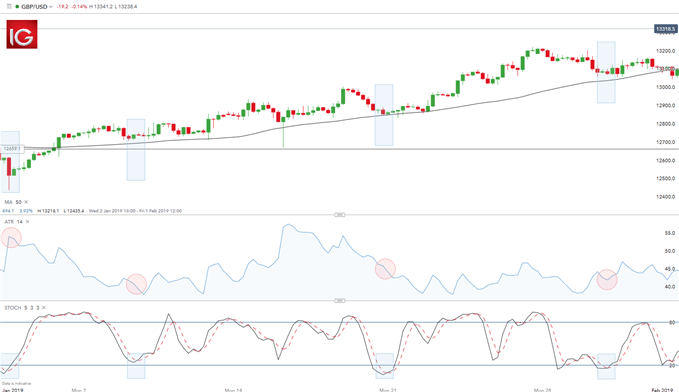
A combination of the stochastic oscillator, ATR indicator and the moving average was used in the example above to illustrate a typical swing trading strategy. The upward trend was initially identified using the 50-day moving average (price above MA line). In the case of an uptrend, traders will look to enter long positions with the old adage of ‘buy low, sell high’.
Stochastics are then used to identify entry points by looking for oversold signals highlighted by the blue rectangles on the stochastic and chart. Risk management is the final step whereby the ATR gives an indication of stop levels. The ATR figure is highlighted by the red circles. This figure represents the approximate number of pips away the stop level should be set. For example, if the ATR reads 41.8 (reflected in the last ATR reading) the trader would look to place the stop 41.8 pips away from entry. At DailyFX, we recommend trading with a positive risk-reward ratio at a minimum of 1:2. This would mean setting a take profit level (limit) at least 83.6 (41.8 x 2) pips away or further.
After seeing an example of swing trading in action, consider the following list of pros and cons to determine if this strategy would suit your trading style.
Pros:
- Substantial number of trading opportunities
- Median risk-to reward ratio
Cons:
- Entails strong appreciation of technical analysis
- Still requires extensive time investment
8. CARRY TRADE STRATEGY
Carry trades include borrowing one currency at lower rate, followed by investing in another currency at a higher yielding rate. This will ultimately result in a positive carry of the trade. This strategy is primarily used in the forex market.
Length of trade:
Carry trades are dependent on interest rate fluctuations between the associated currencies therefore, length of trade supports the medium to long-term (weeks, months and possibly years).
Entry/Exit points:
Strong trending markets work best for carry trades as the strategy involves a lengthier time horizon. Confirmation of the trend should be the first step prior to placing the trade (higher highs and higher lows and vice versa) – refer to Example 1 above. There are two aspects to a carry trade namely, exchange rate risk and interest rate risk. Accordingly, the best time to open the positions is at the start of a trend to capitalise fully on the exchange rate fluctuation. Regarding the interest rate component, this will remain the same regardless of the trend as the trader will still receive the interest rate differential if the first named currency has a higher interest rate against the second named currency e.g. AUD/JPY.
Could carry trading work for you? Consider the following pros and cons and see if it is a forex strategy that suits your trading style.
Pros:
- Little time investment needed
- Median risk-to reward ratio
Cons:
- Entails strong appreciation of forex market
- Infrequent trading opportunities
FOREX STRATEGIES: A SUMMARY
This article outlines 8 types of forex strategies with practical trading examples. When considering a trading strategy to pursue, it can be useful to compare how much time investment is required behind the monitor, the risk-reward ratio and regularity of total trading opportunities. Each trading strategy will appeal to different traders depending on personal attributes. Matching trading personality with the appropriate strategy will ultimately allow traders to take the first step in the right direction.
ENHANCE YOUR FOREX TRADING
- If you’re new to forex trading, download our Forex for Beginners Trading guide.
- Register for free to view our live trading webinars which cover various topics related to the Forex market like central bank movements, currency news, and technical chart patterns.
- Stay up to date with major news events and economic releases by viewing our economic calendar.
- Successful trading requires sound risk management and self-discipline. Find out how much capital you should risk on your open trades.
- We also recommend viewing our Traits of Successful Traders guide to discover the secrets of successful forex traders.
DailyFX provides forex news and technical analysis on the trends that influence the global currency markets.
DISCLOSURES
Warren Venketas , Analyst, DailyFX
30 December 2021
-
 1
1
-
Bitcoin hit a record £50,000 high in November, but has fallen to under £35,000 today. And as cryptocurrency goes mainstream, it's coming under increasing regulatory pressure.

Source: BloombergCryptocurrency is a divisive topic. Unlike fiat currency, which is regulated by state governments, a central feature of crypto is that it is decentralised. This means that no one individual or organisation can determine the worth of any specific coin. That makes cryptocurrencies difficult to manipulate, but equally hard to stabilise through periods of volatility.
Some believe that the next generation of the internet will be built on cryptocurrency blockchains. Accoring to the Financial Conduct Authority, at least 2.3 million British investors own some crypto, and institutional investors hold 4% of the world’s Bitcoin supply. El Salvador has officially adopted Bitcoin as an official currency. And Mastercard and PayPal are both allowing customers to buy cryptocurrencies on their platforms.
Others think the asset class is the 21st century’s tulip bulb. The Bank of England has warned that Bitcoin could become ‘worthless’ and investors should be prepared to lose everything. Last month, the creators of a crypto named after Netflix's ‘Squid Game’ stole $3.4 million from investors in an apparent ‘rug pull’ scam. The coin is now worthless.
And it’s far from the first time investors have lost money on the unregulated asset class. Elon Musk can tweet about the latest canine coin and send it into the stratosphere. But as investors in Dogecoin found out earlier this year, it can come down just as fast.
But by investing in crypto stocks, it’s possible to enjoy some of the gains with less of the volatility. Of course, as crypto is still unregulated, these companies still comes with a high level of risk.Crypto stock: Coinbase shares
Coinbase offers a secure online platform for buying and selling hundreds of cryptocurrencies. It launched its Initial Public Offering in April at $328 per share, valuing the company at $86 billion. Rising swiftly to $342, its share price fell to $220 by 19 July. Since early November, it’s swung between $357 and $238. Right now, the US’s largest crypto exchange is worth $261 a share. But it’s unlikely to stay still for long.
Q3 2021 results presented a mixed picture for investors. Monthly transacting users fell from 8.8 million to 7.4 million, while trading volume fell from $462 billion to $327 billion quarter-over-quarter. However, a year ago it only had 2.1 million users trading $45 billion. Similarly, revenue fell from $2.03 billion to $1,24 billion quarter-over-quarter. But revenue was only $287 million in Q3 2020.
The context of these results is important. It explained that with ‘global crypto spot trading volumes declining 37% in Q3 as compared to Q2, Coinbase outperformed the market with total trading volumes of $327 billion, a 29% decline in the same period.’ Moreover, the company’s net margin was a fantastic 57% over the first three quarters of 2021.
As for the future, management has warned investors that ‘our business is volatile. Coinbase is not a quarter-to-quarter investment, but rather a long-term investment in the growth of the cryptoeconomy.’

Source: BloombergArgo Blockchain share price
Like the mythological ship that aided Jason on his quest for the golden fleece, Argo Blockchain is after a 21st-century gold alternative. Shares were worth around 3p in February 2019 but had soared to a record 282p on 19 February 2021. However, it’s fallen back into penny stock territory at 96p today.
In Q3 results, Argo called itself ‘a global leader in sustainable cryptocurrency mining and blockchain,’ generating record revenue of £19.3 million and mined 597 Bitcoins or Bitcoin equivalents. CEO Peter Wall said that ‘this quarter has been pivotal as Argo continues to scale.’ By the end of November, the Company owned 2,317 Bitcoin or Bitcoin Equivalents. Moreover, it has maintained a gross margin of 120% and an industry-leading mining margin of 85%.
In July, Argo started building its new Texas-based renewable energy-focused 200-megawatt mining facility. In September, it agreed to buy 20,000 Bitmain Antminer S19J Pro machines for the facility, which have the potential to nearly quadruple the company’s mining capacity. It also listed itself on the NASDAQ, allowing the miner to better tap into financing on both sides of the Atlantic.
The miner’s stock price is strongly tied to the value of Bitcoin. And while the world’s most well-known crypto has had a stellar year, scholars will note that Jason was eventually killed by one of the Argo’s beams, when it fell on him as he slept.
Go short and long with spread bets, CFDs and share dealing on 16,000+ shares with the UK’s No.1 platform.* Learn more about trading shares with us, or open an account to get started today.
* Best trading platform as awarded at the ADVFN International Financial Awards 2021
Charles Archer | Financial Writer, London
30 December 2021 02:12-
1
-
-
5 hours ago, Taiki said:
Hi Arvin,
Thank you for your reply.
Would it be possible to add NASL to ISA account?
It is available on T212 on their ISA so I assume you should be able to get it quite easily.
Hi @Taiki,
NASL was added to share dealing accounts. Could you please check if it is accessible on your ISA account?
Thank you - Arvin -
On 24/12/2021 at 22:01, Levo said:
Hi Arvin, thanks for the prompt response.
As I said in my original post, I have it all set up and use it for Iphone system tasks and 2 other apps. All four buttons are green as per your picture too.
I deleted the IG app and download/installed it again just in case. No change.
This is the Settings screen I get

Hi @Levo,
I forwarded your query to the iOS development team directly to come back to me with a answer.
I will let you know as soon as I have an answer.
Thank you - Arvin -
On 28/12/2021 at 03:25, eastside said:
Why is IG silently deleting my positions without informing this has happened second time this month. Own up to if you blunder your products or dont offer to customers at all.

Hi @eastside,
Thank you for your message. There was an issue with the pricing of this market: Palpably wrong priceThe issue was with the model whereby there was 0% vol. IG protects itself against such rare occurrences.
Please reach out to helpdesk.uk@ig.com or use our live chat feature for further assistance on your positions.
All the best - Arvin -
6 hours ago, koppis2 said:
I have uploaded my documents 2 days back. I have yet to hear from IG. Why this delay when it gives a timeline of 2 hours? Who can I contact for this please?
Hi @koppis2,
The best contact for your query is : newaccounts.uk@ig.com. The account opening team will be able to give you an update on your application.
All the best - Arvin -
4 hours ago, Taiki said:
Name of stock: Lyxor Nasdaq-100 UCITS ETF - Acc
Ticker: NASL
Country of the stock: UK
Thank you.
Hi @Taiki,
Thank you for your message. Your request was submitted to the dealing desk to be reviewed.
All the best - Arvin -
5 hours ago, Taiki said:
Hi @CharlotteIG
Would it be possible to add ticker (NASL) - Lyxor Nasdaq-100 UCITS ETF - Acc to the share dealing + ISA account, it trades on the London Stock Exchange. There are some other variants available for trading already on other exchanges but this is the best version of all of them but it's not been added.
It is available on T212 on their ISA so I assume you should be able to get it quite easily.
Best Wishes and ThanksHi @Taiki,
Thank you for your message. Your request was submitted to the dealing desk to be reviewed.
All the best - Arvin -
SENTIMENT
SENTIMENT INDICATORS: USING IG CLIENT SENTIMENT
The IG Client Sentiment (IGCS) is unique, proprietary and potentially helpful to traders. The article will outline the following illustrative points:
- What is IG Client Sentiment (IGCS)?
- Sentiment Indicators
- IGCS as a Leading Indicator
- IGCS as a Technical Indicator: Summary
WHAT IS IG CLIENT SENTIMENT (IGCS)?
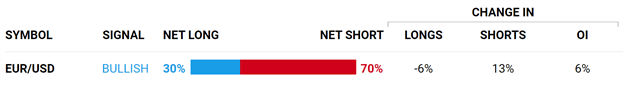
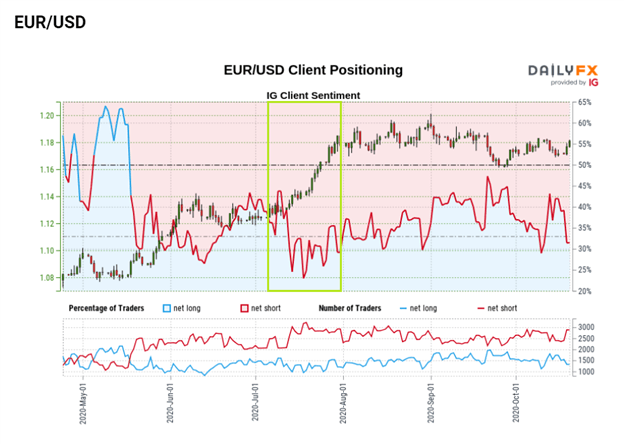
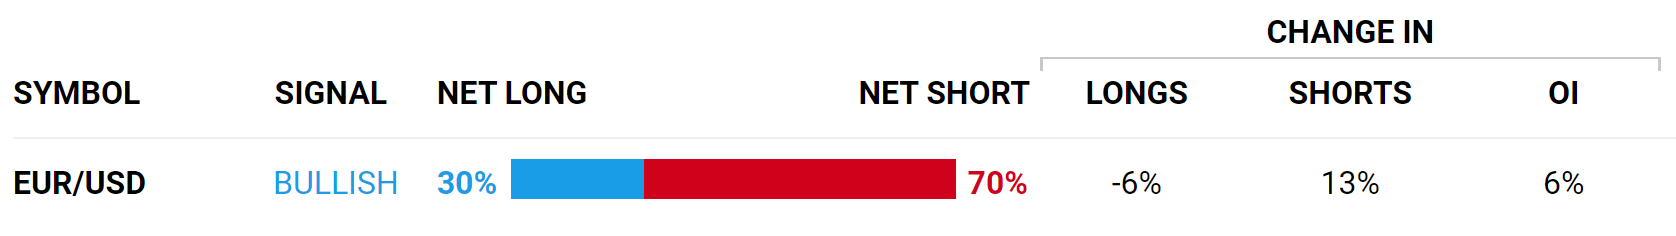
IG Client Sentiment (IGCS) is a tool that traders can use in conjunction with a broader technical and/or fundamental strategy. IGCS incorporates retail trader positioning (long and short) to formulate a sentiment bias. This is represented in percentage form (see image below) which aids traders in identifying market imbalances which could lead to possible opportunities.
IGCS on EUR/USD:
SENTIMENT INDICATORS
Sentiment indicators are few and far between. The two most well-known are open interest in options, which largely applies to stocks, and the Commitment of Traders Report (CoT). What sets IGCS apart is the large sample size of retail traders which deliver more usable data in terms of indicator readings, multiple market data sets (FX, equities commodities) and timely updates for these markets which are refreshed several times daily.
IGCS AS A LEADING INDICATOR
The use of IGCS as a technical indicator can allow traders to confirm or refute signals produced by their wider trading strategy. Both fundamental and other technical techniques are used to gauge trends, ranges, potential reversals etc. so incorporating IGCS provides another layer of data to help verify a hypothesis.
IGCS can be considered as a leading indicator as it uses past and current data to project possible future price movements however, as IGCS (retail) covers only one component of the market equation, traders should not rely solely on the IGCS tool for trading decisions. Simply put, retail traders contribute only a certain percentage of market input so naturally other factors will have influence on the respective market.
For example, the EUR/USD chart below shows the projectible nature that can occur with IGCS. The highlighted are on the chart exhibits an increase in net short positions from retail traders which coincided with a rise in price action (EUR appreciation) on the price chart itself.
IGCS EUR/USD:
IGCS AS A TECHNICAL INDICATOR: SUMMARY
We have shown how sentiment/IGCS can be a unique, proprietary and potentially helpful addition to a trader’s approach. In subsequent IGCS articles in this market sentiment sub-module, we will go through the implementation and flexibility of this tool in varying trading circumstances.
Looking to trade in a simulated environment to better learn strategies, tactics and approach? Click here to request a free demo with IG group.
DailyFX provides forex news and technical analysis on the trends that influence the global currency markets.
Warren Venketas , Analyst , DailyFX
29 December 2021
-
1
-
Canada is grappling with a housing market crisis that has seen the median family home soar 20% in a year to C$720,850. As inflation surges, will the Bank of Canada raise interest rates in 2022?

Source: BloombergUSD/CAD is one of the most popular currency pairs on IG. And currently, 56% of clients are long on the market, signalling investor uncertainty as the markets price in the chances that the US Federal Reserve could raise rates before the Bank of Canada. But as its housing market rises out of control, Canada’s central bank is coming under intense pressure to tighten monetary policy.
USD/CAD: Inflation and interest rates
According to this month’s renewal of Canada’s Monetary Policy Framework, ‘the primary objective of monetary policy is to maintain low, stable inflation over time.’ And in common with every central bank across the western world, the Bank of Canada has struggled with this mandate in 2021.
Canada’s CPI inflation rate is at a multi-decade high of 4.7%. This may be lower than the US’s 6.8%, the UK’s 5.1%, and the EU’s 4.9%. However, Canada’s central bank is tasked with preserving the inflation rate at between 1% and 3%— and inflation is expected to continue rising until mid-2022.
But at its December interest rate meeting, the bank decided to hold the base rate at 0.25%, citing how the Omicron variant has ‘injected renewed uncertainty,’ and that ‘accommodative financial conditions are still supporting economic activity.’ Much like the Federal Reserve, it has also dropped the word ‘transitory’ to describe the current inflationary spiral.
Justifying its decision, the bank said that ‘Canada’s economy grew by about 5.5% in the third quarter…GDP is about 1.5% below its level in the last quarter of 2019 before the pandemic began.’
Meanwhile, Statistics Canada’s November Labour Force Survey found that ‘the unemployment rate fell to 6.0%, within 0.3 percentage points of what it was in February 2020.’ And the country had 912,600 job vacancies, a record high.
The bank summarised that it remains ‘committed to holding the policy interest rate at the effective lower bound until economic slack is absorbed so that the 2% inflation target is sustainably achieved…sometime in the middle quarters of 2022.’ However, maintaining this ultra-loose monetary policy will come at a cost.

Source: BloombergUSD/CAD: red-hot housing market
Across the western nations, rapidly rising housing costs is fast becoming a crisis. Wage increases are being eclipsed by house price rises— and arguably, the Great White North has been one of hardest hit.
The Canadian Real Estate Association estimates that the national average home price rose 19.6% over the past year to C$720,850 in November 2021. And according to Royal LePage CEO Phil Soper, prices will rise a further 10.5% in 2022, due to ‘to a level of demand that will continue to outpace inventory, keeping prices rising on a steep upward trajectory.’
With average prices in Toronto and Vancouver already surpassing the C$1 million mark, Soper believes the increases will continue as buyers take ‘advantage of increased savings and record-low interest rates.’ Prices will also be supported by high immigration and the continued transition to remote working.
After failing to win a majority in September’s snap election, Prime Minister Justin Trudeau has instructed Housing Minister Ahmed Hussen to discourage property investment by reviewing the rules around deposits as well as housing policies to curb ‘excessive profits.’
Hussen plans to ‘reduce speculative demand in the market and help cool these astronomical increases in prices.’ He has already imposed a 1% tax on foreign-owned vacant homes and intends to ban the controversial practice of blind bidding. He is also proposing C$4 billion for affordable housing but has come up against ‘NIMBYism’ and ‘unreasonable opposition to affordable housing in neighbourhoods.’
New Zealand implemented similar laws to stop property speculation back in March. However, average prices still rose 31% over the year to July to a record NZ$937,000. Its Reserve Bank has finally increased its base rate to 0.75% and plans for further rises in the new year.
But Conference Board of Canada economist Sasan Fouladirad believes that Canada will not raise rates before the US, as ‘Canadian household debt is on average much higher than the US…we expect the Bank to wait until June next year.’
However, as housing inflation continues to skyrocket, the argument for raising rates continues to grow stronger.
Trade 100+ FX pairs with the UK’s No. 1 retail forex provider.* Enjoy fast execution, low spreads – plus we’ll never fill your order at a worse price. Learn more about our forex trading platform or create an account to start trading today.
Charles Archer | Financial Writer, London
29 December 2021-
1
-
-
10 hours ago, Levo said:
I am in a slightly different position.
I have installed the IG app on my iphone (IOS 15.2) which has face id defined but cannot use it to log in.
When I go to the Account > Settings menu, I don't see an authentication option.
Any ideas?
Cheers.
Hi @Levo,
Could you please confirm that your Face ID is activated on your phone settings ?
On the IG app if you select Account at the bottom right then Settings, then scroll down to Account settings you should be able to see the Touch ID and Face ID options to toggle on.
Feel free to reach out to helpdesk.uk@ig.com with a screenshot for further assistance.
I hope that it helps.
All the best - Arvin -
6 hours ago, Edgar_707 said:
How can you use leverage, because in the demo account when you want to place a trade there is no button or way of indicating if you want to use leverage or not. I don't find the option for using it, so I would appreciate if someone could help me.
Thanks.
Hi @Edgar_707,
All our demo accounts are using leverage, there are no option to activate or deactivate leverage on the demo accounts.
All the best - Arvin
-
5 hours ago, nickpr said:
Hi I wanted to buy shares in this but can’t find it on IG:
https://www.svfinvestmentcorp.com/svfc/
is there a reason it is not listed? Can it be added?
thanks
nick
Hi @nickpr,
You can use the below thread to submit a stock request.Could you please clarify if you want this stock to be added on share dealing or leverage account?
On leverage account the market cap would to low to be added.
Thank you - Arvin
-
6 hours ago, Edgar_707 said:
But what button do you use for using leverage, because I just see in the demo account that in any trade I place there's not an option for leverage.
Thanks.
Hi @Edgar_707,
All Demo accounts are using leverage. The leverage is automatically applied on the the dealing ticket. You can find the margin requirements on the info tab of the dealing ticket :
The margin will display on the ticket:

All our demo accounts are using leverage, there is no toggle on button.
I hope that it helps.
All the best - Arvin -

Illustration taken December 11, 2021. REUTERS/Dado Ruvic
COPENHAGEN, Dec 22 (Reuters) - Getting a third dose of either Pfizer-BioNTech's (PFE.N) or Moderna's (MRNA.O) COVID-19 vaccine offers a "significant increase" in protection against the Omicron variant in elderly people, according to a Danish study published on Wednesday.
The study, which is not yet peer-reviewed, investigated the effectiveness of COVID-19 vaccines that use so-called mRNA technology against the Delta variant and the new, more infectious Omicron variant.
"Our study contributes to emerging evidence that BNT162b2 (Pfizer-BioNTech) or mRNA-1273 (Moderna) primary vaccine protection against Omicron decreases quickly over time, with booster vaccination offering a significant increase in protection," the authors wrote in the study.The study was conducted by researchers at Denmark's top infectious disease authority, Statens Serum Institut (SSI). It analysed data from three million Danes gathered between Nov. 20 and Dec. 12.
Among those who recently had their second vaccine dose, effectiveness against Omicron was measured at 55.2% for Pfizer-BioNTech and 36.7% for Moderna, compared to unvaccinated people.
But that protection quickly waned over the course of five months, the researchers said.
"We see that the protection is lower and decreases faster against Omicron than against the Delta variant after a primary vaccination course," study author Palle Valentiner-Branth said.
However, a third dose of Pfizer-BioNTech's vaccine restored protection to 54.6% in people aged 60 or more who had been inoculated 14 to 44 days earlier, compared to those with only two doses.
The study confirms the findings of a recent British study, which also showed a rapid decline in protection against Omicron over time and an increase following a booster with Pfizer-BioNTech's vaccine.
"In light of the exponential rise in Omicron cases, these findings highlight the need for massive rollout of vaccinations and booster vaccinations," the researchers said.
-
14 hours ago, Trader1112 said:
OK, I see. At what market cap can it be added? What’s the tipping point?
Hi @Trader1112,
The market cap to add stock on leverage accounts is $1bn USD, if it is close to that amount the dealing might consider adding it.
All the best - Arvin -
10 minutes ago, amrutbairy said:
Thanks for the reply. Is there any plans to introduce this feature as many other brokers are already giving it and it is very fast compared to all the other types of deposit or withdrawal methods.
Hi @amrutbairy,
We already raised that feedback to the relevant department. There is no ETA at this point in time. Please keep in mind that depositing via card is immediate. The longest time frame is for withdrawals 1-3 business days.
Thank you - Arvin -
4 minutes ago, amrutbairy said:
Hello all,
I am new to this broker. I would like to know if it is possible to deposit funds into our account via cryptocurrencies like bitcoin.
Hi @amrutbairy,
Unfortunately, We do not offer such deposit method. You can use Cards, Bank transfer and Paypal.
All the best - Arvin -
On 20/12/2021 at 23:08, Midge25 said:
Can anyone tell me what happens to my shares I hold in Bacanora now the cash offer by Ganfeng has been accepted. I understand BCN are going to be delisted & seen the constituent Deletion notice. I was a little confused about how to accept the offer & didn't return anything or register etc. I'm assuming I won't just lose my shares?. Im also aware there will be some Zinwald shares added as per the offer. Will I automatically get these although I didn't accept the offer?
Hi @Midge25,
That would be a query for the Corporate Action team. Have you received an email from in regards to your Bacanora position? If so please reply to that email with your question.
Alternatively reach out to helpdesk.uk@ig.com or use our live chat feature on the IG website.
All the best - Arvin -
10 hours ago, Trader1112 said:
Allarity, ALLR, Nasdaq US
Market cap 150 M USD
Leverage
Hi @Trader1112,
The market cap is too low on ALLR to be added. The stock was added on share dealing platform.All the best - Arvin
-
On 18/12/2021 at 02:04, GorillaForSale said:
I have an IG Smart ISA account. If I open a new IG Stocks and Shares ISA account, can I freely transfer funds back and forth between the two without losing their tax free status and without having to fill out any additional forms?
Hi @GorillaForSale,
ISA rules state that you can only pay into a single stocks and shares ISA each tax year. You are free to open an additional ISA with a different provider each new tax year, but can only pay money into one.
With IG, you can invest in a single stocks and shares ISA via two separate account types: share dealing and/or an IG Smart Portfolio. This means that if it suits your investment strategy to do so, you can open an IG Smart Portfolio and share dealing account in the same tax year and split your annual ISA allowance between them.
I hope that it helps.
All the best - Arvin -
NASDAQ 100, ASX 200, NIKKEI 225, BUILD BACK BETTER, OMICRON – ASIA PACIFIC INDICES BRIEFING
- Nasdaq 100, S&P 500, Dow Jones sink to start off the new week
- US fiscal stimulus disappointment and Omicron woes were eyed
- ASX 200 and Nikkei 225 resilient despite Wall Street turbulence
MONDAY’S WALL STREET TRADING SESSION RECAP
Market sentiment deteriorated to start off the new week, with the Nasdaq 100, S&P 500 and Dow Jones sinking 1.06%, 1.14% and 1.23% respectively on Monday. The VIX index, also known as the market’s preferred ‘fear gauge’, closed at its highest in almost 2 weeks. Financials (-1.9%), materials (-1.8%) and industrials (-1.7%) were the worst-performing sectors within the S&P 500.
A combination of US fiscal stimulus disappointment and Omicron Covid-19 variant woes likely played a key role in markets. Over the weekend, US Senator Joe Manchin dashed hopes of getting President Joe Biden’s US$ 2 trillion ‘Build back Better’ economic bill passed. By not supporting the bill, it will almost be impossible for Democrats to pass the legislation without any Republican backing in the 50-50 Senate.
Meanwhile, threats of Covid-related restrictions in Europe also likely dented risk appetite. The United Kingdom is debating whether or not to impose fresh restrictions as the Netherlands locked down until the middle of January. Germany imposed a quarantine on travelers from the UK, and the Bundesbank warned that the nation’s economy may shrink this quarter.
NASDAQ 100 TECHNICAL ANALYSIS
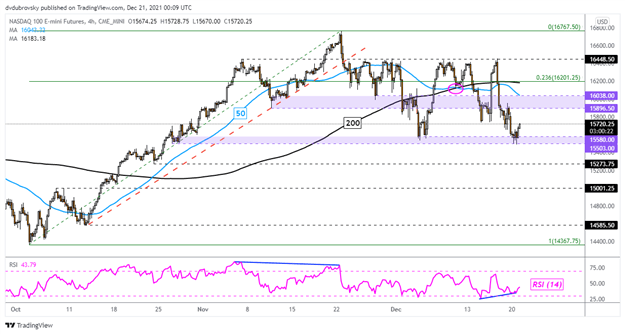
Despite recent weakness in Nasdaq 100 futures, prices were unable to take out the key 15503 – 15580 support zone on the 4-hour chart below. Still, the index has confirmed a breakout under the 200-period SMA. A bearish crossover between that and the 50 line offers a downward technical bias. Clearing the support zone exposes the late October low at 15273. Otherwise, a push higher has the 50-period line in focus.
NASDAQ 100 4-HOUR CHART
TUESDAY’S ASIA PACIFIC TRADING SESSION
Following the disappointing session on Wall Street, Asia-Pacific markets could be at risk to more of the same on Tuesday. New Zealand announced that it will be delaying reopening its borders due to the Omicron variant. However, S&P 500 futures have been cautiously recovering since the Wall Street close, suggesting that some consolidation could be in store.
While the Omicron variant now makes up for about 75% of new Covid cases in the US, a lack of strict lockdowns could keep market sentiment from noticeably deteriorating as deaths remain relatively low. Japan’s Nikkei 225 and Australia’s ASX 200 are up 1.6% and 0.4% in morning trade.
ASX 200 TECHNICAL ANALYSIS
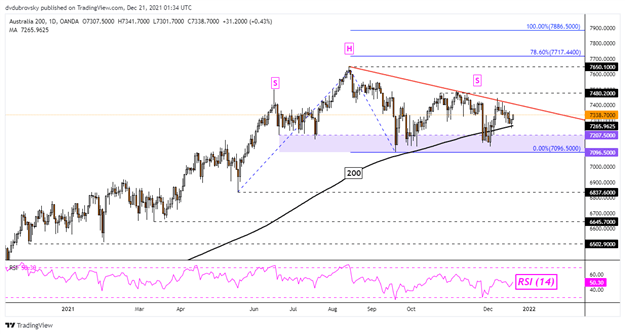
The ASX 200 remains in a consolidative setting, but a bearish Head and Shoulders chart pattern could be in the process of forming. Prices are also testing the 200-period SMA, which appears to be maintaining the broader upside focus. The index is also being guided lower by a near-term falling trendline from August. Clearing the line exposes the right shoulder around 7480. Immediate support seems to be the 7207 – 7096 zone.
ASX 200 – DAILY CHART
Daniel Dubrovsky, Strategist for DailyFX.com
21 December 2021To contact Daniel, use the comments section below or @ddubrovskyFX on Twitter
-
 1
1
-
On 19/12/2021 at 16:08, DarkMatter731 said:
5QQQ and SP5Y both trade on the London Stock Exchange.
I would ask that Leverage Shares 5x Long US Tech 100 ETP and Leverage Shares 5x Long US 500 ETP be added to the platform.
You already have Leverage Shares 3x products and some of their other products. They just added these ETPs to their offering a few days ago and I've noticed they're missing from the platform.
Hi @DarkMatter731,
Both were added to share dealing accounts.
All the best - Arvin


Stock Requests
in Shares and ETFs
Posted
Hi @Taiki,
I can see that NASL is allowed on ISA. The error message you received is an error that requires IG to conduct some verification to allow you to trade that ETF as it is categorised as complex. Could you please reach out to helpdesk.uk@ig.com or use our live chat feature, our helpdesk will be able to confirm some details and give you access to that ETF.
All the best - Arvin