

Caseynotes
-
Posts
13,207 -
Joined
-
Last visited
-
Days Won
556
Content Type
Profiles
Forums
Blogs
Events
Community Tutorials
Store
Posts posted by Caseynotes
-
-
Interesting resource info graphics on China's tech companies.
https://www.abacusnews.com/china-tech-city

-
3 hours ago, Mark8787 said:
Apple inc share buy price is currently $194.1400.
The deal ticket iPhone screen has a stop distance +- spinner. If I enter “2” in there does it represent $2 (e.g. stop loss at $192.1400) or something else?
Hi @Mark8787, the stop distance should be in points which in IG speak is the same as a pip (FX) or a tick (Indices).
See this info page on the deal/order ticket.
-
Both Dax ad Dow have fallen away from the pivot towards S1 and both have something of a triangle pattern going on in the M30 charts. Looking to see if the European open shows direction. Currently the Bears hold the pivot so looking to target S1 but that may change especially after the London open at 8am.

-
Dow continues to lurk just below resistance at 26250 in a bull flag just waiting for a reason to break. Dax looks like retesting support at 12047, Ger and EU econ sentiment data coming in at 10am.
Nikkei is testing support at 20919 while Ftse is sitting mid range at 7362.

-
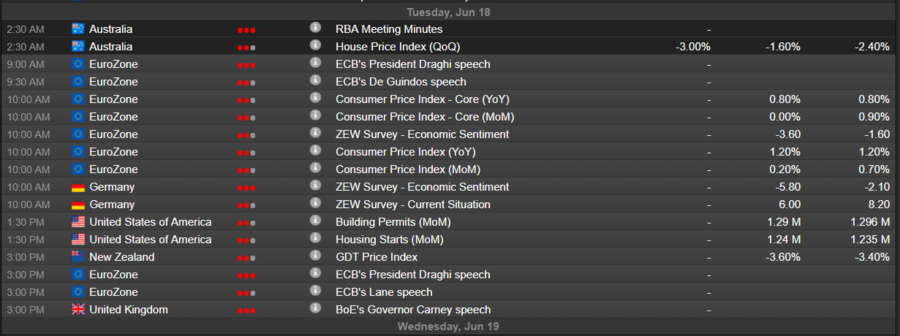
Tuesday's econ cal;
-
Euro & Gold up. USD & Oil down. Indices flat, Cryptos down. Chart of the day is Facebook.

-
3 hours ago, GabyBerger said:
Hi,
Can you show me how you calculated the borrowing cost of $51.14 for my Account for 17/6/19 ?
Gaby
Hi, there are different calculations for different asset types, FX is worked out for you and can be seen from the 'Positions' tab once that option is selected from the menu, see this page for more info on this and details and examples on how overnight funding is calculated for different asset types. (this is the UK version, there will probably be an Aust. equivalent page on IG.com/au
-
5 hours ago, nit2wynit said:
@Caseynotes by far a great example of what is needed.
Ironically, this is my Page 1. However, the Psych is still in development.But this @nit2wynit is how you bring it full circle. You can't know the outcome of any single trade when you enter, you know that every trade won't be profitable but because you have tested your strategy and know that over 50 trades the strategy is profitable, the fear factor disappears. The only problem left then is making sure you always stick to the rules.
-
 1
1
-
-
13 hours ago, Caseynotes said:
This is a good article, 20 questions you need to be able to answer;
20 Questions For Help Building a Trading Plan
System
- What type of trader will I be? Swing, trend trader, trend follower, day trader, Elliot Wave, Fibonacci, CAN SLIM, option trader, another, or a combination?
- What time frame will I be trading on?
- What are my trading rules?
- What signals my entry?
- What will signal my exit?
- Do I use a trailing stop or a price target to lock in profits?
- What will I be trading?
- Will I trade long or short or both?
- What is the probability of my trade working out based on historical data?
- What has to happen to invalidate my trading system and make me look for flaws in my thinking?
Psychology
- How big of a position size can I mentally and emotionally handle trading?
- Does my chosen trading method fit my personality for activity and risk tolerance?
- Do I truly believe that my method will work and be profitable?
- Do I enjoy trading?
- Do I have the mental strength to persevere until successful in trading?
Risk
- How much of my trading capital will I risk per trade?
- How many losses in a row with this level of risk will lead to blowing up my trading account?
- How much will I lose at one time if all my open positions go against me at the same time?
- How correlated with each other are all your open positions and your potential trading vehicles that are on your watch list?
- Do you fully understand the potential risk in what you are trading?
Though the need for a trading plan and a trading strategy coupled with good basic money management has been repeated in near every trading book ever written since the dawn of time few actually seem to follow this advice.
The probable reason is likely because few seem to really understand what they are and so just repeat the mantra without actually doing it.
The strategy is the simple set of rules that govern every trade. The set up, the entry, managing the trade and then the exit. The same set of rules applied to every trade. You know what's going to happen before you even pull the trigger (you are going to follow the strategy's rules). You might have one, two or perhaps three different strategies but that should be your limit as a new trader. You know the strategy works because you have tested it, that's why you stick to the rules.
The plan seeks to highlight before hand when and where one of your strategies might start setting up so it will consider chart structure, trends, levels, news events, when you need to be ready or resting, etc.
Without the construction and appliance of a tested scientific model you will just be shooting from the hip at shadows.
-
1
-
21 minutes ago, LadyT said:
why do I keep having to give permission for flash to run charts??????
It's not the charts or IG, it's your browser that keeps resetting Flash. This is probably a safety precaution because it has been identified that Flash has security issues that can be exploited by unscrupulous web sites to be used to ship in malware onto your computer. This is why Flash is being discontinued by Adobe and why IG need to upgrade the shares platform to HTML5 (as is the spread bet and cfd platforms) before they do.
-
Dow completed it's drift lower to the pivot around 26100 while Dax ranging between 12125 and 12079. Fairly flat market so far.

-
BTC nearing yesterday's high, bonds, Gold and commods red, indices and FX fairly flat.

-
On 11/06/2019 at 21:59, underg said:
...sensitive uk shares like airlines and housebuilders,etc?
any thoughts?
Latest Brexit probability scenario offering from ING Economics;

-
Tight race for Tory leadership lol. (from betdata)

-
11 hours ago, Caseynotes said:
you may find the final volume profile has changed on Monday.
And volume see chart below;
Also, https://www.ft.com/content/f40730be-90c6-11e9-aea1-2b1d33ac3271

-
Interesting, are you going to review this for us then @elle ?
-
This is a good article, 20 questions you need to be able to answer;
20 Questions For Help Building a Trading Plan
System
- What type of trader will I be? Swing, trend trader, trend follower, day trader, Elliot Wave, Fibonacci, CAN SLIM, option trader, another, or a combination?
- What time frame will I be trading on?
- What are my trading rules?
- What signals my entry?
- What will signal my exit?
- Do I use a trailing stop or a price target to lock in profits?
- What will I be trading?
- Will I trade long or short or both?
- What is the probability of my trade working out based on historical data?
- What has to happen to invalidate my trading system and make me look for flaws in my thinking?
Psychology
- How big of a position size can I mentally and emotionally handle trading?
- Does my chosen trading method fit my personality for activity and risk tolerance?
- Do I truly believe that my method will work and be profitable?
- Do I enjoy trading?
- Do I have the mental strength to persevere until successful in trading?
Risk
- How much of my trading capital will I risk per trade?
- How many losses in a row with this level of risk will lead to blowing up my trading account?
- How much will I lose at one time if all my open positions go against me at the same time?
- How correlated with each other are all your open positions and your potential trading vehicles that are on your watch list?
- Do you fully understand the potential risk in what you are trading?
-
1
-
 1
1
-
11 minutes ago, mykig said:
Hi casy I believe we should restrain our selves for now from DAX or FTSE as its in a bit of danger zone from here anything can happen hence better to wait until they go out of consolidation phase am i right?
@mykig, you are right that things are a bit congested at the mo but even within zones of consolidation price will continue to test boundaries so I'll be looking at the intraday pivots. Dax is sitting the the pivot point trying to decide whether to test R1 or S1 while Ftse looks to be heading down to retest the pivot point, will wait for the London open for a clearer indication of the aim of the morning session and once direction is clear look for a pullback on the smaller time frame to join, but because of the consolidation the targets are not big.

-
On the zoomed out Dow H1 we can see the previous double top level 26250 (red) is within reach and price looks willing to test it in the near future, will look for that to be broken this week to signal a move higher for all the indices.

-
8 hours ago, dmedin said:
It was indeed 'strange'. Trading sideways. Lots of opportunity to lose money.
")
Yes, something of a trial last week with a weekly chart doji all round though volume remained high but a big week coming up with rate decisions and mon pol statements for Japan, US and GB (see Econ Calendar thread).

-
Bonds and Gold down, Oil up, Western indices up, Asian indices down, BTC chasing yesterday's high. Euro up, Dollar basket down;

-
Main events this coming week.

-
1 hour ago, The_Alnchemist said:
Hello @Caseynotes. Thanks for this reply. I'll refer to the post you quoted and continue there as I have some similar volume discrepancies.
@The_Alnchemist, on another thread somewhere I also saw an IG reply that was saying that due to the mixed sources of data they used to collate volume that the final data point may be delayed and I've noticed this before, you may find the final volume profile has changed on Monday. Just checked the spread bet chart for Kier Group, see below.

-
As in the post above you need to be checking the monthly chart for gold. To zoom in on the chart below, gold has been uptrending since last October with a retrace in Feb, Mar, Apr, before continuing up. The important point is the blue down trend line was touched to the tick before pulling back on Friday, it looks a bit ragged on the chart but is actually auto drawn based of fractals. With three previous touches that is the line everyone will be watching with much anticipation going forward.

-
1
-


Dax & Dow
in Indices and Macro Events
Posted
Yes, looking at the dailies it's a pretty bleak row of insignificant candles stretching back over a week, the Ger econ senti at 10am may get a reaction but everyone seems to be waiting for the FOMC mon pol statement tomorrow.
Flat and balanced markets are difficult and not trading is often the better plan until they become directional again, otherwise it's a case of drilling down and finding short sharp targets playing the range.