

ArvinIG
-
Posts
1,728 -
Joined
-
Last visited
-
Days Won
23
Content Type
Profiles
Forums
Blogs
Events
Community Tutorials
Store
Posts posted by ArvinIG
-
-
1 minute ago, NickBB said:
Hi, is there functionality to show two (or more) prices on one chart?
Many thanks.
Hi @NickBB,
Thank you for your post.
Could you please clarify what you mean by showing two prices?
You can have different windows showing different markets by clicking on the icon at the top right-had corner.
You can also split the charts for the same market.
If you are after market depth you can subscribe to Level 2 to receive such data
Please let us know if it helps.
All the best - Arvin -
3 hours ago, kanpro123 said:
Hi !
Just a small question! how to use guaranteed stop loss on mt4 platform ?
Hi @kanpro123,
You can only use Guaranteed stops on MT4 if your account is a Limited Risk account, meaning GS are required for your to place orders.
Thank you - Arvin
-
14 hours ago, Mattshowan said:
Hi.
I get the same message when trying to trade IEFQ today. Not sure why?
It's an EUR stock and i have completed the US form required, but still doing it.

Hi @Mattshowan,
The dealing desk advised that it should be fixed now. Please let us know if you are able to place your deal.
Thank you - Arvin
-
The RBNZ lifted the official cash rate 0.50% to 2.0% as expected; this is the fifth rate hike in succession for the RBNZ to fight inflation and hawkish RBNZ as Fed expectations fade.
Source: BloombergThe New Zealand dollar bolted after the Reserve Bank of New Zealand (RBNZ) raised the official cash rate (OCR) 0.50% to 2.0%, as anticipated.
The Kiwi overcame pre-meeting weakness on the decision. It comes at a time when the market is reducing the amount of rate hikes that the Federal Reserve will be required to make to combat their inflation woes.
NZD/USD immediate reaction to RBNZ rate hike
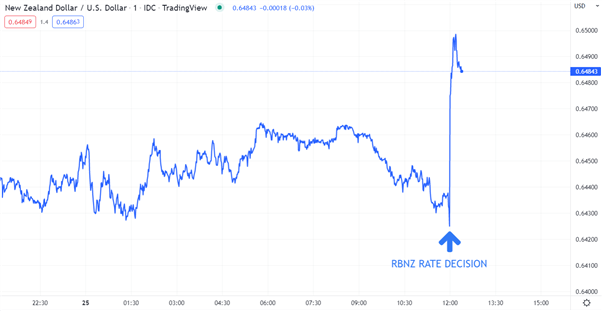
Source: TradingViewThe RBNZ is looking to control rampaging inflation in the aftermath of extremely loose fiscal and monetary policy. Today’s hike has seen the cash rate go from a pandemic low of 0.25% to 2.0%. Year-on-year New Zealand CPI is running at 6.9% to the end of the first quarter, the highest in 30 years. The latest unemployment rate of 3.2% for March is at multi-generational lows.
A fortnight night ago, food price inflation for the month of April came in at 0.1% against a previous reading of 0.7%. This gives an annual read of 6.4% for food inflation at the retail level, down from the prior 7.4%, potentially indicating that tighter monetary policy might be impacting prices.
Unfortunately, New Zealand, like Australia, only delivers CPI quarterly and this leaves the RBNZ somewhat in the dark on the current level of price pressures within the economy. It also makes it difficult for them to gauge the response to their actions thus far. The next RBNZ monetary policy meeting is 13th July. Second quarter CPI will be released 17th July.
The result is that it’s possible that the next rate decision from the RBNZ could be the wrong one, regardless of what they do, through no fault of their own.
NZD/USD technical analysis
NZD/USD has bounced off a two-year low of 0.6217 and proceeded to move above a descending trend line earlier this week.
On that rally it has crossed above the 10- and 21-day simple moving averages (SMA) which may suggest that bearish momentum has stalled. If the price goes below those SMAs, if could be a resumption of bearish momentum.On the topside, a series of break points and the recent high might provide resistance at 0.6540, 0.6569, 0.6593 and 0.6631. The medium and longer-term SMAs above those levels may also offer resistance.
Support may lie at the break point of 0.6380 or the recent low of 0.6217.
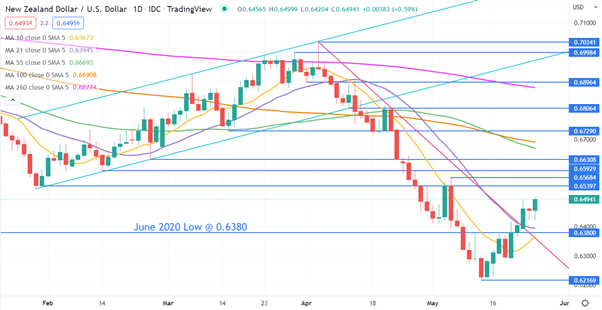
Source: TradingView
This information has been prepared by DailyFX, the partner site of IG offering leading forex news and analysis. In addition to the disclaimer below, the material on this page does not contain a record of our trading prices, or an offer of, or solicitation for, a transaction in any financial instrument. IG accepts no responsibility for any use that may be made of these comments and for any consequences that result. No representation or warranty is given as to the accuracy or completeness of this information. Consequently any person acting on it does so entirely at their own risk. Any research provided does not have regard to the specific investment objectives, financial situation and needs of any specific person who may receive it. It has not been prepared in accordance with legal requirements designed to promote the independence of investment research and as such is considered to be a marketing communication. Although we are not specifically constrained from dealing ahead of our recommendations we do not seek to take advantage of them before they are provided to our clients.Daniel McCarthy | Strategist
25 May 2022 -
12 hours ago, bellyboo said:
 pl
Hi anyone,I was wondering if I may seek your advice. I am retentively new to bitcoin/crypto and have been trading through this website. I was feeling quite confident with it until I recently got this message after my partner transferred some USDT into my account. Would love to hear your's or anyones thoughts.website: https://msbtc.vip/app/#/ message from their customer support this is my first time on reddit, as a colleague recommended reaching out on here. Not sure if this is this right place or not thou.Just wanted to earn a little extra money, but now I am fearing that I have indeed lost money...many thanks isabella
pl
Hi anyone,I was wondering if I may seek your advice. I am retentively new to bitcoin/crypto and have been trading through this website. I was feeling quite confident with it until I recently got this message after my partner transferred some USDT into my account. Would love to hear your's or anyones thoughts.website: https://msbtc.vip/app/#/ message from their customer support this is my first time on reddit, as a colleague recommended reaching out on here. Not sure if this is this right place or not thou.Just wanted to earn a little extra money, but now I am fearing that I have indeed lost money...many thanks isabellaHi @bellyboo,
I believe that it is a scam, you can find the official website of Morgan Stanley here:
https://www.morganstanley.com/
All the best -Arvin-
 1
1
-
-
WTI crude oil moved higher over the past few days due to the weakening greenback and the easing of Shanghai's lockdown. However, a fresh catalyst emerged this week and may cool down the momentum.

Source: BloombergBoth U.S. West Texas Intermediate crude oil and Brent Crude have been inching higher over the past few days due to the weakening greenback and the easing of concerns as China lifts Covid-related restrictions in Shanghai.
However, a fresh catalyst that emerged early this week may cool down the momentum for the crucial energy.
First, the European Union seemly struggled to reach a final agreement on banning Russian oil following its invasion of Ukraine by the intended deadline, the end of the year.
Second, China's capital Beijing reported a record number of new Covid-19 cases on Monday, reviving concern that the nation's most important city may face a broad lockdown and impact the Shanghai's exit plan.
Thirdly, on Thursday the US will report the preliminary GDP data for Q1 as a revision of the advanced GDP data released last month, which showed an economic contraction of 1.4%. The upcoming print is anticipated to demonstrate a wide-range pullback from 6.9% growth in Q4 2021, primarily due to a record trade deficit and a decline in inventory investment.
Angst over the global economy has been ascending since early 2022. The recent data revealed US retail sales and the Q1 earnings have fuelled this concern to a lofty level. It must be said that the possibility of a recession in the US and elsewhere is now turning from 'likely' to 'possible'.
Nevertheless, it can't be ignored that the continued war in Ukraine means that supplies of oil to the rest of the world will be under pressure for the foreseeable future.
Technical analysis
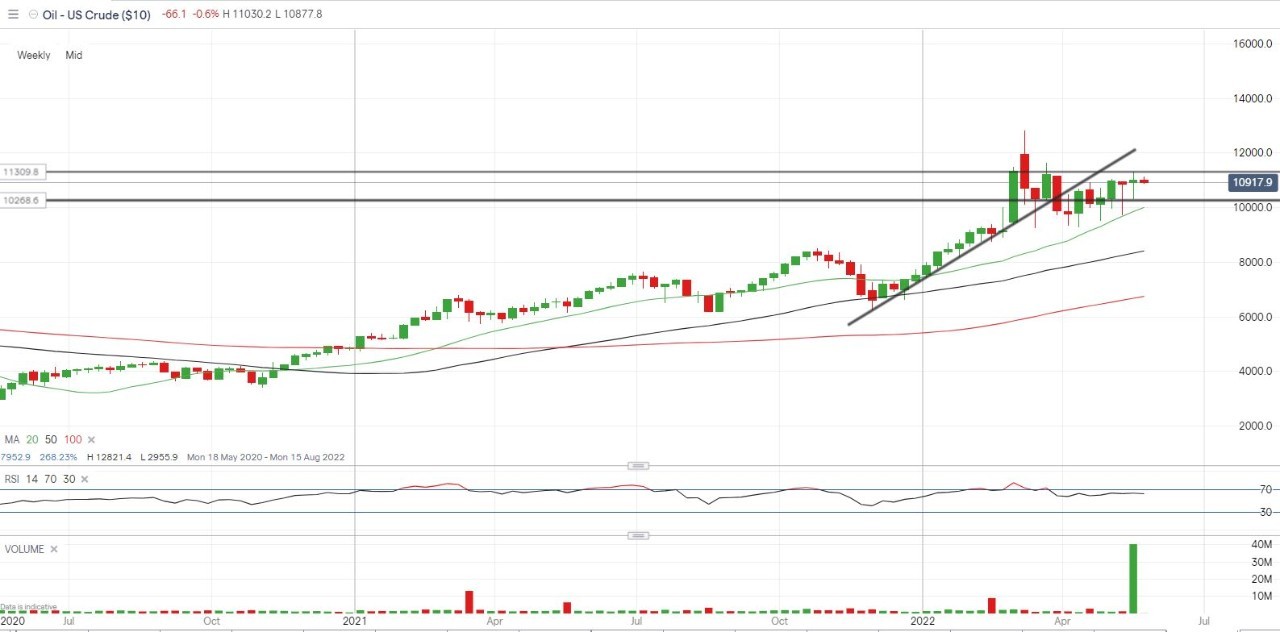
The daily chart shows that the price of US crude is staying safely in the ascending trajectory with strong support from both the 20 and 50-days moving averages. The upper boundary of the tunnel should meet with the March high at 113.60 in the next couple of days and will play as a major resistance level and potentially a reversal point if the price fails to breakthrough.
In this scenario, the 20-day MA sits around $106.88, which will be the imminent support before the price moves towards the lower boundary at 102.8.
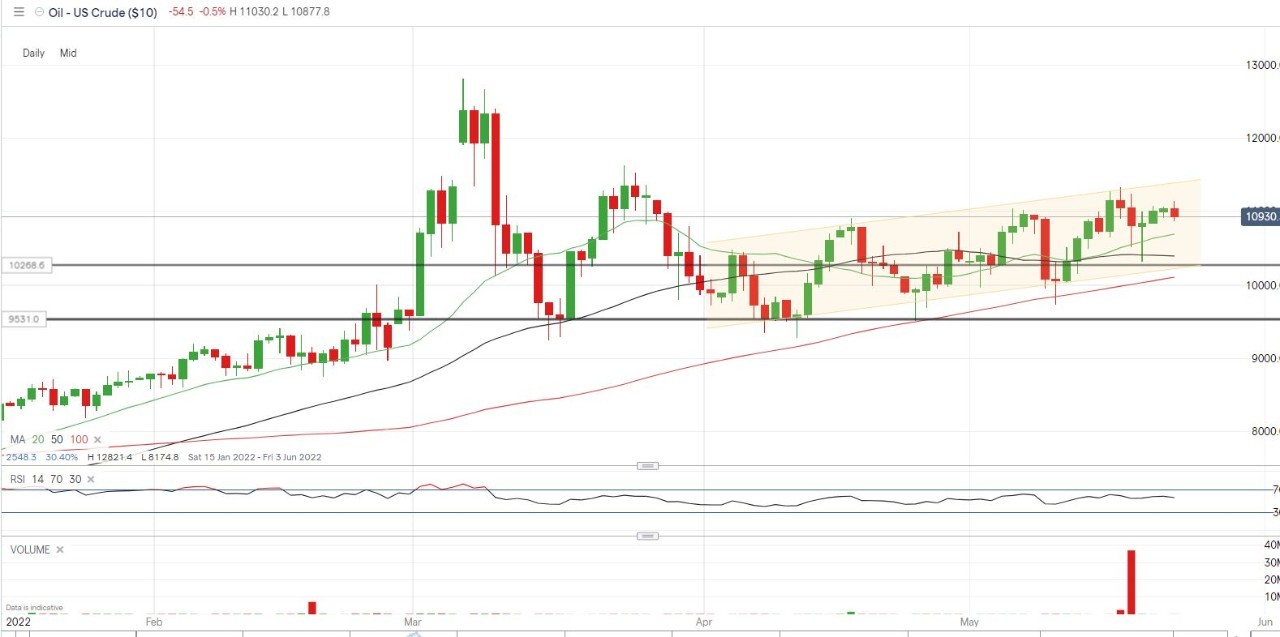 Source: IG
 Source: IG
Take your position on over 13,000 local and international shares via CFDs or share trading – and trade it all seamlessly from the one account. Learn more about share CFDs or shares trading with us, or open an account to get started today.
Hebe Chen | Market Analyst, Melbourne
24 May 2022 -
11 minutes ago, Bourei said:
I also have this problem. Order-related notifications since 20th May don't show, but price alerts still show as normal.
HI @Bourei,
Thank you for your feedback, an incident ticket has been raised with the IT team.
All the best - Arvin -
1 hour ago, CloudStock said:
Hi there,
Notifictions seem to have stopped working since 20/5
I executed a few trades on 22/05 and 23/05 but notifications are not coming up on the right hand pane as shown below.

Hi @CloudStock,
Thank you for your post. We are sorry to hear that you are facing technical difficulties. I will raise this incident to the IT team.
Could you please confirm, if you tried on another browser or on the IG app? Have you tried to delete your cache and cookies?
Thank you - Arvin -
1 hour ago, alex9686 said:
I'll be honest IG, if no one replies to me about this issue soon, I will be sending a complaint to the Australian Securities and Investments Commission. It's been 18 days since I raised this matter with the Corporate Actions team.
Hi @alex9686,
I managed to reach out to the Corporate action team. They advised that your order was reversed. The options should now be available on your side.
All the best - Arvin -
On 21/05/2022 at 02:33, Brokenabrokena said:
How can I get spread betting or cfd account? Does it have a minimum amount deposit?
Hi @Brokenabrokena,
The minimum deposit would be 250 GBP :
You can find more information on the blog below:
All the best - Arvin -
8 hours ago, Tsekomo said:
Want to fund my account but can't succeed because the name of the bank is not listed please help
Hi @Tsekomo,
If you are willing to fund your account in foreign currency please read through the document below:
https://a.c-dn.net/c/content/dam/publicsites/1623329611313/zam/files/misc/210525_IGM_ZAM_Fund_Account.pdf
I hope that it helps.
For further support, feel free to reach out to helpdesk.za@ig.com.
All the best - Arvin -
4 hours ago, DAVIDMCCULLOCH1983 said:
Hi
I am currently using PRT via IG for my trading and i wish to use the trailing stop function. I do not seem to be able to add a trailing stop/trailing step function to my pending orders. I get a response to say TS can only be applied to market orders and not working orders. I know from previous use of MT4 that i was able to utilise an EA for this but just seeing if anyone has a work around for this issue as it does seem like it should be straight forward.
Thanks in advance
Dave
Hi @DAVIDMCCULLOCH1983,
Thank you for your post.
It is not possible to place a Trailing stop on a working order the dealing logic won't allow it.
You can add a trailing stop while placing an order or once the position is open. You can have an EA to add trailing stop on open positions.
I hope that it helps.
All the best - Arvin -
10 hours ago, PRAVIN_BAKRANIA said:
How do we display Charges on "Position" tab
Hi @PRAVIN_BAKRANIA,
Could you please clarify what you mean by charges? Do you mean commission per deal?
On the position tab you can add filters, see below:
I hope that it helps - Arvin -
(UPDATE)
Australian dollar steady after jobs data amid risk off sentiment
The Australian dollar was steady after jobs data was largely inline; today’s data is against a backdrop of a strong domestic economic outlook and the RBA are validated for raising rates. Will more hikes boost AUD/USD?
Source: BloombergThe Australian dollar held its ground after the April unemployment rate came in at 3.9% as forecast and against 4.0% previously. This is the lowest Australian unemployment rate since the 1970s. The overall change in employment for the month was 4k instead of 30k anticipated. Full time employment increased a whopping 92k, while part time jobs decreased 88k.
With uncomfortably high inflation, today’s number opens the way for the RBA to continue to hike rates and potentially accelerate the lifting cycle to rein in loose policy. However, domestic factors appear to be sidelined for the exchange rate for now. The Aussie was pummelled overnight in a classic risk off trading environment after the reality of steep monetary tightening globally became apparent to a seemingly complacent equity market.
When it comes to growth versus inflation, central banks have erred on the side of fostering growth at the expense of living with high inflation. This is born out of the 1970-80s period of high inflation. At that time, US Federal Reserve Chair Paul Volker got the backing of two successive administrations, from both sides of the aisle, to get inflation under control. He did so through several highly restrictive policies. One of these was a move to very high interest rates.
The cost of this policy was two severe recessions in the 1980s. The market appears to have woken up to this stark reality for the current situation. Cheap money of this era is being consigned to history at a rapid rate of knots. With central banks focused on fighting inflation, risk assets that rely on cheap funding now have their business models questioned. As an example, special purpose acquisition companies (SPAC), once the darlings of the recent free-money environment, are facing difficulties raising cash - if they can at all.
More concerning has been the recent disappointing reporting results from real economy companies in the US. This backdrop leads to growth linked currencies like the Aussie coming under pressure, while perceived safe-haven currencies like the US dollar, Japanese yen and Swiss franc attract inflows.
Movements in the USD (DXY) index seems to be driving AUD/USD for now.
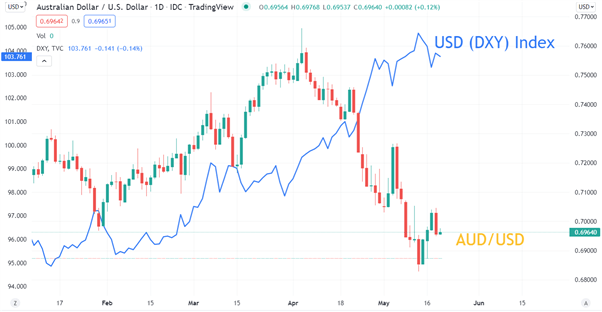
Source: TradingView
This information has been prepared by DailyFX, the partner site of IG offering leading forex news and analysis. In addition to the disclaimer below, the material on this page does not contain a record of our trading prices, or an offer of, or solicitation for, a transaction in any financial instrument. IG accepts no responsibility for any use that may be made of these comments and for any consequences that result. No representation or warranty is given as to the accuracy or completeness of this information. Consequently any person acting on it does so entirely at their own risk. Any research provided does not have regard to the specific investment objectives, financial situation and needs of any specific person who may receive it. It has not been prepared in accordance with legal requirements designed to promote the independence of investment research and as such is considered to be a marketing communication. Although we are not specifically constrained from dealing ahead of our recommendations we do not seek to take advantage of them before they are provided to our clients.Daniel McCarthy | Strategist
19 May 2022 -
On 21/04/2022 at 00:53, ash111 said:
i need to transfer funds to cover custody fee but since they wont be clearer until 2-3 days time im unclear what to do. i dont have the money to fund my account directly right now. do i just wait and let the custody fee be covered by my uncleared funds?
Hi @ash111,
Apologies for the late reply. The quickest way to make a deposit is via card as it is credited instantly. Alternatively, you can transfer funds from one account to another.
You can find further information and how to make a deposit and time frames on the post below:
I hope that it helps - Arvin -
On 28/04/2022 at 03:23, astrader78 said:
I can’t withdraw money from my account for more then 2 weeks now, IG keep asking same question as Im already sent all document required. Please provide proper payment team email and phone number because Im looking to close my account now
HI @astrader78,
Apologies for the late reply.
Unfortunately, the payment team does not have a direct email or phone number. You can reach out to helpdesk.uk@ig.com.
If you sent the documents it is possible that they are under review.
All the best - Arvin -
AUSTRALIAN DOLLAR TALKING POINTS
AUD/USD carves a series of higher highs and lows as it extends the rebound from the yearly low (0.6829), and fresh data prints coming out of Australia may fuel a larger advance in the exchange rate as employment is expected to increase for six consecutive months
AUD/USD REBOUND TAKES SHAPE AHEAD OF AUSTRALIA EMPLOYMENT REPORT
AUD/USD seems to have reversed course ahead of the June 2020 low (0.6648) amid recovery in global benchmark equity indices, with the exchange rate trading to a fresh weekly high (0.7041) as the Reserve Bank of Australia (RBA) Minutes reveals that “timely evidence from liaison and business surveys indicated that labour costs were rising in a tight labour market and a further pick-up was likely over the period ahead.”
As a result, the RBA insists that “that further increases in interest rates would likely be required to ensure that inflation in Australia returns to the target over time,” and the update to Australia’s Employment report may generate a bullish reaction in AUD/USD as the economy is anticipated to add 30.0K jobs in April.
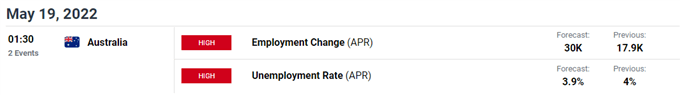
At the same time, the Unemployment Rate is seen narrowing to 3.9% from 4.0% during the same period, and the ongoing improvement in the labor market may encourage the RBA to deliver a series of rate hikes over the coming months as the central bank acknowledges that “there is no contemporary experience as to how labour costs and prices in Australia would behave at an unemployment rate below 4 per cent.”
In turn, AUD/USD may stage a larger recovery ahead of the next RBA meeting on June 7 as Governor Philip Lowe and Co. prepare Australian households and businesses for higher interest rates, and a further advance in the exchange rate may alleviate the tilt in retail sentiment like the behavior seen earlier this year.

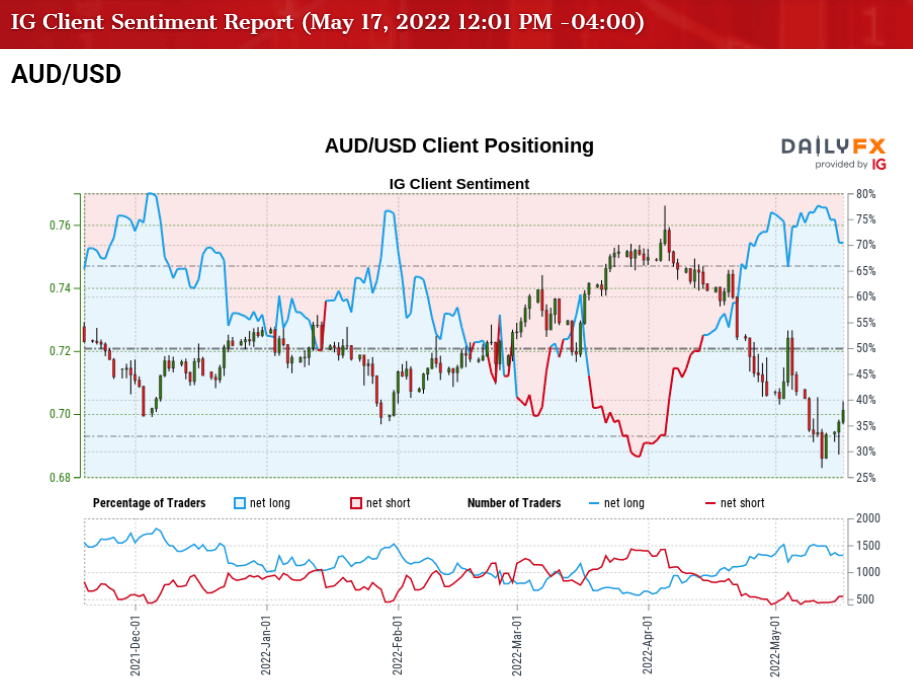
The IG Client Sentiment report shows 66.17% of traders are currently net-long AUD/USD, with the ratio of traders long to short standing at 1.96 to 1.
The number of traders net-long is 6.18% lower than yesterday and 15.62% lower from last week, while the number of traders net-short is 12.24% higher than yesterday and 26.92% higher from last week. The decline in net-long position comes as AUD/USD climbs to a fresh weekly high (0.7041), while the jump in net-short interest has helped to alleviate the crowding behavior as 74.02% of traders were net-long the pair last week.
With that said, another uptick in Australia Employment may fuel the recent series of higher highs and lows in AUD/USD as it fuels speculation for another RBA rate hike, but the rebound from the yearly low (0.6829) may turn out to be a correction in the broader trend with the Federal Reserve on track to normalize monetary policy at a faster pace.
AUD/USD RATE DAILY CHART
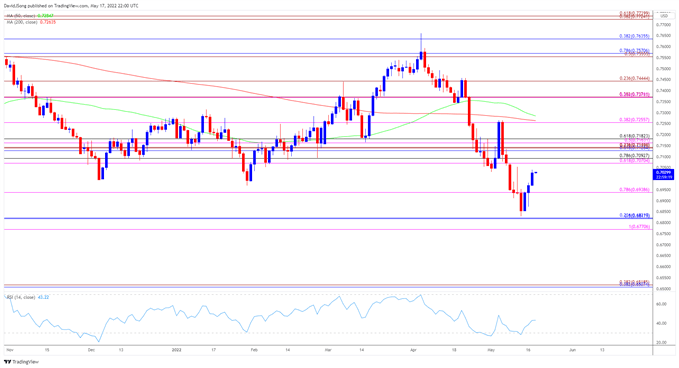
Source: Trading View
- Keep in mind, AUD/USD took out the July 2020 low (0.6877) after snapping the opening range for May, but the exchange rate appears to have reversed course June 2020 low (0.6648) as the recent rebound in price pulls the Relative Strength Index (RSI) out of oversold territory.
- AUD/USD carves a series of higher highs and lows amid the lack of momentum to break/close below the Fibonacci overlap around 0.6770 (38.2% expansion) to 0.6820 (50% retracement), with the move above the 0.6940 (78.6% expansion) area bringing the 0.7070 (61.8% expansion) to 0.7090 (78.6% retracement) region on the radar.
- Next area of interest comes in around 0.7130 (61.8% retracement) to 0.7180 (61.8% retracement) followed by the 0.7260 (38.2% expansion) region, which largely lines up with the 200-Day SMA (0.7265).
Follow me on Twitter at @DavidJSong
DailyFX provides forex news and technical analysis on the trends that influence the global currency markets.
DISCLOSURES
David Song, Currency Strategist, Daily FX
May 18, 2022 -
US STOCKS OUTLOOK:
- S&P 500, Nasdaq 100 and Dow Jones post solid gains on Tuesday
- Strong April U.S. retail sales data helps improve market sentiment and morale
- This article looks at the key technical levels to watch for in the Nasdaq 100 over the coming days
Most Read: Big Mistake Leads Technical Trader to Top Three Tools
After a subdued performanceat the start of the week, U.S. stocks rallied on Tuesday, buoyed by improved investor morale, on hopes that the worst is over in terms of the recent sell-off and that risk assets will begin to stabilize in the near term.
At the closing bell, the S&P 500 jumped 2.02% to 4,088, its best level in almost three weeks. The Dow, for its part, rose for the third day in a row, climbing 1.34% to 32,654, boosted by strong performances by Goldman Sachs, Home Depot and Boeing shares. Meanwhile, the Nasdaq 100 led the charge higher on Wall Street, soaring 2.62% to 12,564 on account of broad-based tech sector strength.
Although stocks were already advancing in the pre-market session, gains accelerated after April U.S. retail sales data showed that American consumers kept their wallets open and maintained robust consumption despite rising inflation and falling real income. The solid numbers suggest that household spending, the main driver of economic growth in the country, remains resilient and can continue to support the expansion over the medium term, a good sign for second-quarter GDP and possibly beyond.
In the afternoon, Fed Chair Powell’s comments on the central bank's tightening cycle and his strong resolve to restore price stability sparked volatility and briefly weakened the rally, but the reaction was temporary and ultimately reversed. After all the twists and turns, the three major equity benchmarks ended the session near their daily highs.
Looking ahead, the economic calendar is thin for the rest of the week, so sentiment will likely dictate direction. That said, Tuesday’s upswing is welcome, but it doesn't change the fact that stocks are still down a lot so far this year and that the near-term trend remains negative in terms of technical analysis.
In any case, to further improve sentiment and confirm that this is not another dead cat bounce, we would need to see a follow-through to the topside in the coming days. That will tell us that there is more confidence in the market and in the belief that the Fed will be able to engineer a soft landing of the economy.
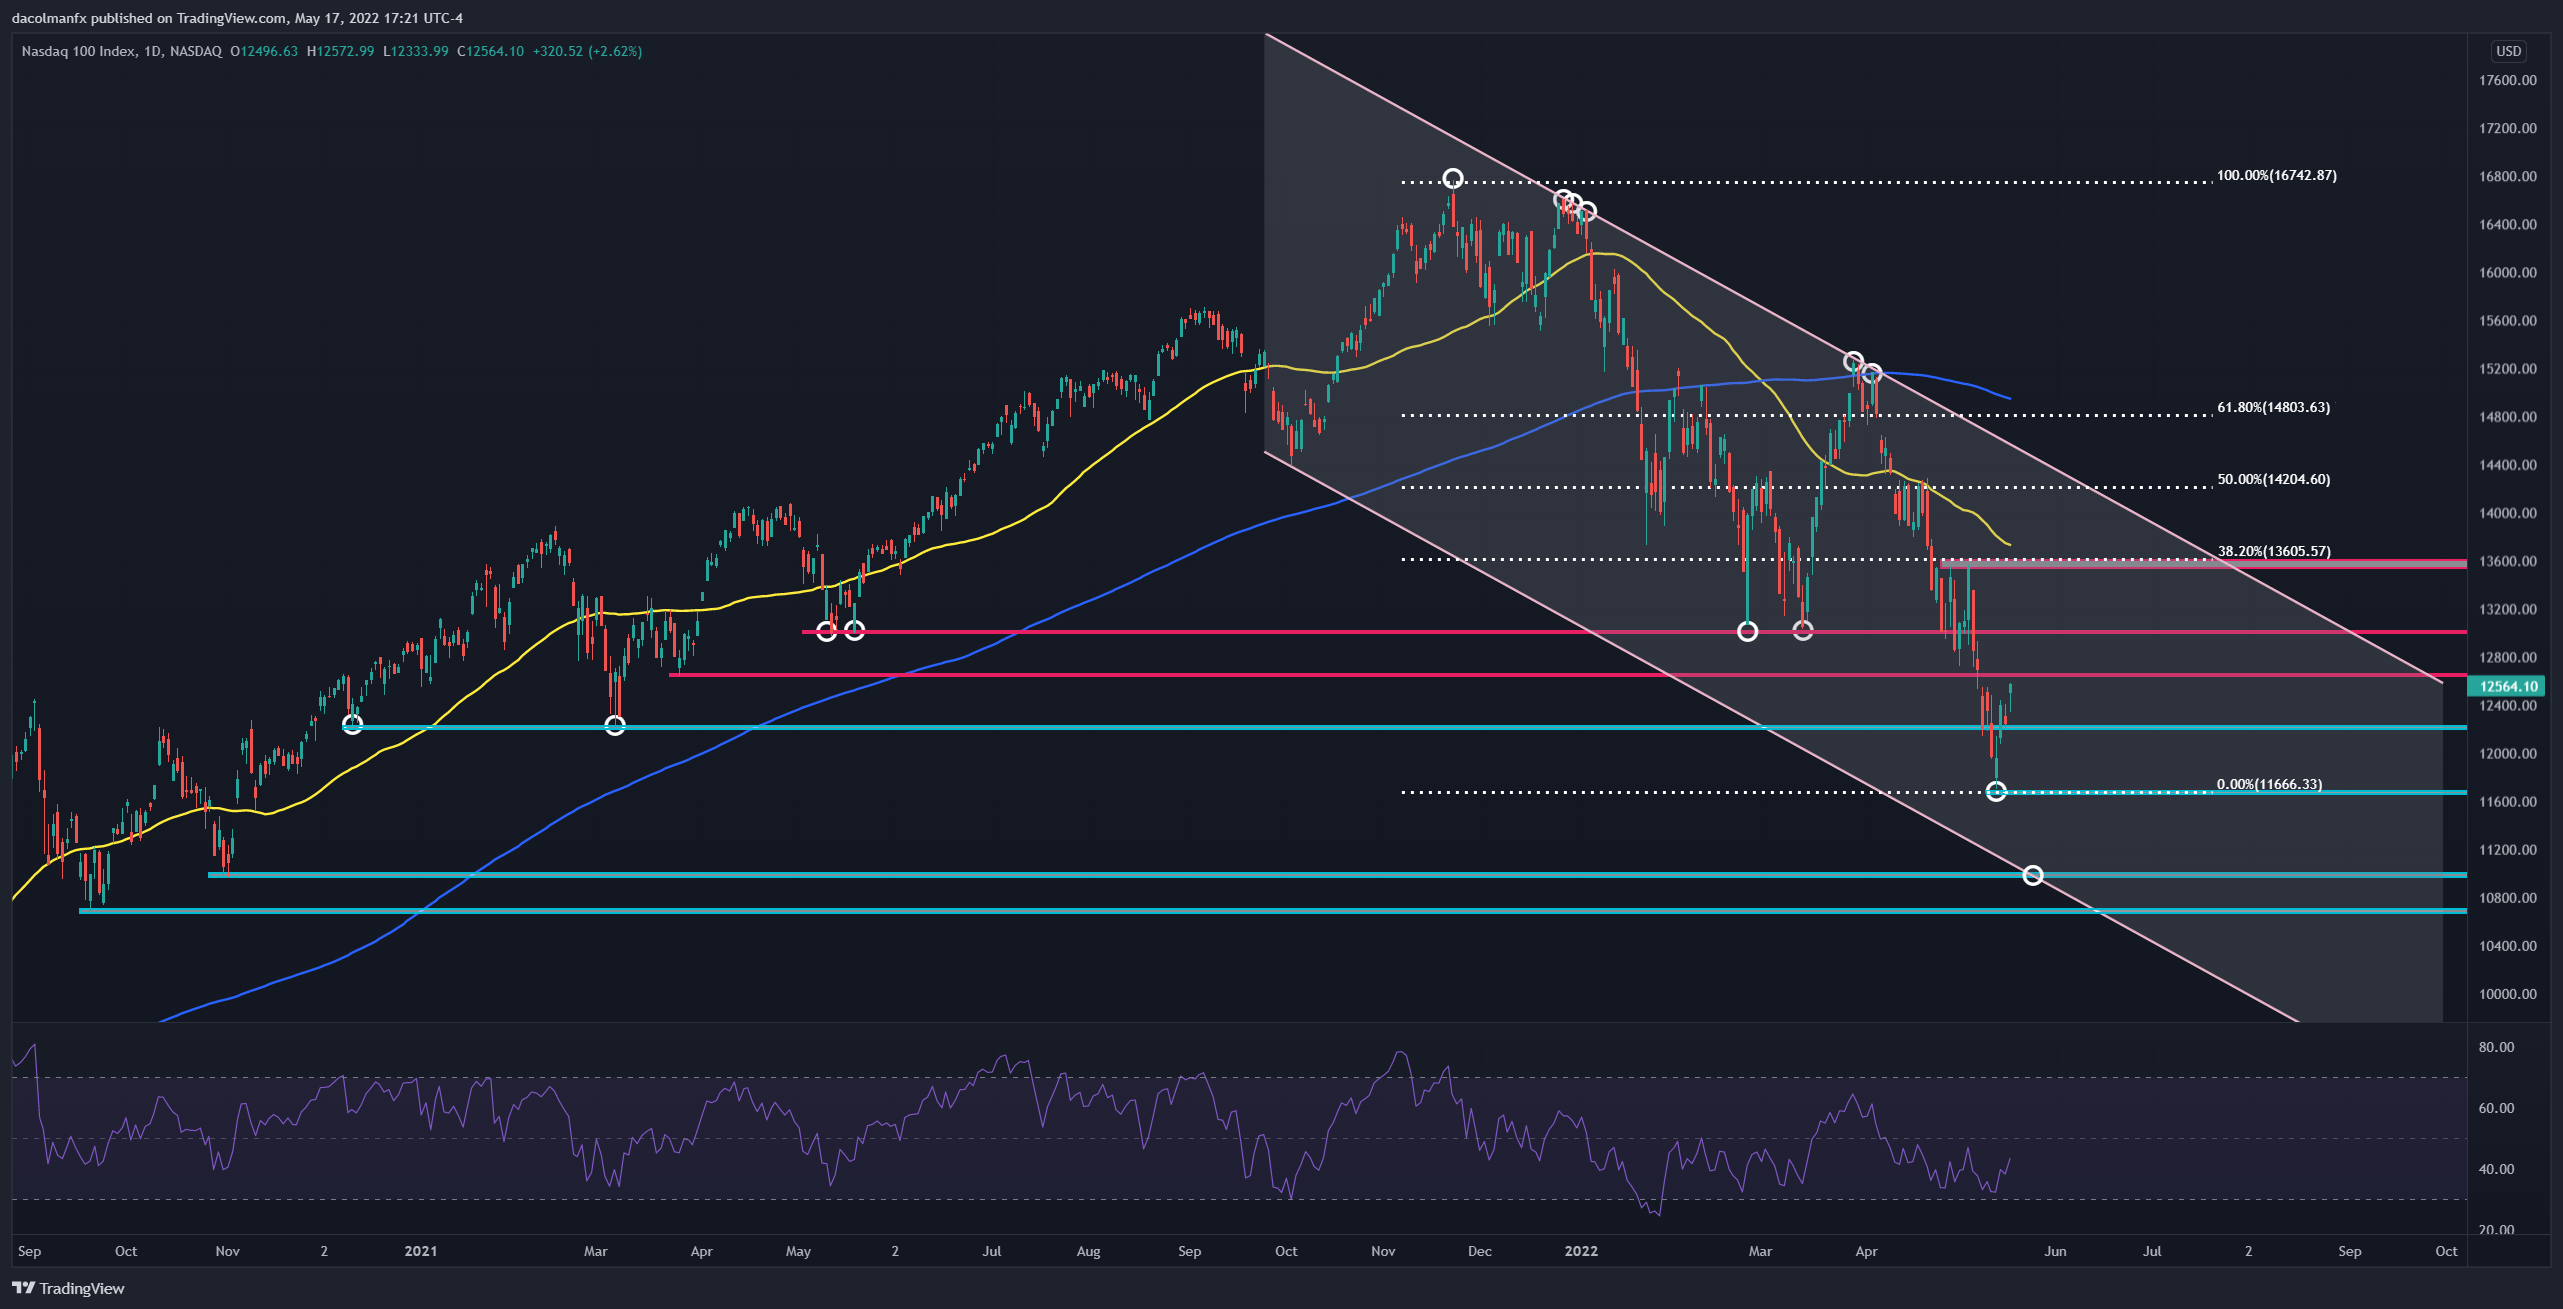
Focusing on the Nasdaq 100, despite the recent rebound, the tech index remains in bear market, down more than 25% from its November 2021 peak. For buying momentum to accelerate under current conditions, price must overcome the next critical resistance at 12,645. If we see a clear break above this barrier, the focus shifts up to the psychological 13,000 level, followed by 13,605, the 38.2% Fibonacci retracement of the 2021/2022 selloff.
On the flip side, if sellers return to fade the rip and price turns lower, support lies at 12,200. If this floor is breached, a retest of the 2022 lows cannot be ruled out.
NASDAQ 100 TECHNICAL CHART

Nasdaq 100 Chart Prepared Using TradingView
EDUCATION TOOLS FOR TRADERS
- Are you just getting started? Download the beginners’ guide for FX traders
- Would you like to know more about your trading personality? Take the DailyFX quiz and find out
- IG's client positioning data provides valuable information on market sentiment. Get your free guide on how to use this powerful trading indicator here.
Diego Colman, Market Analyst, Daily FX
May 18, 2022 -
5 hours ago, Monkhouse95 said:
Hi All,
I'm expected to move to Australia in July and have an ISA account with IG. Looking around it sounds like I can keep my ISA account here in the UK, my only limitation is that I wont be able to add any further funds to the account.
I've spoken to a few people at IG helpdesk and I keep getting different answers, some advise I'd have to close my account immediately and sell all positions before moving to Australia (which would be a massive pain) and others have said I will have no issues keeping my account and advised I just wouldn't be able to add further funds or buy new positions. I would however be able to carry on holding and sell any positions at a later date.
Has anyone had any experience with this or can someone from IG give me a definitive answer because it's becoming very stressful now!
Thanks in advance
Jack
Hi @Monkhouse95,
Thank you for your post.
If you have a Share trading account the below applies:
UK to Australia: It is easier to open a share dealing account with the Australian office, the UK one would be closed after the shares are moved across.For an ISA account the below applies:
For most countries besides the EU you can keep the ISA and continue to trade with the existing funds. However you will be prohibited from further subscriptions i.e. adding funds.
The exception to this is a move to the US. Due to restrictions and what we can offer you would either need to transfer out or positions would be closed.
For further information it would be best to reach out to helpdesk.uk@Ig.com or call 0800 195 3100.
All the best - Arvin-
1
-
-
9 hours ago, HarryP said:
Got my answer from Reddit, but apparently what i missed and the IG people failed to mentioned was the Withholding Tax, Since my stock investments where in the US there was still a 30% Tax on the US side for all Dividends.
1 hour ago, gezmond said:Most (if not all ) investment platforms get you to fill in a W8 (W-8BEN) form before they let you buy US shares , do you remember filling one in? this reduces the divi withholding tax from 30% to 15% . The tax free allowance for divis you mentioned doesn't apply in an ISA, if you had a huge account with divis of a million you wouldn't pay any tax to inland revenue....in fact you don't even have to record ISA income on a tax return
Hi @HarryP, @gezmond,
When you trade US shares you should have a pop up window prompting you to complete the W8-BEN form.
If not you can find the form here:
https://www.ig.com/uk/us-stocksFurther information on:
https://www.ig.com/uk/help-and-support/investments/share-dealing-and-isas/what-is-a-w8ben-form-and-why-do-i-need-one
If your form is expired, you can complete the form on My IG > Settings > Dealing US stocks:
I hope that it helps - Arvin -
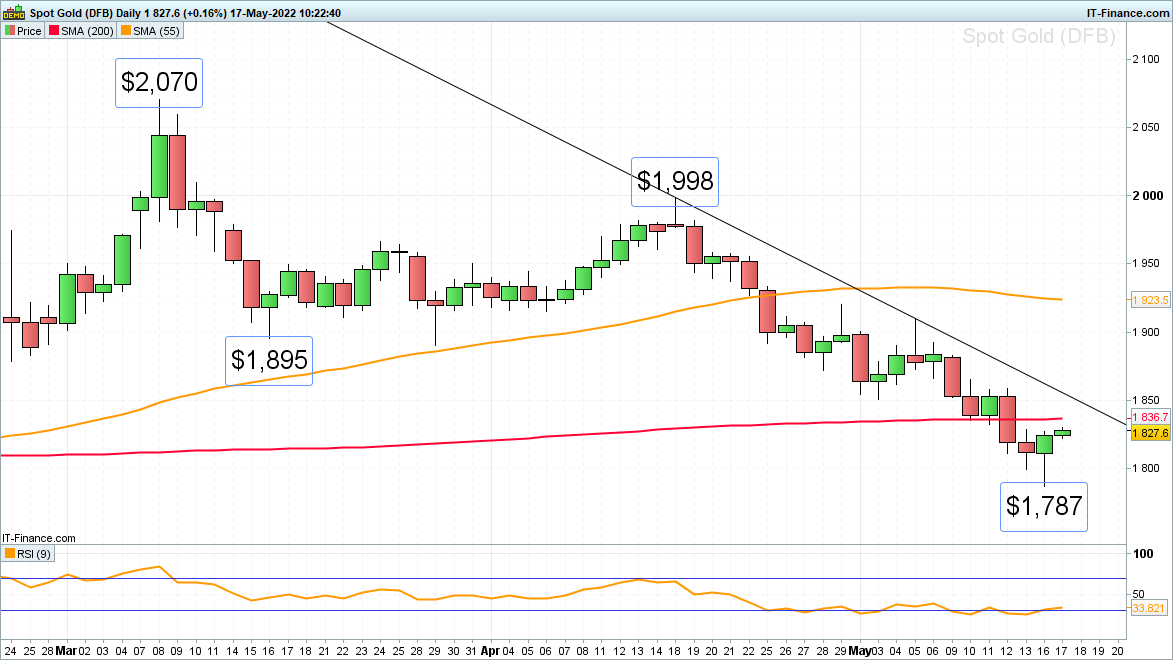
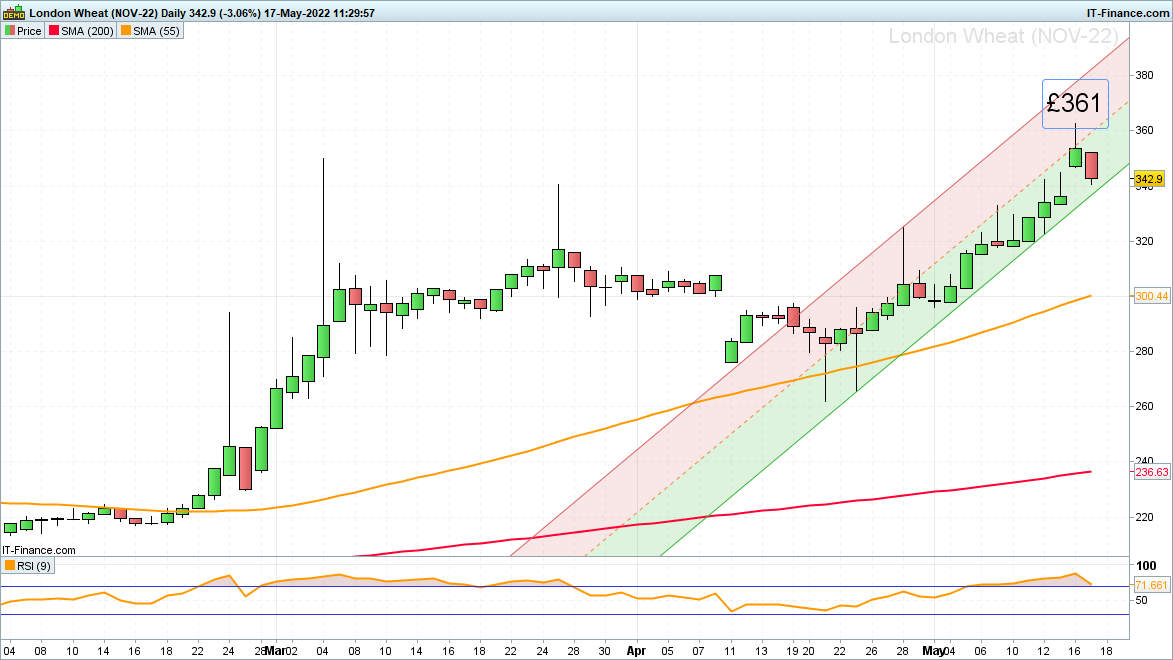
The outlook on gold is cautiously bullish while crude oil probes resistance at $114 and London wheat pauses below its £361 all-time high.
Gold stages a minor recovery rally
Gold’s slip from its mid-April high at $1,998 has taken it all the way to yesterday’s low at $1,787 before it formed a Hammer on the daily candlestick chart and recovered towards the 200-day simple moving average (SMA) at $1,837 which is about to be reached.
Next up the early May low can be spotted at $1,851 and the April-to-May downtrend line at $1,855 which may well cap again, however.
Yesterday’s low was made right within the late December-to-January lows at $1,790 to $1,781 which unsurprisingly offered support. Failure at $1,781 would engage the December low at $1,754.
While the late April high at $1,919 caps, the recent downtrend remains intact.
Further up meanders the 55-day SMA at $1,923.
 Source: ProRealTime
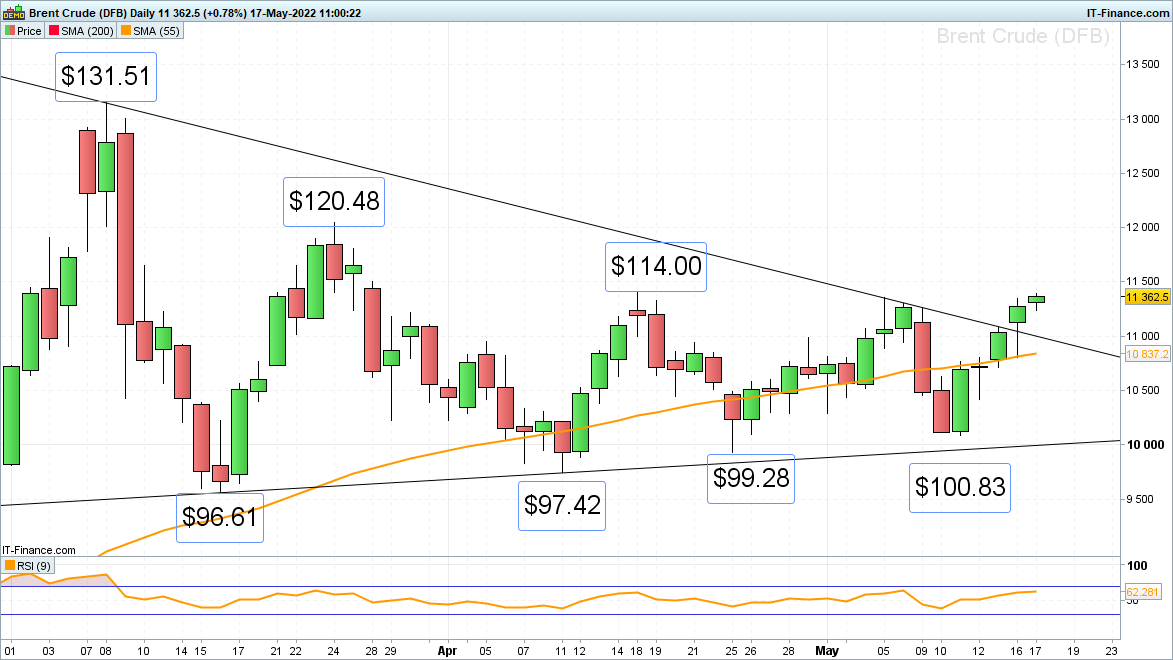
Brent crude oil flirts with $114 April high as traders eye EU ban
The price of Brent crude oil continues to be underpinned by robust global demand as traders closely watch developments around a proposed EU ban on Russian oil which would tighten global supply further.
Yesterday the European Union (EU) failed to pressure Hungary to lift its veto of a proposed oil embargo on Russia but despite this the price of Brent crude oil has risen four days in a row.
It is being pushed towards its $114.00 April peak, a rise and daily chart close above which would lead to the late March high at $120.48 being next in line.
If the price of oil were to struggle around the $114 mark, however, and slip back, the breached March-to-April downtrend line at $110.05 and also the 55-day SMA at $108.38 would be back in the frame.
For now the bulls seem to be firmly in charge, though.
 Source: ProRealTime
London wheat prices are briefly coming off their all-time highs
Yesterday November 2022 London Wheat futures traded at their highest ever level of £361 per tonne after India announced on Saturday that it was closing its doors on wheat exports to cool local prices and ensure its supplies as a scorching heatwave curtailed output.
This comes on the back of adverse crop conditions in Europe and the US on top of the war in Ukraine and has pushed the price of London wheat up by over 50% since the Russian invasion of Ukraine.
The November 2022 contract has come off yesterday’s all-time high at £361 and closed a price gap from last week whilst remaining within its steep one-month uptrend channel.
The lower channel line at £337 is likely to act as interim support, together with the 9 May high at £333.
A rise above the £361 high seen yesterday may lead to the minor psychological 400 mark being targeted.
-
4 hours ago, rotarymotor said:
@ArvinIG Is there a timescale for this to be added to ISA accounts? I notice this was a feature introduced into beta in 2019 for leveraged accounts.
Hi @rotarymotor,
The Trade analytics feature is in a Beta stage, the development team is adding functions and it is only available to CFD accounts.
I will raise your feedback to add this tool for share trading and ISA accounts. I haven't heard about a time frame at this point.
All the best - Arvin -
1 hour ago, AlanT said:
Hi There,
I have recently come across this MT4 platform and curious how does it work, have created a demo platform but have no idea how to use it.
would appreciate if someone would be able to guide me for that.
Hi @AlanT,
Thank you for your post. You will need to download MT4 and login using your IG credential on the IG demo server.
I would recommend reading through this page below:
https://www.ig.com/sg/trading-platforms/metatrader-4/what-is-mt4-how-to-use-it
I hope that it helps - Arvin -
On 16/05/2022 at 01:05, BubbaBubbaBubba said:
Name of stock - Smith-Midland Corporation
Name of Stock Exchange - NASDAQ
Leverage or Share dealing - ISA
Ticker - SMID
Country of the stock - USA
Hi @BubbaBubbaBubba,
SMID should be live now.
Thank you - Arvin


SP500 maximum bet size
in Indices and Macro Events
Posted
Hi @MarketInvestor1983
Thank you for your post.
The maximum consideration should be GBP 25,000, over that amount you will need to call in to place a deal.
All the best - Arvin