

ArvinIG
-
Posts
1,728 -
Joined
-
Last visited
-
Days Won
23
Content Type
Profiles
Forums
Blogs
Events
Community Tutorials
Store
Posts posted by ArvinIG
-
-
14 hours ago, BubbaBubbaBubba said:
Name of stock - Smith-Midland Corporation
Name of Stock Exchange - NASDAQ
Leverage or Share dealing - ISA
Ticker - SMID
Country of the stock - USA
Hi @BubbaBubbaBubba,
Your request has been submitted
All the best - Arvin -
On 14/05/2022 at 01:51, NickW-uk said:
As I switch between watchlists, charts have started losing their saved indicators (typically Bollinger Bands, MACD, Volume, RSI).
Hi @NickW-uk,
Thank you for your post.
We haven't received similar feedback from other clients. Could you please try to delete your cookies and empty your cache?
Does it happen on other browser?
Feel free to reach out to helpdesk.uk@ig.com, our IT team might have solution for the issue your are facing.
All the best - Arvin -
On 29/02/2020 at 05:30, Jacko said:
how are we supposed to hide the annoying crosshair on the web platform ? been asking about this for years.
On 22/10/2020 at 23:15, David78 said:Yes .... How do we hide the crosshair?
On 15/05/2022 at 07:04, macbutter said:We cannot it is there by default unfortunately. Very distracting.
Hi All,
Thank you for your posts.
You can't remove the crosshair on the charts. I will forward your feedback to the relevant department to be reviewed.
All the best - Arvin -
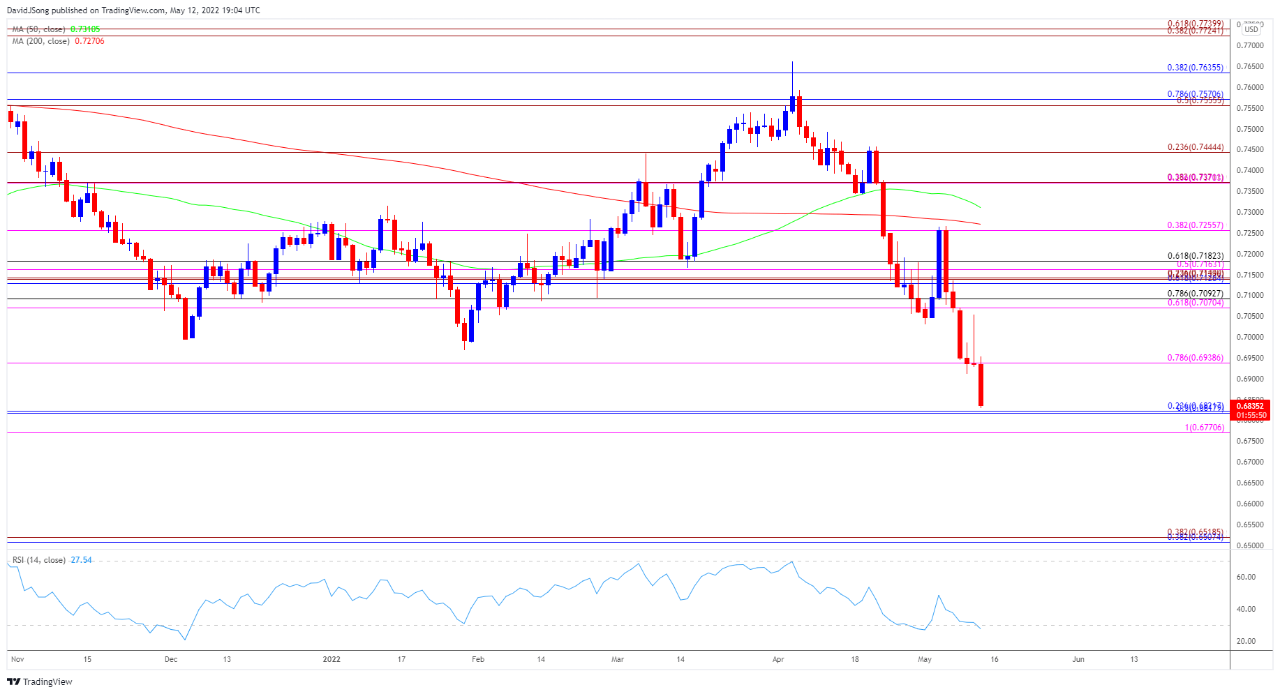
AUD/USD takes out the July 2020 low as the ongoing deterioration in risk appetite continues to drag on commodity bloc currencies. The move below 30 in the RSI is likely to be accompanied by a further decline in the exchange rate.
Source: BloombergAUD/USD rate selloff pushes RSI back into oversold territory
AUD/USD trades to a fresh yearly low (0.6834) with the US stock market on track to enter a bear market, and current market themes may push the exchange rate towards the June 2020 low (0.6648) as major central banks alter the course for monetary policy in an effort to tame inflation.
Looking ahead, it seems as though the Federal Reserve will continue to move ahead of its Australian counterpart as Chairman Jerome Powell reveals that 'there is a broad sense on the Committee that additional 50 basis point increases should be on the table at the next couple of meeting,' and expectations for a further shift in Fed policy may keep the US dollar afloat as the Federal Open Market Committee (FOMC) plans to wind down its balance sheet starting in June.
Meanwhile, the Reserve Bank of Australia (RBA) appears to be on a more gradual path in normalizing monetary policy as the 'Board does not plan to reinvest the proceeds of maturing government bonds' and it seems as though Governor Philip Lowe and Co. will allow its holding to naturally roll off its balance sheet as the central bank 'is not currently planning to sell the government bonds that the Bank purchased during the pandemic.'
In turn, expectations for another 50bp Fed rate hike may keep AUD/USD under pressure ahead of the next RBA rate decision on June 7 amid the deterioration in risk appetite, and a further decline in the exchange rate may fuel the tilt in retail sentiment like the behavior seen during the previous year.
 Source: TradingView
The IG Client Sentiment report shows 74.02% of traders are currently net-long AUD/USD, with the ratio of traders long to short standing at 2.85 to 1.
The number of traders net-long is 8.09% higher than yesterday and 22.30% higher from last week, while the number of traders net-short is 7.50% higher than yesterday and 19.50% lower from last week. The crowding behavior has eased from earlier this week despite the rise in net-long interest as 75.68% of traders were net-long AUD/USD earlier this week, while the decline in net-short position comes as the exchange rate trades to a fresh yearly low (0.6834).
With that said, AUD/USD may attempt to test the June 2020 low (0.6648) amid the weakness across commodity bloc currencies, and a move below 30 in the RSI is likely to be accompanied by a further decline in the exchange rate like the price action seen earlier this month.
 Source: TradingView
David Song | Analyst, DailyFX, New York City
13 May 2022
This information has been prepared by DailyFX, the partner site of IG offering leading forex news and analysis. In addition to the disclaimer below, the material on this page does not contain a record of our trading prices, or an offer of, or solicitation for, a transaction in any financial instrument. IG accepts no responsibility for any use that may be made of these comments and for any consequences that result. No representation or warranty is given as to the accuracy or completeness of this information. Consequently any person acting on it does so entirely at their own risk. Any research provided does not have regard to the specific investment objectives, financial situation and needs of any specific person who may receive it. It has not been prepared in accordance with legal requirements designed to promote the independence of investment research and as such is considered to be a marketing communication. Although we are not specifically constrained from dealing ahead of our recommendations we do not seek to take advantage of them before they are provided to our clients. -
On 27/04/2022 at 19:14, patiscoming said:
Hi everyone.
I just started using MT4, trading AUS200.
Does anyone have problems with a "not enough money " error when making an order? And does anyone have a solution?
if you see my screenshot below, trying to buy 0.01 lots gives me an error, even though it shoes more than $300 free margin in the below part of the screenshot.

Thanks for your help,
Pat
Hi @patiscoming,
On My IG, you can double check the balance on your account and transfer funds from one account to another if necessary. It is possible that some of your funds was put aside if you open an order, as the funds need to be available if the order is triggered to open the position.
Have you managed to place your deal?
Thank you - Arvin -
1 hour ago, Que said:
Hi everyone,
Can I ask about the AIZ right issue? It has been more than a month from their capitalization starting and my right issue of 5,000 shares are still non tradable with the value of $0. Are there anyone know what is going on and should I take any actions?
Thank you.
Hi @Que,
Thank you for your post, I believe that the AIZ rights ere not expected to trade. The right issue was also scaled back.
If you received an email from the Corporate Action team, it would be best to ask them directly as they are the team that have all the relevant information on Corporate actions.
All the best - Arvin
-
On 04/05/2022 at 03:25, veerbajaj said:
Can I Know the New Policy regarding New Order Limit in FANG Index during 21:00 -9:00. Although I have Professional Status but Order limit is 2 Lots.
Please Reply
Hi @veerbajaj,
The best way to get an answer would be to reach out directly to helpdesk.uk@ig.com or use our live chat feature on the IG website.
All the best - Arvin -
Gold gains as CPI data hints that inflation may have peaked; US producer price index (PPI) may sway bullion prices further and XAU climbs above January high, potentially fueling further gains.

Source: BloombergGold prices staged a rebound overnight after inflation cooled slightly in the United States, according to the latest consumer price index (CPI) for April. The CPI crossed the wires at 8.3% on a year-over-year basis. That was higher than the 8.1% Bloomberg consensus estimate. However, it was slightly lower from March’s 8.5% y/y figure.
The reaction in gold was likely due to the Treasury market’s behavior. Real yields – a major driver for bullion prices, fell following the CPI print. Lower real yields benefit gold because it is a non-interest-bearing asset, which lowers the opportunity cost of gold. The 10-year inflation-indexed rate fell 15-basis points overnight but remain in positive territory. The yellow metal may continue to gain if real yields drop further.
Tonight will bring the US’s producer price index (PPI) data for April. Analysts see PPI cooling to 0.5% on a month-over-month basis, according to a Bloomberg survey. That would be down from 1.4%, representing a rather significant drawdown. That may help to calm inflationary fears, as factory-gate prices are sometimes seen as a leading indicator for downstream inflation. Gold may move higher if tonight’s data comes in below expectations.
XAU/USD technical forecast
Gold prices are moving above the January swing high through Asia-Pacific trading, a level that has previously provided support. Holding that level may ignite further bullish energy to drive prices higher. If so, the falling 20-day Simple Moving Average (SMA) may cap upside. Meanwhile, MACD and the RSI oscillators appear to be improving.
XAU/USD daily chart
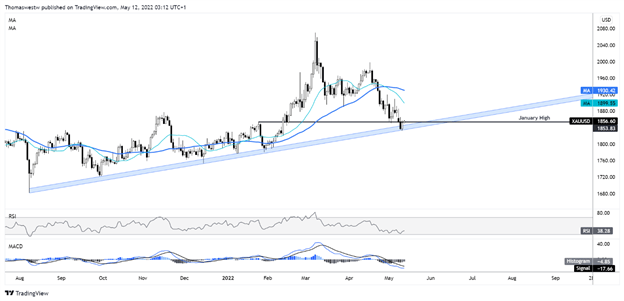
Source: TradingViewThomas Westwater | Analyst, DailyFX, New York City
12 May 2022
This information has been prepared by DailyFX, the partner site of IG offering leading forex news and analysis. In addition to the disclaimer below, the material on this page does not contain a record of our trading prices, or an offer of, or solicitation for, a transaction in any financial instrument. IG accepts no responsibility for any use that may be made of these comments and for any consequences that result. No representation or warranty is given as to the accuracy or completeness of this information. Consequently any person acting on it does so entirely at their own risk. Any research provided does not have regard to the specific investment objectives, financial situation and needs of any specific person who may receive it. It has not been prepared in accordance with legal requirements designed to promote the independence of investment research and as such is considered to be a marketing communication. Although we are not specifically constrained from dealing ahead of our recommendations we do not seek to take advantage of them before they are provided to our clients. -
The Nikkei 225, ASX 200 and Hang Seng Index are bracing for more volatility as another stronger-than-expected US inflation report bolstered hawkish Federal Reserve policy expectations.
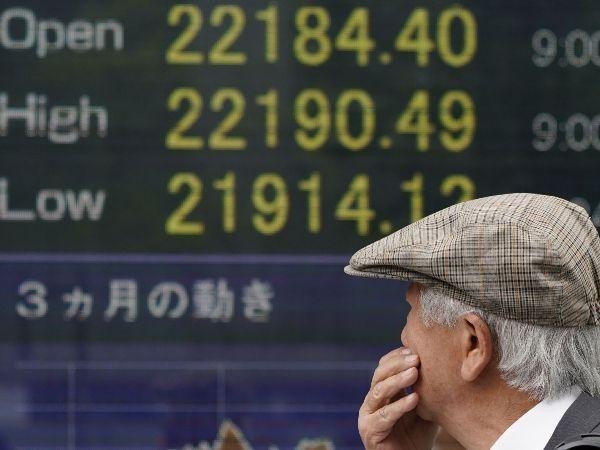
Source: BloombergWednesday’s Wall Street trading session recap
Volatility on Wall Street continued to batter the major benchmark stock indices on Wednesday, placing the Nikkei 225, ASX 200 and Hang Seng at risk next. Looking at the chart below, the majority of S&P 500 sectors closed in the red. The top three worst-performing components were consumer discretionary, information technology and communication services, falling 3.57%, 3.3% and 1.51% respectively.
The key culprit was another hotter-than-expected inflation report out of the United States. Headline CPI crossed the wires at 8.3% y/y in April, which was down from 8.5% in March. Still, this was much stronger than the 8.1% consensus. The core measurement, which strips out volatile food and energy prices, also surprised to the upside. It clocked in at 6.2% y/y versus 6.0% seen, down from 6.5% prior.
This will continue to keep the Federal Reserve on its toes as it attempts to bring inflation down toward the longer-term average target of 2.0%. Moreover, the markets increased their expectations for a fourth 50-basis point hike this year. Meanwhile, the central bank is about to begin unwinding its balance sheet, further reducing liquidity conditions in financial markets.
Thursday’s Asia-Pacific trading session
Thursday’s Asia-Pacific trading session is looking to be fairly light on data. Australia will release consumer inflation expectations. This could keep traders glued on broader fundamental themes and focus on general market sentiment. As such, it could be another disappointing round for indices such as the Nikkei 225, ASX 200 and Hang Seng Index as investors around the world continue to face the reality of tightening credit conditions.
Nikkei 225 technical analysis
The Nikkei 225 confirmed a breakout under the 38.2% Fibonacci extension at 26103, exposing the midpoint at 25377 before the March low at 24505 comes into focus. Guiding the index lower seems to be a combination of a long-term falling trendline from September, and a near-term one from late March. These could reinstate the downside focus in the event of a turn higher.
Nikkei 225 daily chart
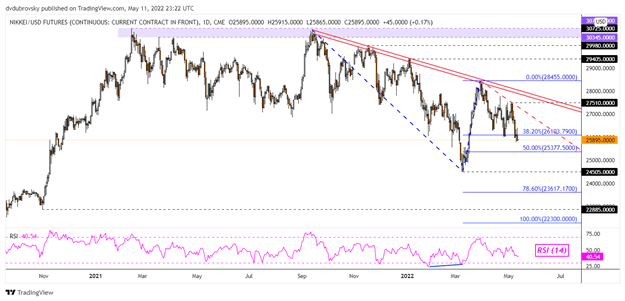
Source: TradingViewASX 200 technical analysis
The ASX 200 has been struggling to hold a push under the 100% Fibonacci extension at 7007. Recently, prices left behind a Long-Legged Doji candlestick. This is a sign of indecision. Upside progress could signal further gains to come. Still, clearing lower exposes the wide 6747 – 6894 support zone before the March 2021 low nears. In the event of a turn higher, keep a close eye on the falling trendline from April.
ASX 200 daily chart
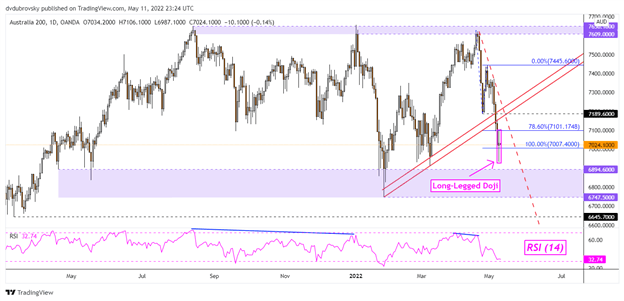
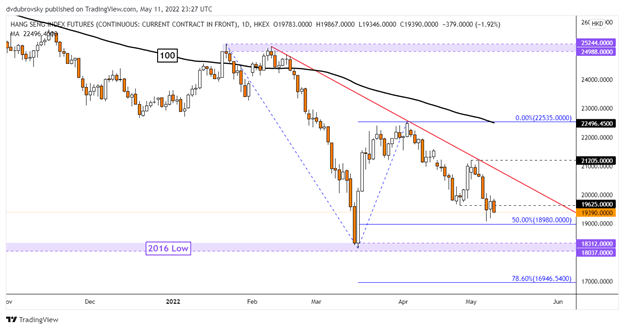
Source: TradingViewHang Seng technical analysis
The Hang Seng Index is attempting to hold a push under the April low at 19625, with immediate support below as the midpoint of the Fibonacci extension at 18980. Below the latter sits the March low which is closely aligned with the 2016 bottom at 18037. In the event of a turn higher, the falling trendline from February could maintain a dominant downside focus.
Hang Seng Futures daily chart
Source: TradingViewDaniel Dubrovsky | Currency Analyst, DailyFX, San Francisco
12 May 2022
This information has been prepared by DailyFX, the partner site of IG offering leading forex news and analysis. In addition to the disclaimer below, the material on this page does not contain a record of our trading prices, or an offer of, or solicitation for, a transaction in any financial instrument. IG accepts no responsibility for any use that may be made of these comments and for any consequences that result. No representation or warranty is given as to the accuracy or completeness of this information. Consequently any person acting on it does so entirely at their own risk. Any research provided does not have regard to the specific investment objectives, financial situation and needs of any specific person who may receive it. It has not been prepared in accordance with legal requirements designed to promote the independence of investment research and as such is considered to be a marketing communication. Although we are not specifically constrained from dealing ahead of our recommendations we do not seek to take advantage of them before they are provided to our clients. -
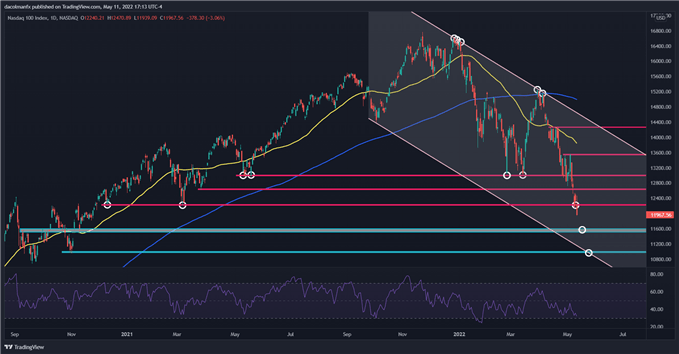
S&P 500, Nasdaq 100 and Dow Jones sink after U.S. inflation data tops estimate and elevated price pressures in the economy may prompt the Fed to continue front-loading interest rate hikes in its coming monetary policy meetings.
Source: BloombergU.S. stocks suffered steep losses on Wednesday amid growing headwinds for the U.S. economy and increasingly lower risk-appetite on Wall Street. At the closing bell, the S&P 500 plunged 1.65% to 3,935, its weakest level since March 2021. The Dow Jones, for its part, fell 1.02% to 31,834, a new low for the year. Elsewhere, the Nasdaq 100 bore the brunt of the sell-off and plummeted 3.06% to 11,967 amid a major rout in the tech universe, with Apple, Microsoft and Amazon all plunging into free fall.
Although equity futures were trading sharply higher in the pre-market session, the upbeat sentiment shifted and did a 180-degree turn after the U.S. consumer price index for April delivered another negative surprise. For context, annual CPI cooled down to 8.3% from 8.5% in March, but the result came in two-tenths of a percent above expectations, a sign that broader price pressures are not yet easing significantly. The core indicator also topped consensus forecasts, printing at 6.3% year-over-year, only a modest decline from the 6.5% advance recorded at the end of the first quarter.
While the directional improvement in the headline and core gauge are welcome, Wednesday's data served as a firm reminder that the U.S. central bank has a long road ahead and a difficult path to restore price stability. Looking ahead, favourable base effects should help push year-over-year inflation numbers down, but with the underlying trend running well above desirable levels, the Fed is likely to retain a hawkish bias and continue to front-load interest rate hikes over the next couple of meetings to bring monetary policy to a neutral stance expeditiously.
Overall, with inflation hovering at four-decade highs, it is possible we have not yet reached peak hawkishness in central bank policy outlook. Against this backdrop, US Treasury yields may push higher in the near term, fueling recession fears and weighing on investors’ mood. In this environment, risk appetite will remain weak, preventing a meaningful equity market recovery. In fact, we may continue to witness the recent ‘sell the rip phenomenon,’ where traders fade any rally for fear that stocks will struggle to maintain gains.
NASDAQ 100 technical analysis
After a significant drop on Wednesday, the Nasdaq 100 broke below a key support in the 12,210 and fell to a new 2022 low near 11,967. With the tech index in bear market and firmly biased to the downside, sellers could target the 11,600 level in the coming sessions. On further weakness, the next floor to consider appears around the 11,000-mark. On the flip side, if dip buyers return and manage to push the benchmark higher, initial resistance comes in at 12,210, followed by 12,645. If these hurdles are cleared, the focus shifts up to the 13,000 area.
Source: TradingViewIG Analyst
12 May 2022
This information has been prepared by DailyFX, the partner site of IG offering leading forex news and analysis. In addition to the disclaimer below, the material on this page does not contain a record of our trading prices, or an offer of, or solicitation for, a transaction in any financial instrument. IG accepts no responsibility for any use that may be made of these comments and for any consequences that result. No representation or warranty is given as to the accuracy or completeness of this information. Consequently any person acting on it does so entirely at their own risk. Any research provided does not have regard to the specific investment objectives, financial situation and needs of any specific person who may receive it. It has not been prepared in accordance with legal requirements designed to promote the independence of investment research and as such is considered to be a marketing communication. Although we are not specifically constrained from dealing ahead of our recommendations we do not seek to take advantage of them before they are provided to our clients. -
3 hours ago, alex9686 said:
Dear IG
In relation to the Magellan Group bonus options, I wrote to Corporate Actions to say "I would like to subscribe to the Magellan Financial Group bonus issue."
On this advice, IG exercised the options for me.
I did not want to exercise the options, I simply wanted to be able to have the options available to me.
I did not want to exercise the options immediately - and I believe IG has exercised these options for me without my express consent.
I would like this to be reversed please.
Regards
Alex
Hi @alex9686,
Please reach out to helpdesk.au@ig.com or reply to the email you sent to the corporate action team. Only that specific team will be able to assist you.
Thank you - Arvin-
 1
1
-
-
1 hour ago, JohnA said:
I cannot work out how to add a SSL Channel indicator to MT4 on a Mac. Can anyone help?
Hi @JohnA,
You will need to log into your MT4 platform , go to File then Open Data Folder. Once you locate the indicator folder. Once located copy and paste the indicator in that folder.
I hope that it helps !
All the best - Arvin -
IGTV’s Daniela Sabin Hathorn looks at a few trades around the New Zealand dollar (NZD/USD, GBP/NZD, and AUD/NZD) as the government will put an end to some of the world’s toughest COVID-19 travel restrictions on 31 July.
Daniela Sabin Hathorn | Presenter and Analyst, London | Publication date: Wednesday 11 May 2022 23:52New Zealand to open borders
New Zealand will fully reopen its borders on July 31st, as announce by Prime Minister, Jacinda Arden, on Wednesday.
This brings the date forward by two months as the government’s timeline to lift all remaining COVID-19 restrictions takes place earlier than expected in hopes it will help revive economic activity.
Whilst the country's efforts to reduce the spread of the pandemic has been praised worldwide, it has put a big toll on some of its industries, including tourism, agriculture, and hospitality.
That being said, travellers will still need to go through pre-departure testing before arriving in New Zealand, which many believe will still be a barrier to entry for tourism.
The reaction in the New Zealand dollar has been slightly limited so far but with so many market themes in play at present it may take a while for the re-opening trade to settle in.
NZD/USD
Focusing first on NZD/USD, the pair is up three-quarters of a percent since the close on Tuesday, the first day momentum has opened on the bullish side since last Wednesday.
But considering the move last week was fully brought on by weakness in the USD side of the trade, today is the first daily candlestick to be holding in the green since the 20th of April. Its hard to tell how much of this move higher has been brought on by optimism in the NZD, especially considering the Dollar Index (DXY) is trending lower this morning, but its likely that some optimism has been priced into the kiwi, along with some dip-buying after a brutal month for the pair.
A close above yesterday’s high at 0,6348 would be needed to consider this price reversal more sustainable.
GBP/NZD
For GBP/NZD the story has been a little different.
The pair hasn’t moved in a clear direction as we’ve seen with NZD/USD, with both the NZD and GBP side of the trade showing weakness in recent weeks.
The kiwi is strongly linked to commodity prices which has meant a rather volatile environment for the currency for the last two months, but the lack of a decisive move in the pound, like we’ve seen with USD, has meant GBP/NZD has trended upward since the April 5th lows, but the move hasn’t been homogeneous.
The daily chart shows the pair has seen some strong daily rallies in three occasions since then, but the initial bullish strength lacked momentum in its continuation, leaving it exposed to correction in both the moves higher so far.
Monday’s bullish run failed to reach the ascending trendline resistance the other two daily rallies faced, which means there was already a lack of conviction from buyers to continue propping up its price.
-
On 07/05/2022 at 15:18, Greenhorn said:
Still on demo account. Was trying out CFD forex trading with Guaranteed Stop Loss. Guaranteed Stop Loss is a great feature to have but sadly it is only limited to a maximum of 20 standard contracts or 200 mini contracts for most of the forex pairs I tested on.
While there is clear mention of the premium cost and minimum distance for use of this great feature, there is no distinct mention of the maximum trade size allowed. And I thought this maximum 20 standard contracts is applicable to all products but to my surprise, it does not apply to S&P 500 or US500. I did a test trade size of 50 standard contracts for S&P 500 and it was executed duly.
So, what are the various maximum trade size for different instrument / products?
Hi @Greenhorn,
The maximum contract you can open on a specific market with a Guaranteed stop will depend on liquidity and volatility. Due do risk management, IG can't offer an unlimited amount of contracts with a guaranteed stop.
Therefore that limit is not fixed and depends on the market status.
I hope that it helps - Arvin-
1
-
-
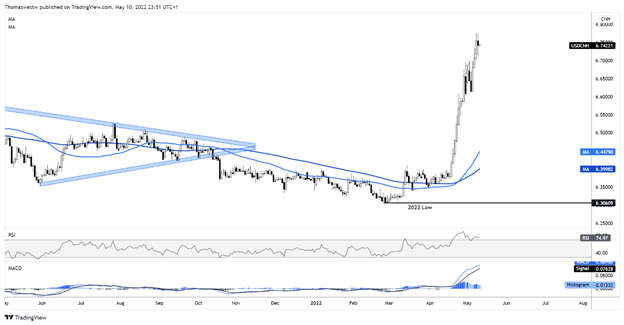
APAC market rebound may be on the table after US session; Chinese CPI data may influence dollar-yuan exchange rate and USD/CNH technical setup may indicate upside exhaustion.
Source: BloombergWednesday’s Asia-Pacific outlook
Asia-Pacific markets may rebound today after selling eased overnight in US markets. The high-beta Nasdaq 100 Index (NDX) gained 1.30% although the Dow Jones Industrial Average shed 0.26%. Meanwhile, commodity prices slipped across most metals and energy products ahead of tonight’s US inflation data. The high-flying US dollar may receive a boost if the print exceeds analysts’ expectations. The Greenback is at multi-year highs versus several major peer currencies, the Chinese yuan included.
Despite the pullback in crude oil prices, which dropped more than 3% overnight, gasoline prices at the pump have hit a record high in the US. That is partly due to refiner capacity being offloaded more to other products such as diesel. The lack of exports from Russia has placed a higher demand on those heavier fuels at a time when some refinery capacity is offline due to scheduled maintenance. That may help to keep prices elevated downstream in the economy as shipping costs rise due to those fuel costs.
The Australian dollar and New Zealand dollar remain depressed amid the pullback in commodity prices. Iron ore prices are trading near their lowest levels since January, while copper prices are setting fresh 2022 lows. Gold prices fell to the lowest since early February as real yields climbed. The US CPI data due out tonight may influence those metal-sensitive yields, although a rebound for the yellow metal looks unlikely in the short term, given ongoing chatter around a potential 75-basis point Fed rate hike.
Today, APAC traders will have their sights on Chinese inflation data. China’s consumer price index (CPI) for April is expected to cross the wires at 1.8% on a year-over-year basis, according to a Bloomberg survey. Last week, Chinese officials doubled down on the country’s aggressive “Covid-Zero” strategy even as public dissent grows and at the risk of inflicting economic damage to the point of a possible recession. Still, a weaker-than-expected print would make it easier to enact further monetary and fiscal support measures in the economy. That may not be enough to combat the damage done from lockdowns, however.
USD/CNH technical forecast
USD/CNH is lower this week, but the pair remains near its highest levels since early 2020. The Relative Strength Index (RSI) is beginning to show possible warning signs after briefly dipping back into neutral territory below 70 last week. The MACD oscillator’s strength also appears to be receding. Those together may signal that the bullish energy in the pair could be exhausted.
USD/CNH daily chart
 Source: TradingView
This information has been prepared by DailyFX, the partner site of IG offering leading forex news and analysis. In addition to the disclaimer below, the material on this page does not contain a record of our trading prices, or an offer of, or solicitation for, a transaction in any financial instrument. IG accepts no responsibility for any use that may be made of these comments and for any consequences that result. No representation or warranty is given as to the accuracy or completeness of this information. Consequently any person acting on it does so entirely at their own risk. Any research provided does not have regard to the specific investment objectives, financial situation and needs of any specific person who may receive it. It has not been prepared in accordance with legal requirements designed to promote the independence of investment research and as such is considered to be a marketing communication. Although we are not specifically constrained from dealing ahead of our recommendations we do not seek to take advantage of them before they are provided to our clients. -
15 hours ago, ADZCAP said:
Hi, was this ever resolved? I'm new to the platform but i find it really difficult scalp trading without a seconds clock.
Hi @ADZCAP,
I have forwarded the above feedback to the relevant department. It will be reviewed and implemented if possible. It is possible that it takes some time as the development may be working on high priority projects.
All the best - Arvin -
On 10/05/2022 at 02:25, WoWoNoob said:
Hi All,
Is it possible to show the position of Simple Moving Averages eg 200ma & 20 ma on charts without the pre & post market data included in their calculations?
I'm new to trading so any help appreciated.
Cheers
Willie
Hi @WoWoNoob,
You can change your Moving average settings by clicking on the bottom left had side of the chart on MA:
The MA will use all the data displayed on the chart. On normal stock you won't have the Pre and Post market displaying, but on All sessions market you will have the Pre and Post market data integrated as they are displaying on the charts.
I hope that it helps - Arvin -
On 21/04/2022 at 00:54, FINANCIALGAINZ said:
Hi guys, I have had a share dealing account with IG for years, but i want to expanding into trading options but are unsure how, the IG app is very unclear but when I Google it I can easily fund that IG does allow this.
Any help?
Hi @FINANCIALGAINZ,
Thank you for your post.
IG offers a free access to the IG Academy. There is a course on options. Once you are logged into your account select Academy at the top right hand corner:
Here's the content of that course:
I hope that it helps !
All the best - Arvin -
8 hours ago, NaveedX said:
Hi,
Sprott Physical Uranium Trust Fund is tradable on the spread betting account but not on the ISA, could you also make it available in the ISA account?
Name of stock - Sprott Physical Uranium Trust Fund
Name of Stock Exchange - Toronto Stock
Leverage or Share dealing - ISA
Ticker - U.UN
Country of the stock - Canada
Market Cap - $US3.03 Billion
Hi @NaveedX,
Thank you for your post. Your request has been submitted.
All the best - Arvin -
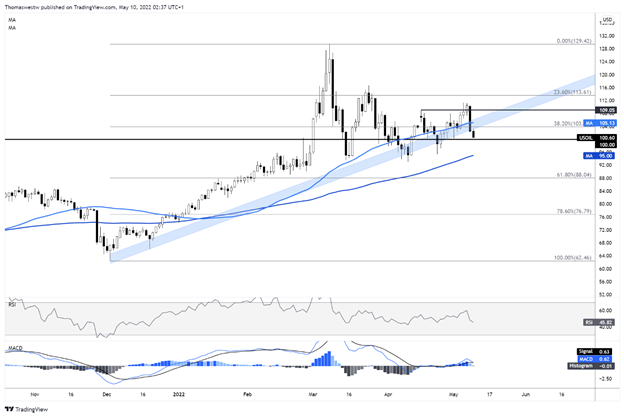
Oil prices continue to fall as economic woes pressure narrative; Saudi Arabia’s state-owned Aramco slashes its June prices and WTI crude prices break below key support above the key 100 level.

Source: BloombergWTI crude oil prices look set to drop further in Asia-Pacific trading following a big overnight plunge. A report from Bloomberg suggesting that the European Union is softening its stance on a proposed ban on Russian oil appeared to drive most of the selling. Objections from Hungary were the main factor holding the bloc back from banning Russian oil outright.
Viktor Orban, Hungary’s Prime Minister, has cited security concerns over the ban, which has been in the works for weeks after Germany capitulated its stance last month. Hungary remains highly reliant on Russian energy products. The EU offered Hungary and Slovakia an exemption previously, but Mr. Orban has stated that his country would need a five-year exemption along with funds to transform Hungary’s infrastructure. The oil market will likely await further news on the next sanction package after the setback.
Meanwhile, broader economic concerns between surging inflation and China’s economic slowdown amid its Covid lockdowns are underpinning worries over the state of the global economy. Central banks are making aggressive shifts to combat prices, aiming to fight high expectations from becoming anchored in the economy, which would only work to further inflame high inflation. Shanghai officials expanded curbs across the city this week even as case numbers drop.
Saudi Arabia’s state-run Saudi Aramco announced it would reduce oil prices for June. The move will bring the premium paid by Asian buyers from over $9 per barrel to $4.40 per barrel. The premium paid for most buyers across Europe would also be reduced next month. The move signals that the major OPEC producer sees demand trailing off, likely induced by the bout of lockdowns across China due to Covid outbreaks. A larger pullback is unlikely given the uncertainty around China’s Covid situation as well as the ongoing conflict in Ukraine.
WTI crude oil technical forecast
Prices pushed below a major trendline and the 50-day Simple Moving Average (SMA), representing a break below confluent support that has helped underpin oil since December 2021. The 100 psychological level is now eyed as the most immediate area for potential support. A drop below that would bring the 100-day SMA into focus, currently at the 95 mark.
WTI crude oil daily chart
Source: TradingViewThomas Westwater | Analyst, DailyFX, New York City
10 May 2022
This information has been prepared by DailyFX, the partner site of IG offering leading forex news and analysis. In addition to the disclaimer below, the material on this page does not contain a record of our trading prices, or an offer of, or solicitation for, a transaction in any financial instrument. IG accepts no responsibility for any use that may be made of these comments and for any consequences that result. No representation or warranty is given as to the accuracy or completeness of this information. Consequently any person acting on it does so entirely at their own risk. Any research provided does not have regard to the specific investment objectives, financial situation and needs of any specific person who may receive it. It has not been prepared in accordance with legal requirements designed to promote the independence of investment research and as such is considered to be a marketing communication. Although we are not specifically constrained from dealing ahead of our recommendations we do not seek to take advantage of them before they are provided to our clients. -
1 hour ago, Scar said:
I have noticed that the IG page has been refreshing/reloading itself once every few min. It is happening with both demo and trading accounts. Even after using a new browser and logged out and in again. It can be very disturbing at times. Anyone noticed the same?
Hi @Scar,
Does that happen when you are on your workspace with charts or on My IG ?
Have you tried to delete your cookies and empty your cache?
Thank you - Arvin -
On 06/05/2022 at 21:49, Erickfotieno1 said:
My account has not yet been approved after a very long period. .please assist.
Hi @Erickfotieno1,
I have edited your post as it is unsafe to publish personal information on a public page.
If you need assistance with your application please reach out to sales.en@ig.com, only this team will be able to give you an update on your application and verify your documents.
All the best - Arvin -
U.S. stocks plummet at the start of the week, dragged down by fears that the U.S. economy is heading for a hard landing and April inflation data, to be released on Wednesday, may be the next big catalyst for the stock market.
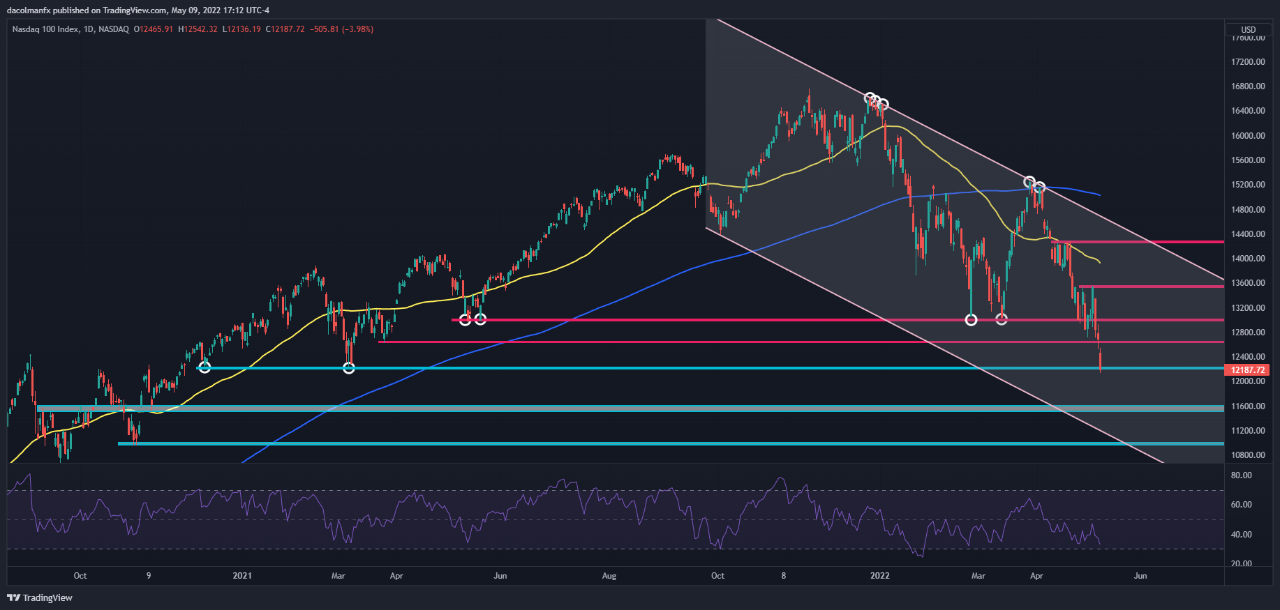
Source: BloombergU.S. stocks plummeted on Monday, extending the relentless sell-off of the previous five weeks, weighed down by recession fears and monetary policy angst. At the market close, the S&P 500 sank 3.2%, losing the psychological 4,000 level and ending the afternoon at 3,991, its lowest level since April 2021. The Dow Jones, for its part, sank 1.99% 32,245, deepening its run into correction territory. Meanwhile, the Nasdaq 100 led the rout on Wall Street, plunging 3.98% to 12,187, a fresh low for 2022. After today's pullback, the tech index accumulates a 27% retreat from its 2021 high.
There was no specific catalyst during the session that caused the monumental and broad-base collapse, other than growing concern that the rising interest rate environment needed to squash inflation may trigger a hard landing for the U.S. economy, a dreadful scenario for corporate earnings and risk assets.
Although the likelihood of a near-term recession remains low due to a healthy labor market and strong consumer spending, the outlook is not static and could change with short notice. For instance, if the equity market continues to drop at the pace of recent weeks, confidence may deteriorate further due to the "wealth effect," leading equity-invested households to sharply reduce discretionary spending, a situation that could slow GDP growth to a crawl.
Looking ahead, the U.S. economic calendar lacks major releases on Tuesday, but Wednesday will bring one high-impact event: the latest inflation report. For sentiment to improve, the data will need to confirm that the consumer price index topped out in March and is starting to come down meaningfully, otherwise the selling momentum is unlikely to abate on Wall Street any time soon. In terms of forecasts, April CPI is expected to come in at 8.1% y/y from 8.5% in the previous month, while the core gauge is seen rising 6% y/y from 6.5% y/y previously.
NASDAQ 100 technical outlook
The Nasdaq 100 nosedived on Monday and set a new 2022 low after sliding below the March 2021’s trough near 12,210, an event with bearish implications for price action. If this breakout is sustained in the coming days, selling pressure could accelerate, paving the way for a move towards the next critical support at 11,600, followed by the psychological 11,000 level. On the flip side, if buyers return and the index manages to climb above the March 2021 low again, the first hurdle to consider appears at 12,645 and 13,000 thereafter. With sentiment deteriorating every single day and volatility on the rise, however, the path of least resistance is lower (for now).
 Source: TradingView
IG Analyst
10 May 2022
This information has been prepared by DailyFX, the partner site of IG offering leading forex news and analysis. In addition to the disclaimer below, the material on this page does not contain a record of our trading prices, or an offer of, or solicitation for, a transaction in any financial instrument. IG accepts no responsibility for any use that may be made of these comments and for any consequences that result. No representation or warranty is given as to the accuracy or completeness of this information. Consequently any person acting on it does so entirely at their own risk. Any research provided does not have regard to the specific investment objectives, financial situation and needs of any specific person who may receive it. It has not been prepared in accordance with legal requirements designed to promote the independence of investment research and as such is considered to be a marketing communication. Although we are not specifically constrained from dealing ahead of our recommendations we do not seek to take advantage of them before they are provided to our clients. -
On 04/05/2022 at 00:03, mariiiam said:
Hi @ArvinIG
It has been a month since you answered that you will look into my problem and get back to me with an answer but I haven’t got any feedback eversince.Could you kindly finally get back to me?
Thank you
Hi @mariiiam,
I Apologies for the delay. I was personally away.
Have you contacted helpdesk.uk@ig.com since?
I will try to get some information on your query.
Thank you - Arvin


Stock Requests
in Shares and ETFs
Posted
Hi @NaveedX,
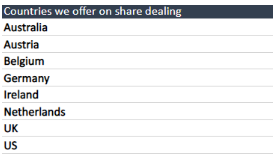
Unfortunately, on Share trading accounts we do not offer Canadian stocks.
Here is the list of countries that we can add :
All the best - Arvin